Simple Scada in Python (continued)
Formation of dynamic mnemonic objects
Developing the theme of the previous article , I will describe some functions for forming mimic objects of a simple SCADA program executed in Python.
Objects visually display the status of analog measured values from the
READ_INPUT_REGISTERS or READ_HOLDING_REGISTERS registers. The Tkinter library is used.
In total, 3 objects are implemented: a horizontal slider, a vertical slider, and an arrow indicator. The construction of a dynamic trend is described separately.
Horizontal slider

First you need to create a canvas object and get a link to it.
This object will be placed on the already created root object.
from Tkinter import *
#создаем родительский объект
root = Tk()
canv = Canvas(root,width=1900,height=950,bg="black",bd=0, highlightthickness=0, relief='ridge')
canv.place(x=0, y=25)
#создаем объект горизонтального слайдера
c = Canvas(root,width=400,height=50,bg="black")
#размещаем в координатах
c.place(x=10, y=20)
root - a link to the parent object.
width = 400 - width.
height = 50 - height.
bg = "black" is the background.
Now you are drawing slider elements using graphic primitives.
But in order to correctly draw elements, it is better to create a function.
def hMeterC(nowValue,x,y,widgLen,widgHigh,maxValue,outerColor,nameValue)
Here are the input variables:
nowValue is the current measured value.
x - X coordinate.
y - Y coordinate.
widgLen - slider length.
widgHigh - slider height.
maxValue is the maximum allowed value.
outerColor - fill color.
nameValue - the name of the measured value.
hMeterC
 def hMeterC(nowValue,x,y,widgLen,widgHigh,maxValue,outerColor,nameValue):
     c = Canvas(root,width=widgLen+50,height=widgHigh+40,bg="black",bd=0, highlightthickness=0, relief='ridge')
     c.place(x=x, y=y)
     if(nowValue > maxValue): nowValue=maxValue-1
     devValue=float(widgLen) / float(maxValue)
     mesureValue = devValue * nowValue
     c.create_rectangle(1,1,widgLen,widgHigh,fill='black',outline=outerColor)
     c.create_rectangle(2,2,int(mesureValue),widgHigh-1,fill='red',outline='red')
     c.create_line(1,widgHigh,1,widgHigh+5,width=1,fill=outerColor)
     c.create_line(widgLen,widgHigh,widgLen,widgHigh+5,width=1,fill=outerColor)
     c.create_line(1+widgLen/4,widgHigh,1+widgLen/4 ,widgHigh+5,width=1,fill=outerColor)
     c.create_line(1+widgLen/2,widgHigh,1+widgLen/2 ,widgHigh+5,width=1,fill=outerColor)
     c.create_line(1+widgLen-widgLen/4,widgHigh,1+widgLen-widgLen/4 ,widgHigh+5,width=1,fill=outerColor)
     c.create_text(0,widgHigh+10,font="Verdana 10",anchor="w",justify=CENTER,fill='white',text='0')
     c.create_text(widgLen -10,widgHigh+10,font="Verdana 10",anchor="w",justify=CENTER,fill='white',text=str(maxValue))
     c.create_text(widgLen/2 -10,widgHigh+10,font="Verdana 10",anchor="w",justify=CENTER,fill='white',text=str(int(maxValue/2)))
     c.create_text(widgLen/4-10,widgHigh+10,font="Verdana 10",anchor="w",justify=CENTER,fill='white',text=str(int(maxValue/4)))
     c.create_text(widgLen-widgLen/4-10,widgHigh+10,font="Verdana 10",anchor="w",justify=CENTER,fill='white',text=str(int(maxValue-maxValue/4)))
     c.create_text(widgLen/2 -10,widgHigh-8,font="Verdana 12",anchor="w",justify=CENTER,fill='white',text=str(int(nowValue)))
     c.create_text(1,widgHigh+21,font="Verdana 10",anchor="w",justify=CENTER,fill='white',text=nameValue)
     return (c,'hmeter',x,y,widgLen,widgHigh,maxValue,outerColor,nameValue)
When executing the code below, a horizontal slider will be formed on the screen in the window, filled 25 percent in red and display the current measured value in the middle or to the right of the slider.
If this happens, then the code works without errors.
Program code.
from Tkinter import *
def hMeterC(nowValue,x,y,widgLen,widgHigh,maxValue,outerColor,nameValue):
     c = Canvas(root,width=widgLen+50,height=widgHigh+40,bg="black",bd=0, highlightthickness=0, relief='ridge')
     c.place(x=x, y=y)
     if(nowValue > maxValue): nowValue=maxValue-1
     devValue=float(widgLen) / float(maxValue)
     mesureValue = devValue * nowValue
     c.create_rectangle(1,1,widgLen,widgHigh,fill='black',outline=outerColor)
     c.create_rectangle(2,2,int(mesureValue),widgHigh-1,fill='red',outline='red')
     c.create_line(1,widgHigh,1,widgHigh+5,width=1,fill=outerColor)
     c.create_line(widgLen,widgHigh,widgLen,widgHigh+5,width=1,fill=outerColor)
     c.create_line(1+widgLen/4,widgHigh,1+widgLen/4 ,widgHigh+5,width=1,fill=outerColor)
     c.create_line(1+widgLen/2,widgHigh,1+widgLen/2 ,widgHigh+5,width=1,fill=outerColor)
     c.create_line(1+widgLen-widgLen/4,widgHigh,1+widgLen-widgLen/4 ,widgHigh+5,width=1,fill=outerColor)
     c.create_text(0,widgHigh+10,font="Verdana 10",anchor="w",justify=CENTER,fill='white',text='0')
     c.create_text(widgLen -10,widgHigh+10,font="Verdana 10",anchor="w",justify=CENTER,fill='white',text=str(maxValue))
     c.create_text(widgLen/2 -10,widgHigh+10,font="Verdana 10",anchor="w",justify=CENTER,fill='white',text=str(int(maxValue/2)))
     c.create_text(widgLen/4-10,widgHigh+10,font="Verdana 10",anchor="w",justify=CENTER,fill='white',text=str(int(maxValue/4)))
     c.create_text(widgLen-widgLen/4-10,widgHigh+10,font="Verdana 10",anchor="w",justify=CENTER,fill='white',text=str(int(maxValue-maxValue/4)))
     c.create_text(widgLen/2 -10,widgHigh-8,font="Verdana 12",anchor="w",justify=CENTER,fill='white',text=str(int(nowValue)))
     c.create_text(1,widgHigh+21,font="Verdana 10",anchor="w",justify=CENTER,fill='white',text=nameValue)
     return (c,'hmeter',x,y,widgLen,widgHigh,maxValue,outerColor,nameValue)
root = Tk()
canv = Canvas(root,width=1900,height=950,bg="black")
canv.place(x=0, y=25)
analogFig=hMeterC(250,20,50,300,20,1000,'red','analog Meter')
root.mainloop()
But this is just a static display of the “horizontal slider” object.
You need to add speakers. To do this, use the root.after method and slightly change the display functions of the slider.
The hMeterC function will take the form:
def hMeterC(nowValue,x,y,widgLen,widgHigh,maxValue,outerColor,nameValue):
     c = Canvas(root,width=widgLen+50,height=widgHigh+40,bg="black",bd=0, highlightthickness=0, relief='ridge')
     c.place(x=x, y=y)
     return (c,'hmeter',x,y,widgLen,widgHigh,maxValue,outerColor,nameValue)
That is, the hMeterC function will return an array of parameters of the created object, and drawing another graphic function will carry out
hMeter:
def hMeter(c,nowValue,x,y,widgLen,widgHigh,maxValue,outerColor,nameValue):
     if(nowValue > maxValue): nowValue=maxValue-1
     devValue=float(widgLen) / float(maxValue)
     mesureValue = devValue * nowValue
     c.create_rectangle(1,1,widgLen,widgHigh,fill='black',outline=outerColor)
     c.create_rectangle(2,2,int(mesureValue),widgHigh-1,fill=outerColor,outline=outerColor)
     c.create_line(1,widgHigh,1,widgHigh+5,width=1,fill=outerColor)
     c.create_line(widgLen,widgHigh,widgLen,widgHigh+5,width=1,fill=outerColor)
     c.create_line(1+widgLen/4,widgHigh,1+widgLen/4 ,widgHigh+5,width=1,fill=outerColor)
     c.create_line(1+widgLen/2,widgHigh,1+widgLen/2 ,widgHigh+5,width=1,fill=outerColor)
     c.create_line(1+widgLen-widgLen/4,widgHigh,1+widgLen-widgLen/4 ,widgHigh+5,width=1,fill=outerColor)
     c.create_text(0,widgHigh+10,font="Verdana 10",anchor="w",justify=CENTER,fill='white',text='0')
     c.create_text(widgLen -10,widgHigh+10,font="Verdana 10",anchor="w",justify=CENTER,fill='white',text=str(maxValue))
     c.create_text(widgLen/2 -10,widgHigh+10,font="Verdana 10",anchor="w",justify=CENTER,fill='white',text=str(int(maxValue/2)))
     c.create_text(widgLen/4-10,widgHigh+10,font="Verdana 10",anchor="w",justify=CENTER,fill='white',text=str(int(maxValue/4)))
     c.create_text(widgLen-widgLen/4-10,widgHigh+10,font="Verdana 10",anchor="w",justify=CENTER,fill='white',text=str(int(maxValue-maxValue/4)))
     c.create_text(widgLen +10,widgHigh-8,font="Verdana 12",anchor="w",justify=CENTER,fill=outerColor,text=str(int(nowValue)))
     c.create_text(1,widgHigh+21,font="Verdana 10",anchor="w",justify=CENTER,fill='white',text=nameValue)
Необходимо добавить еще функцию цикла def jobMeter() для root.after,
def jobMeter():
    hMeter(c,nowValue,x,y,widgLen,widgHigh,maxValue,outerColor,nameValue)
    root.after(100, jobMeter)
Теперь код программы немного изменился.
Код программы
import time
from Tkinter import *
import random
def hMeter(c,nowValue,x,y,widgLen,widgHigh,maxValue,outerColor,nameValue):
     if(nowValue > maxValue): nowValue=maxValue-1
     devValue=float(widgLen) / float(maxValue)
     mesureValue = devValue * nowValue
     c.create_rectangle(1,1,widgLen,widgHigh,fill='black',outline=outerColor)
     c.create_rectangle(2,2,int(mesureValue),widgHigh-1,fill=outerColor,outline=outerColor)
     c.create_line(1,widgHigh,1,widgHigh+5,width=1,fill=outerColor)
     c.create_line(widgLen,widgHigh,widgLen,widgHigh+5,width=1,fill=outerColor)
     c.create_line(1+widgLen/4,widgHigh,1+widgLen/4 ,widgHigh+5,width=1,fill=outerColor)
     c.create_line(1+widgLen/2,widgHigh,1+widgLen/2 ,widgHigh+5,width=1,fill=outerColor)
     c.create_line(1+widgLen-widgLen/4,widgHigh,1+widgLen-widgLen/4 ,widgHigh+5,width=1,fill=outerColor)
     c.create_text(0,widgHigh+10,font="Verdana 10",anchor="w",justify=CENTER,fill='white',text='0')
     c.create_text(widgLen -10,widgHigh+10,font="Verdana 10",anchor="w",justify=CENTER,fill='white',text=str(maxValue))
     c.create_text(widgLen/2 -10,widgHigh+10,font="Verdana 10",anchor="w",justify=CENTER,fill='white',text=str(int(maxValue/2)))
     c.create_text(widgLen/4-10,widgHigh+10,font="Verdana 10",anchor="w",justify=CENTER,fill='white',text=str(int(maxValue/4)))
     c.create_text(widgLen-widgLen/4-10,widgHigh+10,font="Verdana 10",anchor="w",justify=CENTER,fill='white',text=str(int(maxValue-maxValue/4)))
     c.create_text(widgLen +10,widgHigh-8,font="Verdana 12",anchor="w",justify=CENTER,fill=outerColor,text=str(int(nowValue)))
     c.create_text(1,widgHigh+21,font="Verdana 10",anchor="w",justify=CENTER,fill='white',text=nameValue)
def hMeterC(nowValue,x,y,widgLen,widgHigh,maxValue,outerColor,nameValue):
     c = Canvas(root,width=widgLen+50,height=widgHigh+40,bg="black",bd=0, highlightthickness=0, relief='ridge')
     c.place(x=x, y=y)
     return (c,'hmeter',x,y,widgLen,widgHigh,maxValue,outerColor,nameValue)
def jobMeter():
    hMeter(analogFig[0],100,analogFig[2],analogFig[3],analogFig[4],analogFig[5],analogFig[6],analogFig[7],analogFig[8])
    root.after(100, jobMeter)
root = Tk()
canv = Canvas(root,width=1900,height=950,bg="black")
canv.place(x=0, y=25)
analogFig=hMeterC(250,20,50,300,20,1000,'red','analog Meter')
root.after(100, jobMeter)
root.mainloop()
Каждую 0.1 секунды, объект слайдера будет обновляться, но нужно сказать,
что изменений никаких происходить не будет, потому что в переменной nowValue функции hMeter всегда присутствует неизменяемое значение 100.
Чтобы исправить эту ситуацию и продемонстрировать динамические свойства объекта предлагается воспользоваться библиотекой random и внести изменения в код.
import random
def jobMeter():
    hMeter(analogFig[0],random.randint(30, 800),analogFig[2],analogFig[3],analogFig[4],analogFig[5],analogFig[6],analogFig[7],analogFig[8])
    root.after(100, jobMeter)
Теперь будут очевидные изменения в положении слайдера.
Но в данном случае присутствуют два неприятных факта.
- Созданный скрипт по объему занимает не так много памяти, но при выполнении объем занимаемой памяти увеличивается.
- The numbers on the right displaying the current value cannot be distinguished.
This is all explained simply.
Each time a new measured value is formed on the canvas, the
graphic primitives are redrawn, but the old elements are also preserved.
Overlay new elements on the previous ones.
To get rid of this effect, you need to add a canvas cleanup of old elements
to the jobMeter () function .
def jobMeter():
    analogFig[0].delete("all")
    hMeter(analogFig[0],100,analogFig[2],analogFig[3],analogFig[4],analogFig[5],analogFig[6],analogFig[7],analogFig[8])
    root.after(100, jobMeter)
Now the memory does not increase and the numbers are displayed correctly.
Vertical slider
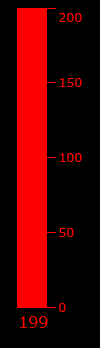
Everything here is similar to horizontal, only the configuration of drawing primitives changes a little.
Functions
def vMeterC(nowValue,x,y,widgLen,widgHigh,maxValue,outerColor,nameValue):
         c = Canvas(root,width=widgLen+50,height=widgHigh+40,bg="black",bd=0, highlightthickness=0, relief='ridge')
         c.place(x=x, y=y)
         return (c,'vmeter',x,y,widgLen,widgHigh,maxValue,outerColor,nameValue)
def vMeter(c,nowValue,x,y,widgLen,widgHigh,maxValue,outerColor,nameValue):
         if(nowValue > maxValue): nowValue=maxValue-1
         devValue=float(widgHigh) / float(maxValue)
         mesureValue = devValue * nowValue
         c.create_rectangle(1,1,widgLen,widgHigh,fill='black',outline=outerColor)
         c.create_rectangle(widgLen-1,widgHigh,2,widgHigh-int(mesureValue),fill=outerColor,outline=outerColor)
         c.create_line(widgLen,widgHigh,widgLen+10,widgHigh,width=1,fill=outerColor)
         c.create_line(widgLen,widgHigh/4,widgLen+10,widgHigh/4,width=1,fill=outerColor)
         c.create_line(widgLen,widgHigh/2,widgLen+10,widgHigh/2,width=1,fill=outerColor)
         c.create_line(widgLen,widgHigh-widgHigh/4,widgLen+10,widgHigh-widgHigh/4,width=1,fill=outerColor)
         c.create_line(widgLen,1,widgLen+10,1,width=1,fill=outerColor)
         c.create_line(widgLen+10,widgHigh,widgLen+10 ,widgHigh,width=1,fill=outerColor)
         c.create_text(widgLen+12,widgHigh,font="Verdana 10",anchor="w",justify=CENTER,fill=outerColor,text='0')
         c.create_text(widgLen+12,10,font="Verdana 10",anchor="w",justify=CENTER,fill=outerColor,text=str(maxValue))
         c.create_text(widgLen+12,widgHigh/2,font="Verdana 10",anchor="w",justify=CENTER,fill=outerColor,text=str(maxValue/2))
         c.create_text(widgLen+12,widgHigh-widgHigh/4,font="Verdana 10",anchor="w",justify=CENTER,fill=outerColor,text=str(maxValue/4))
         c.create_text(widgLen+12,widgHigh/4,font="Verdana 10",anchor="w",justify=CENTER,fill=outerColor,text=str(maxValue-maxValue/4))
         c.create_text(2,widgHigh+15,font="Verdana 12",anchor="w",justify=CENTER,fill=outerColor,text=str(nowValue))
Dial gauge.
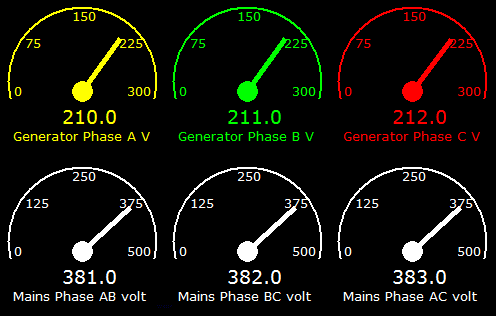
To create this object, you will have to import the math library, since the
mathematical functions sin and cos are used.
Functions
def aMeterC(nowValue,x,y,widgLen,widgHigh,maxValue,outerColor,nameValue):
         c = Canvas(root,width=widgLen,height=widgHigh,bg="black",bd=0, highlightthickness=0, relief='ridge')
         c.place(x=x, y=y)
         return (c,'ameter',x,y,widgLen,widgHigh,maxValue,outerColor,nameValue)
def aMeter(c,nowValue,x,y,widgLen,widgHigh,maxValue,outerColor,nameValue):
         if(nowValue > maxValue): nowValue=maxValue-1
         devValue=float(180) / float(maxValue)
         mesureValue = devValue * nowValue
         x1 = widgLen/2
         y1 = widgHigh/2 + 10
         x2 = 10
         y2 = widgHigh/2 + 10
         angle = math.pi * int(mesureValue) / 180;
         newx = ((x2-x1)*math.cos(angle)-(y2-y1)*math.sin(angle)) + x1
         newy = ((x2-x1)*math.sin(angle)+(y2-y1)*math.cos(angle)) + y1
         c.create_oval(1 , 1,widgLen-1 ,widgHigh-1,width=2,fill='black',outline=outerColor)
         c.create_text(7,y1,font="Verdana 10",anchor="w",justify=CENTER,fill=outerColor,text='0')
         c.create_text(widgLen-30,y1,font="Verdana 10",anchor="w",justify=CENTER,fill=outerColor,text=str(maxValue))
         c.create_text(widgLen/2-10,10,font="Verdana 10",anchor="w",justify=CENTER,fill=outerColor,text=str(maxValue/2))
         c.create_text(widgLen/8,widgHigh/4,font="Verdana 10",anchor="w",justify=CENTER,fill=outerColor,text=str(maxValue/4))
         c.create_text(widgLen/2+widgLen/4,widgHigh/4,font="Verdana 10",anchor="w",justify=CENTER,fill=outerColor,text=str(maxValue-maxValue/4))
         c.create_text(widgLen/2-20,widgHigh-40,font="Verdana 14",anchor="w",justify=CENTER,fill=outerColor,text=str(nowValue))
         c.create_rectangle(0,widgHigh/2+18,widgLen ,widgHigh,fill='black',outline='black')
         c.create_text(widgLen/2-20,widgHigh-40,font="Verdana 14",anchor="w",justify=CENTER,fill=outerColor,text=str(nowValue))
         c.create_text(6,widgHigh-20,font="Verdana 10",anchor="w",justify=CENTER,fill=outerColor,text=str(nameValue))
         c.create_oval(x1 - 10, y1 - 10, x1+ 10,y1 + 10,fill=outerColor,outline=outerColor)
         c.create_line(x1,y1,newx,newy,width=5,fill=outerColor)
Dynamic graph

The last thing I would like to say is the construction of a dynamic graph. There is a matplotlib library, which implements many convenient tools for plotting, as well as a large amount of documentation. But I will describe a simple way to create a dynamic graph using the tkinter library.
The creation of the object is carried out similarly to the previous examples, but the readings should be transmitted as an array, where each new element is added to the end using the append method.
After that, the object is redrawn.
Suppose at time
stamp 0 there is an array with the last measured value (100), when forming a new timestamp, a new array element will be added and a new measured value will be written to it, let it be (110).
It turns out approximately such a table.
0.0 s - (100)
0.1 s - (100,110)
0.2 s - (100,110,90)
0.3 s - (100,110,90,120)
0.4 s - (100,110,90,120,100)
, etc.
Upon reaching the number of elements of the array of a given value, the
array is reset to zero and the process repeats again.
if(len(mesureValue) == 80):
         mesureValue=None
         mesureValue=[]
Thus, the curve of readings reaches the final border of the canvas of the chart object,
after that the values are reset to zero and the process of accumulating data in the array is repeated.
The following is a simple example of a program that demonstrates the operation of all the above mimic objects.
Program code
import time
from Tkinter import *
import random
import math
def hMeter(c,nowValue,x,y,widgLen,widgHigh,maxValue,outerColor,nameValue):
     if(nowValue > maxValue): nowValue=maxValue-1
     devValue=float(widgLen) / float(maxValue)
     mesureValue = devValue * nowValue
     c.create_rectangle(1,1,widgLen,widgHigh,fill='black',outline=outerColor)
     c.create_rectangle(2,2,int(mesureValue),widgHigh-1,fill=outerColor,outline=outerColor)
     c.create_line(1,widgHigh,1,widgHigh+5,width=1,fill=outerColor)
     c.create_line(widgLen,widgHigh,widgLen,widgHigh+5,width=1,fill=outerColor)
     c.create_line(1+widgLen/4,widgHigh,1+widgLen/4 ,widgHigh+5,width=1,fill=outerColor)
     c.create_line(1+widgLen/2,widgHigh,1+widgLen/2 ,widgHigh+5,width=1,fill=outerColor)
     c.create_line(1+widgLen-widgLen/4,widgHigh,1+widgLen-widgLen/4 ,widgHigh+5,width=1,fill=outerColor)
     c.create_text(0,widgHigh+10,font="Verdana 10",anchor="w",justify=CENTER,fill='white',text='0')
     c.create_text(widgLen -10,widgHigh+10,font="Verdana 10",anchor="w",justify=CENTER,fill='white',text=str(maxValue))
     c.create_text(widgLen/2 -10,widgHigh+10,font="Verdana 10",anchor="w",justify=CENTER,fill='white',text=str(int(maxValue/2)))
     c.create_text(widgLen/4-10,widgHigh+10,font="Verdana 10",anchor="w",justify=CENTER,fill='white',text=str(int(maxValue/4)))
     c.create_text(widgLen-widgLen/4-10,widgHigh+10,font="Verdana 10",anchor="w",justify=CENTER,fill='white',text=str(int(maxValue-maxValue/4)))
     c.create_text(widgLen +10,widgHigh-8,font="Verdana 12",anchor="w",justify=CENTER,fill=outerColor,text=str(int(nowValue)))
     c.create_text(1,widgHigh+21,font="Verdana 10",anchor="w",justify=CENTER,fill='white',text=nameValue)
def hMeterC(nowValue,x,y,widgLen,widgHigh,maxValue,outerColor,nameValue):
     c = Canvas(root,width=widgLen+50,height=widgHigh+40,bg="black",bd=0, highlightthickness=0, relief='ridge')
     c.place(x=x, y=y)
     return (c,'hmeter',x,y,widgLen,widgHigh,maxValue,outerColor,nameValue)
def vMeterC(nowValue,x,y,widgLen,widgHigh,maxValue,outerColor,nameValue):
         c = Canvas(root,width=widgLen+50,height=widgHigh+40,bg="black",bd=0, highlightthickness=0, relief='ridge')
         c.place(x=x, y=y)
         return (c,'vmeter',x,y,widgLen,widgHigh,maxValue,outerColor,nameValue)
def vMeter(c,nowValue,x,y,widgLen,widgHigh,maxValue,outerColor,nameValue):
         if(nowValue > maxValue): nowValue=maxValue-1
         devValue=float(widgHigh) / float(maxValue)
         mesureValue = devValue * nowValue
         c.create_rectangle(1,1,widgLen,widgHigh,fill='black',outline=outerColor)
         c.create_rectangle(widgLen-1,widgHigh,2,widgHigh-int(mesureValue),fill=outerColor,outline=outerColor)
         c.create_line(widgLen,widgHigh,widgLen+10,widgHigh,width=1,fill=outerColor)
         c.create_line(widgLen,widgHigh/4,widgLen+10,widgHigh/4,width=1,fill=outerColor)
         c.create_line(widgLen,widgHigh/2,widgLen+10,widgHigh/2,width=1,fill=outerColor)
         c.create_line(widgLen,widgHigh-widgHigh/4,widgLen+10,widgHigh-widgHigh/4,width=1,fill=outerColor)
         c.create_line(widgLen,1,widgLen+10,1,width=1,fill=outerColor)
         c.create_line(widgLen+10,widgHigh,widgLen+10 ,widgHigh,width=1,fill=outerColor)
         c.create_text(widgLen+12,widgHigh,font="Verdana 10",anchor="w",justify=CENTER,fill=outerColor,text='0')
         c.create_text(widgLen+12,10,font="Verdana 10",anchor="w",justify=CENTER,fill=outerColor,text=str(maxValue))
         c.create_text(widgLen+12,widgHigh/2,font="Verdana 10",anchor="w",justify=CENTER,fill=outerColor,text=str(maxValue/2))
         c.create_text(widgLen+12,widgHigh-widgHigh/4,font="Verdana 10",anchor="w",justify=CENTER,fill=outerColor,text=str(maxValue/4))
         c.create_text(widgLen+12,widgHigh/4,font="Verdana 10",anchor="w",justify=CENTER,fill=outerColor,text=str(maxValue-maxValue/4))
         c.create_text(2,widgHigh+15,font="Verdana 12",anchor="w",justify=CENTER,fill=outerColor,text=str(nowValue))
def aMeterC(nowValue,x,y,widgLen,widgHigh,maxValue,outerColor,nameValue):
         c = Canvas(root,width=widgLen,height=widgHigh,bg="black",bd=0, highlightthickness=0, relief='ridge')
         c.place(x=x, y=y)
         return (c,'ameter',x,y,widgLen,widgHigh,maxValue,outerColor,nameValue)
def aMeter(c,nowValue,x,y,widgLen,widgHigh,maxValue,outerColor,nameValue):
         if(nowValue > maxValue): nowValue=maxValue-1
         devValue=float(180) / float(maxValue)
         mesureValue = devValue * nowValue
         x1 = widgLen/2
         y1 = widgHigh/2 + 10
         x2 = 10
         y2 = widgHigh/2 + 10
         angle = math.pi * int(mesureValue) / 180;
         newx = ((x2-x1)*math.cos(angle)-(y2-y1)*math.sin(angle)) + x1
         newy = ((x2-x1)*math.sin(angle)+(y2-y1)*math.cos(angle)) + y1
         c.create_oval(1 , 1,widgLen-1 ,widgHigh-1,width=2,fill='black',outline=outerColor)
         c.create_text(7,y1,font="Verdana 10",anchor="w",justify=CENTER,fill=outerColor,text='0')
         c.create_text(widgLen-30,y1,font="Verdana 10",anchor="w",justify=CENTER,fill=outerColor,text=str(maxValue))
         c.create_text(widgLen/2-10,10,font="Verdana 10",anchor="w",justify=CENTER,fill=outerColor,text=str(maxValue/2))
         c.create_text(widgLen/8,widgHigh/4,font="Verdana 10",anchor="w",justify=CENTER,fill=outerColor,text=str(maxValue/4))
         c.create_text(widgLen/2+widgLen/4,widgHigh/4,font="Verdana 10",anchor="w",justify=CENTER,fill=outerColor,text=str(maxValue-maxValue/4))
         c.create_text(widgLen/2-20,widgHigh-40,font="Verdana 14",anchor="w",justify=CENTER,fill=outerColor,text=str(nowValue))
         c.create_rectangle(0,widgHigh/2+18,widgLen ,widgHigh,fill='black',outline='black')
         c.create_text(widgLen/2-20,widgHigh-40,font="Verdana 14",anchor="w",justify=CENTER,fill=outerColor,text=str(nowValue))
         c.create_text(6,widgHigh-20,font="Verdana 10",anchor="w",justify=CENTER,fill=outerColor,text=str(nameValue))
         c.create_oval(x1 - 10, y1 - 10, x1+ 10,y1 + 10,fill=outerColor,outline=outerColor)
         c.create_line(x1,y1,newx,newy,width=5,fill=outerColor)
def hTrendC(x,y,widgLen,widgHigh,maxValue,outerColor,nameValue,trendKoef):
         c = Canvas(root,width=widgLen+50,height=widgHigh+40,bg="black",bd=0, highlightthickness=0, relief='ridge')
         c.place(x=x, y=y)
         return (c,'htrend',x,y,widgLen,widgHigh,maxValue,outerColor,nameValue,trendKoef)
def hTrend(arrayData,arrayValue):
         c,markErr,x,y,widgLen,widgHigh,maxValue,outerColor,nameValue,trendKoef=arrayData
         c.create_rectangle(1,1,widgLen,widgHigh,fill='black',outline=outerColor)
         c.create_line(50,widgHigh/2,widgLen-5,widgHigh/2,width=0.1,fill='white',dash=(4, 2))
         c.create_line(50,widgHigh/4,widgLen-5,widgHigh/4,width=0.1,fill='white',dash=(4, 2))
         c.create_line(50,widgHigh - widgHigh/4,widgLen-5,widgHigh -widgHigh/4,width=0.2,fill='white',dash=(4, 2))
         c.create_text(10,widgHigh-10,font="Verdana 10",anchor="w",justify=CENTER,fill='white',text=0)
         c.create_text(10,12,font="Verdana 10",anchor="w",justify=CENTER,fill='white',text=str(maxValue))
         c.create_text(10,widgHigh/2,font="Verdana 10",anchor="w",justify=CENTER,fill='white',text=str(int(maxValue/2)))
         c.create_text(10,widgHigh/4,font="Verdana 10",anchor="w",justify=CENTER,fill='white',text=str(int(maxValue-maxValue/4)))
         c.create_text(10,widgHigh - widgHigh/4 ,font="Verdana 10",anchor="w",justify=CENTER,fill='white',text=str(int(maxValue/4)))
         c.create_text(1,widgHigh+25,font="Verdana 10",anchor="w",justify=CENTER,fill='white',text=nameValue)
         c.create_text(widgLen/10,widgHigh+10,font="Verdana 10",anchor="w",justify=CENTER,fill='white',text='1')
         c.create_text((widgLen/10)*2,widgHigh+10,font="Verdana 10",anchor="w",justify=CENTER,fill='white',text='2')
         c.create_text((widgLen/10)*3,widgHigh+10,font="Verdana 10",anchor="w",justify=CENTER,fill='white',text='3')
         c.create_text((widgLen/10)*4,widgHigh+10,font="Verdana 10",anchor="w",justify=CENTER,fill='white',text='4')
         c.create_text((widgLen/10)*5,widgHigh+10,font="Verdana 10",anchor="w",justify=CENTER,fill='white',text='5')
         c.create_text((widgLen/10)*6,widgHigh+10,font="Verdana 10",anchor="w",justify=CENTER,fill='white',text='6')
         c.create_text((widgLen/10)*7,widgHigh+10,font="Verdana 10",anchor="w",justify=CENTER,fill='white',text='7')
         c.create_text((widgLen/10)*8,widgHigh+10,font="Verdana 10",anchor="w",justify=CENTER,fill='white',text='8')
         c.create_text((widgLen/10)*9,widgHigh+10,font="Verdana 10",anchor="w",justify=CENTER,fill='white',text='9')
         c.create_text(widgLen-10,widgHigh+10,font="Verdana 10",anchor="w",justify=CENTER,fill='white',text='100')
         oldy=widgHigh - float(widgHigh)/float(maxValue) * arrayValue[0] * int(trendKoef)
         oldx=5
         xval=0
         for counter in range(0,len(arrayValue)):
             val=arrayValue[counter]
             yval=widgHigh - float(widgHigh)/float(maxValue) * val * int(trendKoef)
             xval+=10
             c.create_line(oldx,oldy,xval,yval,width=1.5,fill='green')
             oldy=yval
             oldx=xval
         mesureValue = arrayValue[len(arrayValue)-1 ] * int(trendKoef)
         c.create_line(xval,widgHigh-10,xval,0,width=0.5,fill='white')
         c.create_text(xval+10,yval,font="Verdana 10",anchor="w",justify=CENTER,fill='white',text=str(mesureValue))
         c.create_text(xval+10,yval+20,font="Verdana 10",anchor="w",justify=CENTER,fill='white',text=time.strftime('%H:%M:%S'))
def jobMeter():
     global mesureValue
     analogFig[0].delete("all")
     analogVertical[0].delete("all")
     analogString[0].delete("all")
     hMeter(analogFig[0],random.randint(30, 800),analogFig[2],analogFig[3],analogFig[4],analogFig[5],analogFig[6],analogFig[7],analogFig[8])
     vMeter(analogVertical[0],random.randint(30, 800),analogVertical[2],analogVertical[3],analogVertical[4],analogVertical[5],analogVertical[6],analogVertical[7],analogVertical[8])
     aMeter(analogString[0],random.randint(30, 800),analogString[2],analogString[3],analogString[4],analogString[5],analogString[6],analogString[7],analogString[8])
     lenVal = len(mesureValue)+1
     mesureValue.append(lenVal)
     mesureValue[lenVal-1] = random.randint(30, 800)
     trend[0].delete("all")
     hTrend(trend,mesureValue)
     if(len(mesureValue) == 80):
         mesureValue=None
         mesureValue=[]
     root.after(100, jobMeter)
root = Tk()
canv = Canvas(root,width=1900,height=950,bg="black")
canv.place(x=0, y=25)
analogFig=hMeterC(250,20,50,300,20,1000,'red','analog Meter')
analogVertical=vMeterC(250,42,150,30,200,1000,'red','analog Meter')
analogString=aMeterC(250,200,150,150,150,1000,'green','analog Meter')
global mesureValue
mesureValue=[]
trend=hTrendC(450,28,800,400,1000,'green','analog', '1')
root.after(1, jobMeter)
root.mainloop()
More examples can be found here.