HomeKit and ioBroker Let's be friends houses

Without a doubt, Apple iOS remains one of the most popular mobile operating systems, which means that modern automation systems should be able to integrate into this ecosystem and provide interoperability. This is the purpose of the Homekit framework, which allows you to work with smart devices from the iPhone / iPad / iWatch screen, and more recently from Mac (macOS Mojave).
Most automation systems (I don’t like the marketing name "smart home") have long contain integration modules with Homekit, but even a trained user is not always easy to figure out how to make his device accessible in the Home application (or Eve).
Today I will tell you how to do these manipulations in the ioBroker system (this is an open and free automation system). But in order not to stupidly cite all the many examples of devices, I want to explain some principles and show approaches, knowing that, you can easily implement the other examples.
"Knowing some principles easily compensates for ignorance of some facts."
Claude Adrian Helvetius
ioBroker. Drivers, devices and states
First of all I want to explain what a device is in the ioBroker system, and how it is presented.
Let me remind you that the ioBroker system is modular, and the extension modules are called drivers (or adapters). A driver is an integration module with a device or a group of devices united by a common functionality, protocol or manufacturer, and therefore it can drag one to several devices into the ioBroker system. Another feature is the ability to create multiple instances of the same driver, differing in any settings.
But each device is unique and unique, has different characteristics and capabilities. Based on this, in ioBroker, they are primarily focused not on the device itself, but on its characteristics, which are represented by states. A state is an internal ioBroker object that accepts and stores any value. Synonyms of the state can be considered: signs, attributes, characteristics, properties, events. Examples of states: "temperature", "brightness level", "battery level", "switch on indicator", "error sign", "click sign", "double click sign", etc. Thus, each device is represented by many different states.

States can be divided into informative - display information from the device, and changeable - can be changed by the user or a script and send these changes to the device. Accordingly, when something changes on the device — this data is displayed in states, and when ioBroker changes state (by user or script), the device receives a signal about the change and should react accordingly (this depends on the device itself and the driver that is with it works).
All device states are combined into a single tree (registry) of states. They are grouped first by device (in some cases, grouping by channel is also applied), and then by driver instances.
The concept of topics of the MQTT protocol easily fits into such a state tree. In this way, you can connect additional equipment or third-party systems that support the MQTT-protocol. Just put the MQTT-driver - the corresponding branch will appear in the state tree.
And there are all sorts of online services that can provide useful information and / or give the ability to control other equipment (car alarms, for example). The result of interaction with these services is also represented as a set of states.

In total, a device in ioBroker is represented as a set of states that characterize the device and allow it to interact with it.
Homekit. Accessories, services and specifications
Now turn to Homekit. It applies the classification of devices, their functionality and characteristics.

Accessories are the equivalent of a physical device. The accessory has a category for assigning it to a specific group.
Services (Services) is the equivalent of the functionality that the accessory has. One accessory may have several services.
Services indicate the capabilities of the device: lamp, battery, button, air quality sensor, door, air cleaner, camera ..
It is the service that determines the display, device behavior and a set of characteristics.
Characteristics is the equivalent of the attributes / properties that characterize the service. It is the characteristics that determine whether the device is on, the brightness level of the lamp, or how many times a button is pressed. One service can have many characteristics.

Applications that work with Homekit read the services and features of the accessories, and then display and let you change the values in the characteristics through the user interface. The modified values are sent to the Homekit devices to apply them, and from the Homekit devices, respectively, the values of the characteristics are also sent with some changes from the device side.
Total, the device in HomeKit is an accessory with a set of services and features.
Yahka Dock concept
To work with Homekit, ioBroker uses the Yahka driver ( additional modules must be installed before installation ) - an add-on above the well-known libraryhttps://github.com/KhaosT/HAP-NodeJS , on which the popular HomeBridge project is also built. This library is designed to create a virtual gateway / bridge that provides a set of virtual devices in HomeKit. Configuring the virtual devices and services accordingly, setting the values of the characteristics - we will get the finished device in Homekit and the Home application, and we can also ask Siri to manage it.
The Yahka driver is exactly intended for setting up accessories, adding services to them and specifying the compliance of characteristics (HomeKit) and states (ioBroker).
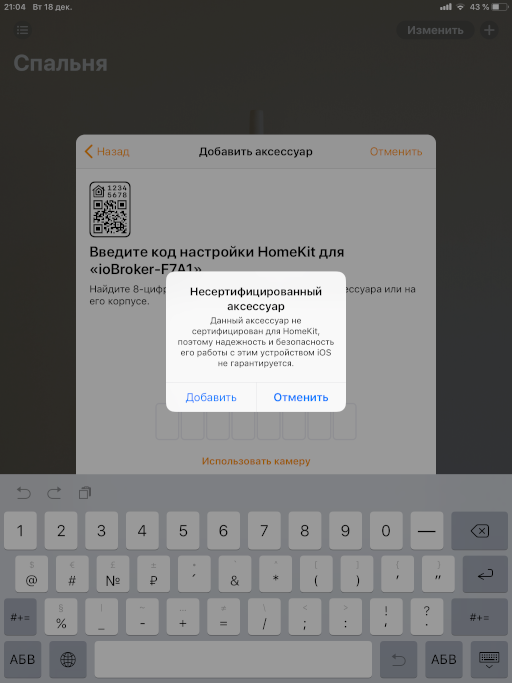
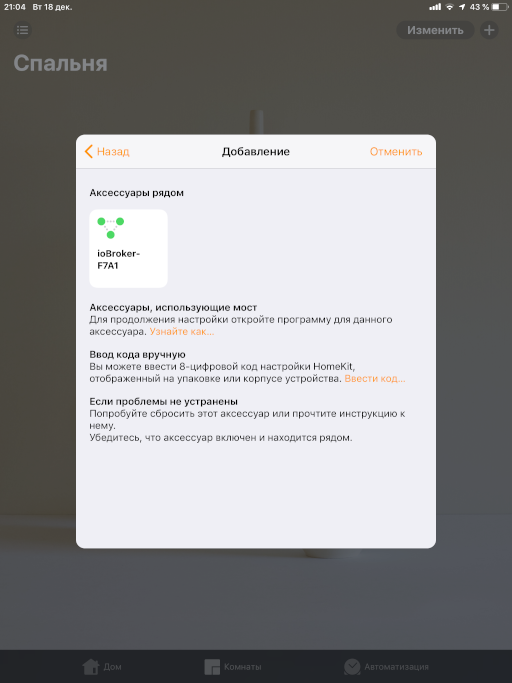
But first, after installation, you need to configure the gateway and bring it into the Home application. After setup, all devices added to the gateway will be automatically added to Home. To do this, you must specify the "Device Name" (it is desirable to specify only Latin letters) and remember the pin-code (or specify your own).

Now we will deal with devices. Everything would be fine if the state set for the device in ioBroker uniquely corresponded to the set of services and features in HomeKit. And it would be even better if the values in the states were suitable for the values of the characteristics. But often this is not the case, and you have to invent unusual ways of docking. I will tell about some of them below, and you will have to implement all other options yourself, “in the image and likeness”.
For convenience, I created a document with the translation of services and types, as well as possible values of characteristics. All types and services used correspond to the HAP-NodeJS library .
temperature sensor
This is the simplest example - you just have one state that contains a numerical value of temperature. It can be obtained from anywhere: from sensors or from Internet services (weather).
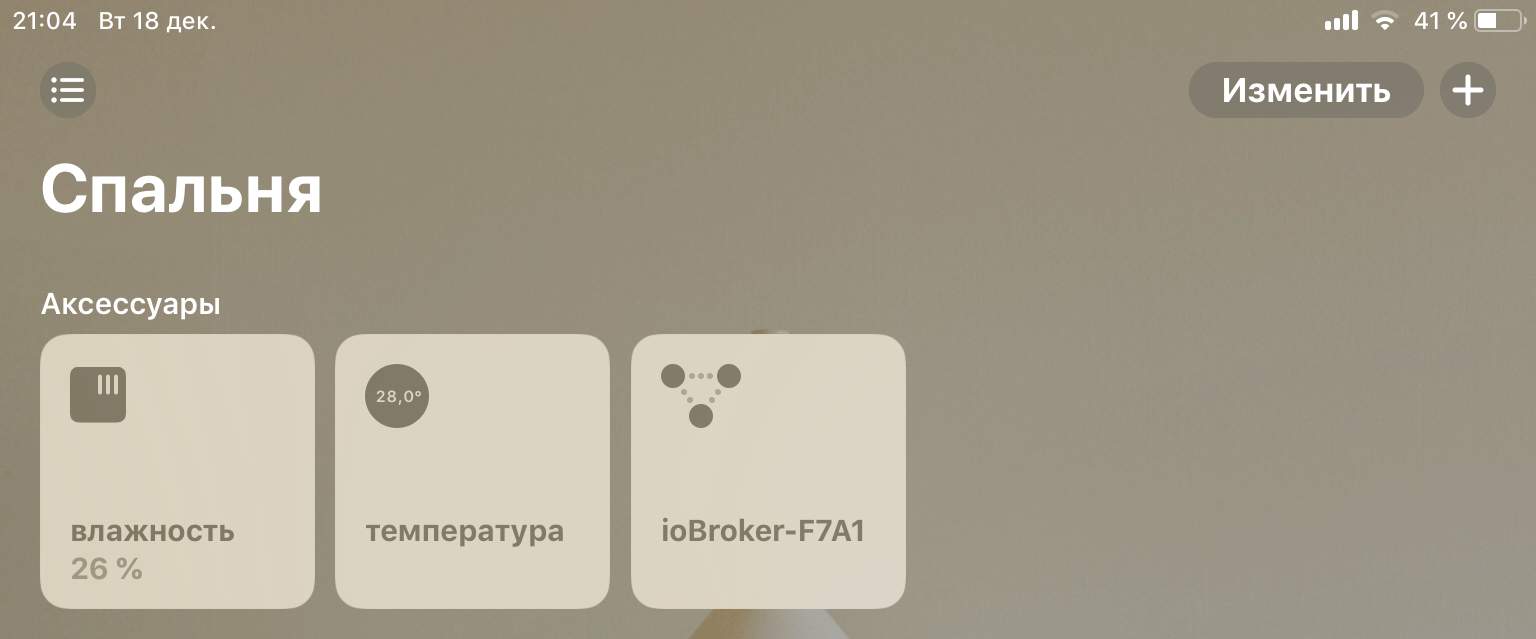
You need to add a device of the Sensor category, and add a TemperatureSensor service to the device, and give a name to this service. There are 5 characteristics in this service, the most important for us is CurrentTemperature (Current Temperature).


It is enough to indicate in the characteristic CurrentTemperature the name of the state corresponding to the temperature.
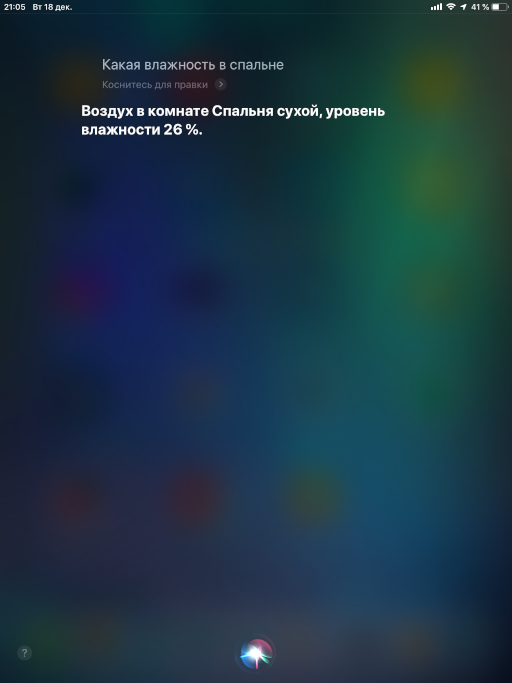
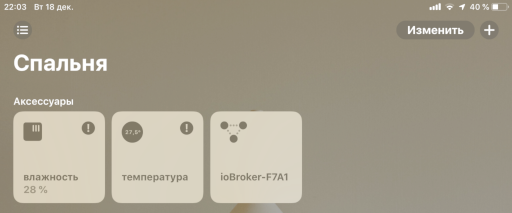
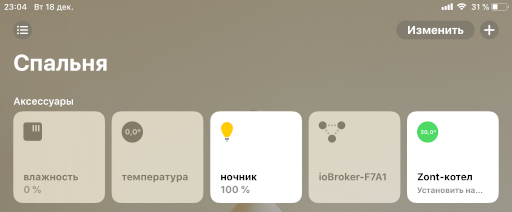
We’ll also add the Humidity Sensor humidity service here, and a separate accessory icon will be created in Homekit.

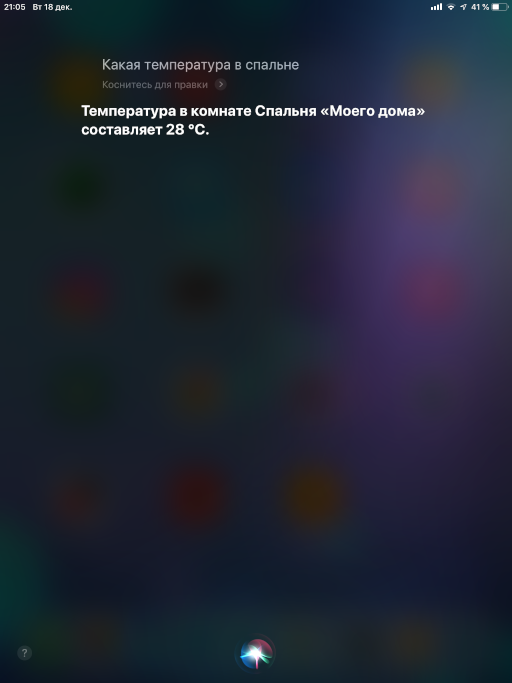
Save, and everything is ready. Now you can contact Siri and ask her about the temperature and humidity.
Battery
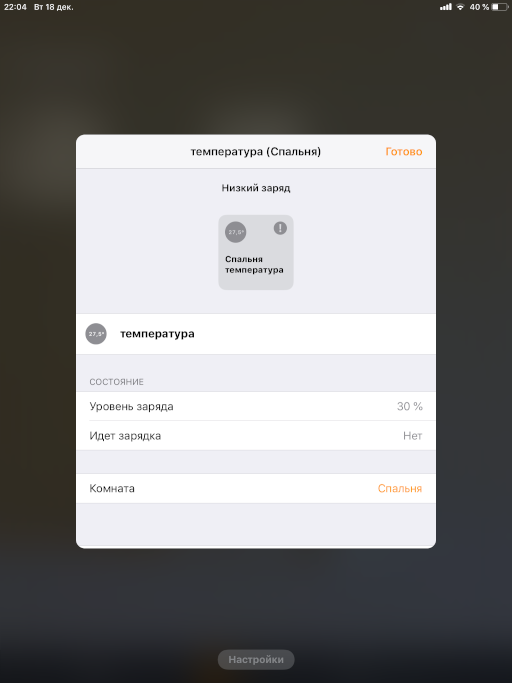
Another simple service. Its trick is that it can be added to almost any accessory. We add the BatteryService service and indicate in the BatteryLevel characteristic a state containing the percentage of battery charge. After that, the data on the charge will appear in the additional data about the device.

You can also set the "low charge" feature (the StatusLowBattery characteristic), if the value of the specified state is 1, then the corresponding icon will be displayed on the device image.
But what to do if you do not have such a state, and you want to see the low charge icon? You need to create this state manually or by a script, and indicate the created state in the characteristics.
Now it remains only to correctly set the true value in this state. For this we will use the script - it will set to true when the battery charge reaches 30 percent.
createState("сдохлаБатарейка");
on({id: "zigbee.0.00158d0001f41725.battery", change: "ne"}, function (obj) {
    var value = obj.state.val;
    setState("javascript.0.сдохлаБатарейка", (value <= 30));
});
After the first launch, the script will create a state, and it can be selected in the characteristics.
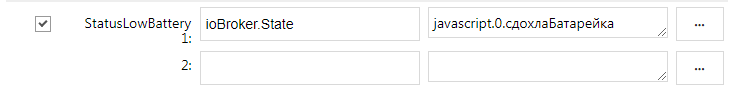
This sign will be displayed on the images of accessories.
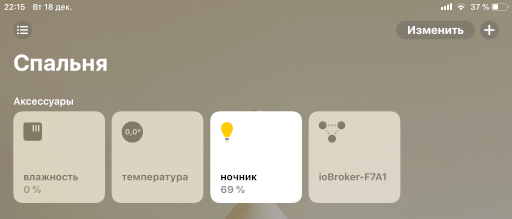
Lamps
Light bulbs are different - bright, warm, red. There are 4 cases:
- Simple - controlled by "on" and "off"
- Dimmable - also controlled by the brightness level
- With temperature - it is possible to control the temperature of the glow
- Colored - it is possible to control the color of the glow
For each of these cases, there is a corresponding characteristic in the Lightbulb service:
- On - on / off
- Brightness - brightness level
- Hue - shade
- Saturation - saturation
- ColorTemperature - color temperature
In the simple case, in the "On" characteristic, we indicate the state responsible for switching on and off.
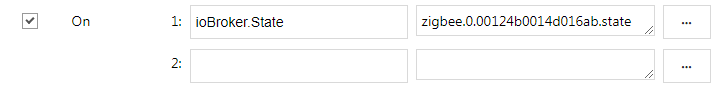
If the lamp is dimmable, then additionally indicate the state with the level of brightness.
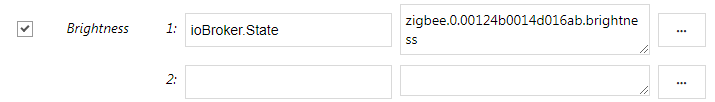
In addition to the assignment of correct states, it is important to observe the interval of acceptable values!
Example: in some cases, the state responsible for the brightness of the lamp can take values from 0 to 255, but in Homekit these values are limited to an interval from 0 to 100. For this case, you can use the conversion functions of the Yahka driver. The function "level255" just converts the interval of values 0..255 into the interval 0..100 (and vice versa).
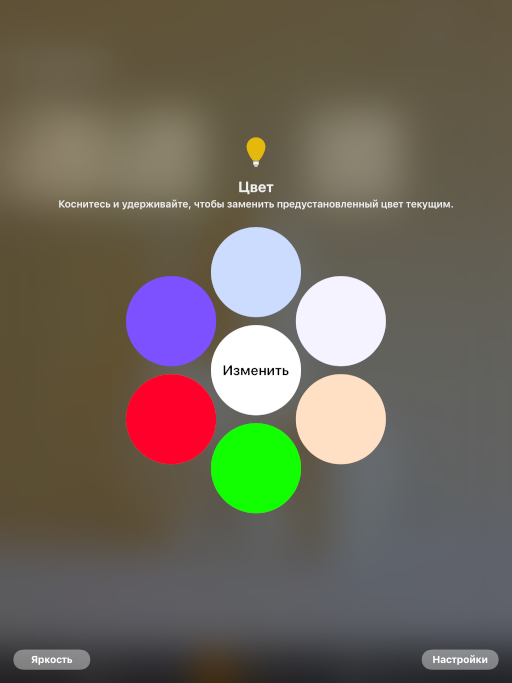
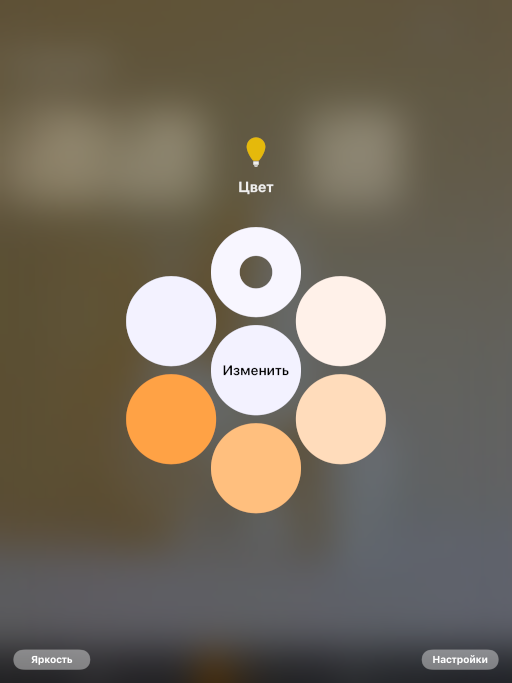
The following difficulties may arise if your lamp is colored, but the color is RGB. These can be either three different states or one number (or a string). In this case, you will need to convert from one RGB color space to another XYB space (this space is used by HomeKit), or to the XY plane.
To do this, you need to make 2 new states (Hue and Saturation), into which we will convert the values from the RGB state and back.
// создадим состояния для Оттенка и Насыщенности
createState("ночникHue");
createState("ночникSat");
// при изменении оттенка будем менять RGB-цвет
on({id: "ночникHue", ack: false, change: 'any'}, function (obj) {
   var hue = parseInt(obj.state.val);
   var sat = parseInt(getState('ночникSat').val);
   var res = hsvToRgb(hue, sat, 100);
   setRGB(parseInt(res[0]), parseInt(res[1]), parseInt(res[2]));
});
// заполним состояние с RGB-цветомfunctionsetRGB(r, g, b){
   var val = ('00'+r.toString(16)).slice(-2)+('00'+g.toString(16)).slice(-2)+('00'+b.toString(16)).slice(-2);
   // RGB-состояние светильника
   setState('zigbee.0.00124b0014d016ab.color', val, false);
}
// функция преобразования HSV цвета в RGBfunctionhsvToRgb(h, s, v) {
   var r, g, b;
   var i;
   var f, p, q, t;

   h = Math.max(0, Math.min(360, h));
   s = Math.max(0, Math.min(100, s));
   v = Math.max(0, Math.min(100, v));
   s /= 100;
   v /= 100;

   if(s == 0) {
       r = g = b = v;
       return [
           Math.round(r * 255),
           Math.round(g * 255),
           Math.round(b * 255)
       ];
   }

   h /= 60;
   i = Math.floor(h);
   f = h - i;
   p = v * (1 - s);
   q = v * (1 - s * f);
   t = v * (1 - s * (1 - f));

   switch(i) {
       case0:
           r = v;
           g = t;
           b = p;
           break;

       case1:
           r = q;
           g = v;
           b = p;
           break;

       case2:
           r = p;
           g = v;
           b = t;
           break;

       case3:
           r = p;
           g = q;
           b = v;
           break;

       case4:
           r = t;
           g = p;
           b = v;
           break;

       default: // case 5:
           r = v;
           g = p;
           b = q;
   }

   return [
       Math.round(r * 255),
       Math.round(g * 255),
       Math.round(b * 255)
   ];
}
You can do more easily with color temperature - if you know the range of available values for your lamp, then you can convert it to the range available for HomeKit (via the scaleInt function ).

Thermostat
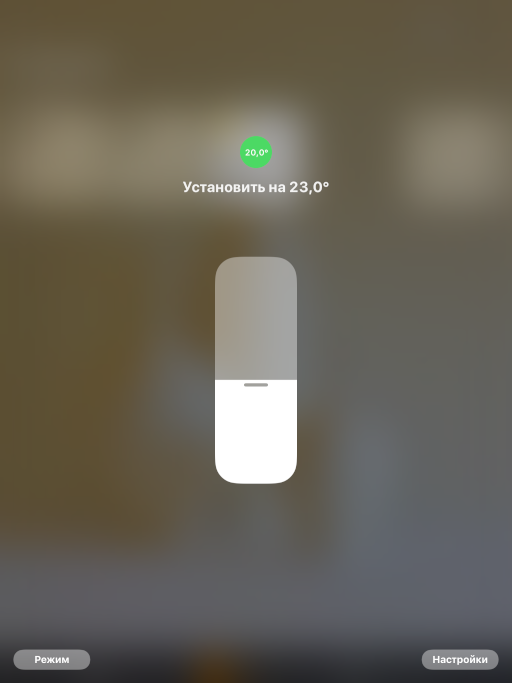
Thermostat - a device for maintaining the set temperature (service Thermostat). Accordingly, the main characteristic of the thermostat is the desired temperature (TargetTemperature). In addition to the set temperature, the current temperature (CurrentTemperature) can be indicated, which is informational (as the device only reads it from the sensors).
From the House application in the thermostat, the target temperature is set and the current temperature is monitored. In my thermostat (Zont) there were just these two states - they were accessible through the service cloud api.
For the beauty of the device display in HomeKit, we had to add a couple of constants: the current heating state is active (1), the target heating state is automatic (3).

Goal
With garage doors (GarageDoorOpener service) everything is trickier than with a thermostat.
Of the available characteristics, the gate has a target state (TargetDoorState), which indicates our desire for the gate to be “open” or “closed”. But you also need to correctly display the current state of the gate (CurrentDoorState): are they open or closed, or maybe they open or close?
In my case, the gate was opened through mqtt in ioBroker by several information states:
- sign of openness of the gate
- sign of the movement of the gate (DV)

Thanks to these states, you can calculate the current status of the gate:
- if there is no OB and there is no DV, then the gate is closed
- if there is no OB and there is DV, then the gate opens
- if there is an agent and there is no DV, then the gate is open
- if there is an agent and there is a Far East, then the gate is closed
To send a signal for opening and closing the gate, I have two separate states (I could manage with one state, but here I have two), which send an mqtt message to the gate control controller:
- opening signal
- close signal
To send a signal, you need to simulate the "pressing" of a button: set the value to true, and after a while reset it to false. In this regard, for integration with HomeKit, we had to create another state - the “target state of the gate”, which, if changed, would send the corresponding signal.
A sign of openness of the gate can be replaced by a target state (i.e., what the gate will strive for):
- if the CA is “closed” and there is no Far East, then the gate is closed
- if the CA is "closed" and is LW, then the gate opens
- if CA is “open” and there is no Far East, then the gate is open
- if the CA is "open" and is LW, then the gate is closed
We will also create a separate state “the current state of the gate”, and we will fill it in the script depending on the value of the signs and on the target state.
createState("gate_0.current"); // текущее состояние
createState("gate_0.target"); // целевое состояние// сбрасываем состояние в 0, по прошествии 300мс
on({id: "mqtt.0.gate.gpio.13", ack: false, val: 1}, function (obj) {
   setStateDelayed("mqtt.0.gate.gpio.13", 0,  300);
});
on({id: "mqtt.0.gate.gpio.12", ack: false, val: 1}, function (obj) {
   setStateDelayed("mqtt.0.gate.gpio.12", 0,  300);
});
// если изменилось состояние открытости
on({id: "mqtt.0.gate.is_open", ack: false, val: 1}, function (obj) {
   // "открылся"
   setState("javascript.0.gate_0.current", 0, true);
});
on({id: "mqtt.0.gate.is_open", ack: false, val: 0}, function (obj) {
   // "закрылся"
   setState("javascript.0.gate_0.current", 1, true);
});
// если установили цель - открыть, значит посылаем сигнал на открытие
on({id: "javascript.0.gate_0.target", ack: false, val: 0}, function (obj) {
   setState("mqtt.0.gate.gpio.12", 1);
});
// если установили цель - закрыть, значит посылаем сигнал на закрытие
on({id: "javascript.0.gate_0.target", ack: false, val: 1}, function (obj) {
   setState("mqtt.0.gate.gpio.13", 1);
});
on({id: "mqtt.0.gate.in_progress", ack: true, change: 'any'}, function (obj) {
   // если выставился режим "в процессе", то значит процесс пошел
   if (obj.state.val === 1) {
       // если целевой режим "открытие", то выставим состояние
       const target = getState("javascript.0.gate_0.target");
       if (target.val === 0) {
           // "открывается"
           setState("javascript.0.gate_0.current", 2, true);
       } else {
           // "закрывается"
           setState("javascript.0.gate_0.current", 3, true);
       }
   }
   // если сбросился режим "в процессе", то значит процесс закончен
   if (obj.state.val === 0) {
       // если целевой режим "открытие", то выставим состояние
       const target = getState("javascript.0.gate_0.target");
       if (target.val === 0) {
           // "открылся"
           setState("javascript.0.gate_0.current", 0, true);
       } else {
           // "закрылся"
           setState("javascript.0.gate_0.current", 1, true);
       }
   }
});
After running the script, you can configure the characteristics of the service of garage doors:

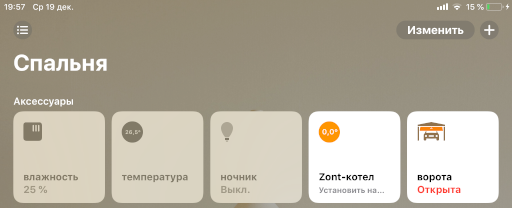
Camera
To add a camera to HomeKit, the "classic" method will be used. An image broadcast from the camera is organized via the ffmpeg module. Through it, the input stream will be encoded, encrypted and sent to Homekit.
First you need to install ffmpeg on the server where ioBroker is located.
For each platform, it is installed differently, you can build it from source, or you can search for a ready-made assembly, for example, here: https://www.johnvansickle.com/ffmpeg/ A libx264 encoder is required. You can check for the presence of an encoder after installing ffmpeg with the command:
ffmpeg -codecs | grep 264The results should contain a string like:
DEV.LS h264 H.264 / AVC / MPEG-4 AVC / MPEG-4 part 10 (decoders: h264 h264_v4l2m2m h264_vdpau ) (encoders: libx264 libx264rgb h264_v4l2m2m )For Raspberry Pi 3, you can use a ready-made assembly , in which there is a codec with support for hardware coding of the GPU (h264_omx, consumes less resources). Put so:
wget https://github.com/legotheboss/YouTube-files/raw/master/ffmpeg_3.1.4-1_armhf.deb
sudo dpkg -i ffmpeg_3.1.4-1_armhf.deb
Both codecs are present in this build: libx264 and h264_omx
Next, you need to get the address of the camera stream, which must be translated (this step is beyond the scope of this article). For example, you can take a ready-made public stream .
Now we add the camera to Yahka, specify the stream address, and if necessary, change the codec parameters, image size, frame rate.
Important: Parameter combinations are very important for correct display of the camera in Homekit and depend on the camera and the stream. It also affects system performance, because running ffmpeg process takes a lot of resources.


Bonus
As a bonus, I will tell about the unusual use of camera broadcast.
Using the same ffmpeg, instead of the camera, you can try to broadcast an image, any picture. These pictures can also be merged with the video stream. The image can display text, graphics and other information.

As a result, you can get an interesting dashboard. And if you update the picture periodically, you get dynamic data.
As an example, I derived a graph of changes in some indicators in the form of a picture (file on disk). This schedule is updated once per minute and overwrites the image in the file.
Расскажу, как можно получить график в виде картинки.
В ioBroker есть стандартный способ построения графиков — Flot-драйвер. Этот драйвер работает в паре с Web-драйвером и отображает результат в браузере. Но для того чтобы получить созданный график на сервере (в скрипте) в виде картинки нужен дополнительный драйвер PhantomJS, который делает “скриншот” страницы (на которой у нас нарисуется Flot-график).
Но я расскажу об альтернативном способе построения графиков на сервере в скрипте.
Есть такая библиотека Chart.js http://www.chartjs.org/ которая позволяет рисовать приятные на вид графики в браузере (примеры http://www.chartjs.org/samples/latest/).
Для рисования она использует “холст” (канва, canvas) браузера. Поэтому, чтобы рисовать с помощью этой библиотеки на сервере, нужно использовать “серверный” вариант “холста” и DOM-объекты. Это и делает пакет chartjs-node (https://github.com/vmpowerio/chartjs-node).
Основной зависимостью для этого пакета является пакет canvas (https://github.com/Automattic/node-canvas), который следует установить глобально (или в папку iobroker). Важно установить все зависимости для той платформы, куда вы ставите https://github.com/Automattic/node-canvas#compiling .
После этого можно в настройках драйвера javascript добавить модули chart.js, chartjs-node. Они должны установиться корректно, без ошибок. Иначе — разбираться с ошибками и решать их.
А дальше, можно написать скрипт.
Ниже приведен скрипт для примера, т.к. в нем включено использование драйвера History и используются конкретные имена состояний.
Внимание! В скрипте есть сложные для новичков конструкции — Promise. Это удобные способ не писать функции с callback, а делать цепочки шагов. Так, например, это удобно делать для получения данных из истории состояний.
'use strict';
const ChartjsNode = require('chartjs-node');
/**
* функция sendTo как Promise, чтобы удобно было строить цепочки
*/functionsendToPromise(adapter, cmd, params) {
returnnewPromise((resolve, reject) => {
sendTo(adapter, cmd, params, (result) => {
resolve(result);
});
});
}
// константы для цветовconst chartColors = {
black: 'rgb(0, 0, 0)',
red: 'rgb(255, 99, 132)',
orange: 'rgb(255, 159, 64)',
yellow: 'rgb(255, 205, 86)',
green: 'rgb(75, 192, 192)',
blue: 'rgb(54, 162, 235)',
purple: 'rgb(153, 102, 255)',
grey: 'rgb(201, 203, 207)'
};
/**
* функция рисования и сохранения картинки в файл
* параметры:
* @param config - конфигурация графика для рисования
* @param filename - имя файла для сохранения
* результат:
* @param Promise - успешное сохранение файла
*/functiondoDraw(config, filename) {
// создадим полотно с размером 640x480 пикселейvar chartNode = new ChartjsNode(640, 480);
return chartNode.drawChart(config)
.then(() => {
// запишем результат в файлreturn chartNode.writeImageToFile('image/png', filename);
});
}
/**
* функция подготовки параметров для ChartJS.
* результат:
* @param Promise - успешная подготовка параметров
*/functionprepareDraw0(){
// переменная, куда сохраним данныеvar пример;
// создадим Promise сборки данных и конфигурацииreturnnewPromise((resolve, reject)=>{resolve()})
// здесь могут быть много шагов сбора данных, прежде чем перейти к графику
.then(()=>{
// произвольные данные, похожие на те, что хранятся в истории
пример = [
{"val":3,"ack":1,"ts":1539063874301},
{"val":5,"ack":1,"ts":1539063884299},
{"val":5.3,"ack":1,"ts":1539063894299},
{"val":3.39,"ack":1,"ts":1539063904301},
{"val":5.6,"ack":1,"ts":1539063914300},
{"val":-1.3,"ack":1,"ts":1539063924300},
{"val":-6.3,"ack":1,"ts":1539063934302},
{"val":1.23,"ack":1,"ts":1539063944301},
];
})
// финальный шаг - создаем конфигурацию графиков
.then(()=>{
const chartJsOptions = {
// тип графика - линейный
type: 'line',
data: {
// список наборов данных
datasets: [
{
// заголовок ряда
label: 'тест',
// цвет
backgroundColor: chartColors.black,
borderColor: chartColors.black,
// размер точек
pointRadius: 3,
// ширина линии графика
borderWidth: 3,
// достанем данные из переменной 'пример' и оставим только значение и время изменения
data: пример.map((item) => {
return {y: item.val, t: newDate(item.ts)}
}),
// заливка графика - нет
fill: false,
}
]
},
options: {
// настройка легенды
legend: {
labels: {
// размер шрифта
fontSize: 20,
},
},
// оси координат
scales: {
// оси X
xAxes: [{
// тип - временная ось
type: 'time',
display: true,
// метка оси
scaleLabel: {
display: true,
labelString: 'Время'
},
}],
// оси Y
yAxes: [{
// тип - линейная
type: 'linear',
display: true,
// метка оси
scaleLabel: {
display: true,
labelString: 'Температура'
},
}]
}
}
};
return chartJsOptions;
});
}
/**
* функция подготовки параметров для ChartJS.
* собирает данные из истории и складывает их в переменные,
* чтобы потом включить в ряды.
*
* параметры:
* @param hours - количество часов, за которые получить данные
* результат:
* @param Promise - успешная подготовка параметров
*/functionprepareDraw1(hours){
// вычислим интервал времени, за который надо получить данныеconst end = newDate().getTime(),
start = end - 3600000*(hours || 1); // 1 = час назад// зададим переменные, в которые будем складывать результаты запроса// исторических данныхvar улица, куры2, куры1, куры2свет, куры2вент;
// создадим Promise сборки данных и конфигурацииreturnnewPromise((resolve, reject)=>{resolve()})
// на этом шаге собираем историю по 'mqtt.0.ESP_Easy.Улица.Temperature'
.then(() => {
return sendToPromise('history.0', 'getHistory', {
id: 'mqtt.0.ESP_Easy.Улица.Temperature',
options: {
start: start,
end: end,
aggregate: 'onchange'
}
}
).then((result) => {
// записываем результат в переменную 'улица'
улица = result.result;
});
})
// на этом шаге собираем историю по 'sonoff.0.chicken2.DS18B20_Temperature'
.then(() => {
return sendToPromise('history.0', 'getHistory', {
id: 'sonoff.0.chicken2.DS18B20_Temperature',
options: {
start: start,
end: end,
aggregate: 'onchange'
}
}).then((result)=>{
// записываем результат в переменную 'куры2'
куры2 = result.result;
});
})
.then(() => {
return sendToPromise('history.0', 'getHistory', {
id: 'sonoff.0.sonoff_chicken_vent.DS18B20_Temperature',
options: {
start: start,
end: end,
aggregate: 'onchange'
}
}).then((result)=>{
куры1 = result.result;
});
})
.then(() => {
return sendToPromise('history.0', 'getHistory', {
id: 'sonoff.0.chicken2.POWER1',
options: {
start: start,
end: end,
aggregate: 'onchange'
}
}).then((result)=>{
куры2свет = result.result;
});
})
.then(() => {
return sendToPromise('history.0', 'getHistory', {
id: 'sonoff.0.chicken2.POWER2',
options: {
start: start,
end: end,
aggregate: 'onchange'
}
}).then((result)=>{
куры2вент = result.result;
});
})
// финальный шаг - создаем конфигурацию графиков
.then(()=>{
const chartJsOptions = {
// тип графика - линейный
type: 'line',
data: {
// список наборов данных
datasets: [
{
// заголовок ряда с указанием последнего значения из ряда в скобках
label: 'Улица ('+улица[улица.length - 1].val+')',
// цвет
backgroundColor: chartColors.blue,
borderColor: chartColors.blue,
// размер точек. 0 - нет точки
pointRadius: 0,
// ширина линии графика
borderWidth: 3,
// достанем данные из переменной 'улица' и оставим только значение и время изменения
data: улица.map((item) => {
return {y: item.val, t: newDate(item.ts)}
}),
// заливка графика - нет
fill: false,
// идентификатор оси Y
yAxisID: 'y-axis-1',
},{
label: 'Куры 1 ('+куры1[куры1.length - 1].val+')',
backgroundColor: chartColors.green,
borderColor: chartColors.green,
pointRadius: 0,
borderWidth: 3,
data: куры1.map((item) => {
return {y: item.val, t: newDate(item.ts)}
}),
fill: false,
yAxisID: 'y-axis-1',
},{
label: 'Куры 2 ('+куры2[куры2.length - 1].val+')',
backgroundColor: chartColors.red,
borderColor: chartColors.red,
pointRadius: 0,
borderWidth: 3,
data: куры2.map((item) => {
return {y: item.val, t: newDate(item.ts)}
}),
fill: false,
yAxisID: 'y-axis-1',
},{
label: 'Куры 2 свет ('+куры2свет[куры2свет.length - 1].val+')',
backgroundColor: chartColors.yellow,
borderColor: chartColors.yellow,
pointRadius: 0,
borderWidth: 1,
data: куры2свет.map((item) => {
return {y: (item.val) ? 1 : 0, t: newDate(item.ts)}
}),
fill: true,
lineTension: 0,
steppedLine: true,
yAxisID: 'y-axis-2',
},{
label: 'Куры 2 вент ('+куры2вент[куры2вент.length - 1].val+')',
backgroundColor: chartColors.grey,
borderColor: chartColors.grey,
pointRadius: 0,
borderWidth: 1,
data: куры2вент.map((item) => {
return {y: (item.val) ? -1 : 0, t: newDate(item.ts)}
}),
fill: true,
lineTension: 0,
steppedLine: true,
yAxisID: 'y-axis-2',
}
]
},
options: {
// настройка легенды
legend: {
labels: {
// размер шрифта
fontSize: 20,
},
},
// оси координат
scales: {
// оси X
xAxes: [{
// тип - временная ось
type: 'time',
display: true,
// метка оси
scaleLabel: {
display: true,
labelString: 'Время'
},
// настройка формата оси (времени)
time: {
unit: 'minute',
displayFormats: {
minute: 'HH:mm'
}
},
}],
// оси Y
yAxes: [{
// тип - линейная
type: 'linear',
display: true,
// метка оси
scaleLabel: {
display: true,
labelString: 'Температура'
},
// расположение линейки - слева
position: 'left',
// идентификатор оси
id: 'y-axis-1',
},{
type: 'linear',
display: true,
scaleLabel: {
display: true,
labelString: 'Свет и вентиляция'
},
ticks: {
min: -4,
max: 2
},
// расположение линейки - справа
position: 'right',
id: 'y-axis-2',
}]
}
}
};
return chartJsOptions;
});
}
functioncreateImage(filename, callback){
// filename - имя файла, в который положим картинку с графиком// выполним подготовку данных
prepareDraw1(2)
// на след шаге нарисуем
.then((result) => {
// рисуем картинку по полученным данным и конфигурацииreturn doDraw(result, filename);
})
.then(()=>{
if (callback) callback();
})
.catch((err)=>{
console.error(err);
});
}
The thumbnail image is updated about once per minute, so let's set the update to be done once every 10 seconds:
var fs = require('fs');
// каждую 10ю секунду обновляем картинку
schedule("*/10 * * * * *", () => {
   createImage1('/tmp/1_new.jpg', ()=> {
       fs.renameSync('/tmp/1_new.jpg', '/tmp/1.jpg');
   });
   createImage2('/tmp/2_new.jpg', ()=> {
       fs.renameSync('/tmp/2_new.jpg', '/tmp/2.jpg');
   });
});
The peculiarity is that in the process of broadcasting the image, it is necessary to replace the image quickly enough so that ffmpeg does not collapse :) Therefore, the image is first formed into one file, and then the file is renamed to the one used for translation.
Now in the camera settings, we specify the name of the file being formed instead of the stream address, and add the settings that the image is "updated" (the "-loop 1" parameter). This is configured in the advanced properties of the camera. These properties are nothing more than command line options for running ffmpeg. Therefore, combinations of parameters should be sought in the ffmpeg documentation and examples.
Properties are divided into 2 types: for getting a "preview" (small camera image) and for broadcasting. Therefore, you can specify different image source files, for example, with different details.


Conclusion
The topic of integrating devices and third-party services into the ioBroker system is very deep and not simple. Although plugin authors try to simplify the integration process, in some cases you have to write additional logic. But, thanks to this flexibility, integration is possible with almost any device and service.
It is hoped that the developers of the Yahka driver will make an effort and add automatic detection of devices, as is done in the Material driver. In this case, you will need to specify the role and function of the states, and the driver should offer to add the appropriate device to the gateway configuration for HomeKit.
In addition to the Yahka driver mentioned in this article, there is another way to integrate with HomeKit — the Ham driver, which allows you to start the HomeBridge service with devices connected to it and interact with them. But this is a topic for a separate article.