How do you choose groceries in the store?

The most important formula for success is knowing how to deal with people. Theodore Roosevelt
In the last article I tried to talk about the fundamentals of pricing analytics. Now let's talk about more interesting things.
Have you ever thought about why you buy certain products in stores, how do you choose among a multitude of analogues? Most likely, a clear answer for all possible trips to the store will not work, many of them are spontaneous. But the general idea is obvious - when you go to the store you are trying to close the existing need (for food, gadgets, entertainment, blackjack). In this article, using the example of grocery retailers, I’ll tell you about the experience that has been found, using some basic logical assumptions and community analysis in graphs, to determine exactly how customers choose a product.
Introduction
In the classic stories about retail immediately recall stories of recommender systems, which have long been used to analyze customer check data. For example the famous stories about Target and about beer with diapers .

These cases are based on a narrowly known approach called Market Basket Analysis (MBA) or analysis of association rules. The main idea of the approach is to build a set of rules of the form “when they buy X, usually they buy Y” and use them in further processes (personal recommendations, display, etc.). The rules allow you to define products complements that complement each other. This approach is quite popular due to the ease of implementation and good interpretability of the results. The main problems lie in the fact that it is not always clear how to apply the rules obtained and how, in addition to complements, to determine the goods substitutes- substitutes. Let's try to improve this approach a little: to group the goods depending on the needs of customers and understand how the customer makes a purchasing decision.
Complicate the MBA, looking for products substitutes
Let's complicate the MBA approach a bit and consider further information on loyalty cards that many Russian retailers have (you can use a client ID for online). We will conduct MBA not at the level of check data, but at the level of cards (i.e., instead of the check ID, we will use the client ID / client ID). As a result, we get pairs of products that are related to each other at the client level, i.e. if the customer has bought item X, then he also buys item Y and the key here is that item Y can be bought during another shopping trip.
Let's think about how you can determine the goods substitutes. Let's make a logical assumption that a person does not often buy substitutes in one check (you rarely buy 3 and 5 kg of laundry detergent at the same time). This is the most important assumption in the entire analysis, which works well for grocery retail / household goods and with minor adjustments for other types of retailers. From this assumption, we can conclude that if a pair of goods is often bought by customers, but it is rarely found in the same check, then we can say with great certainty that these are substitutes. The statement is quite strong and requires a prior qualitative analysis of the links - it is necessary to remove statistically insignificant links, remove “ bananas ”, etc. For the remaining links, you can enter the W metricwhich reflects how often the goods are bought in one loyalty card than in one check.
As a result, we have formed a pair of the type of goods "goods X and Y are rarely taken in a single check, but often take the same people" with some measure due the W . The more this measure of communication is, the more goods can be considered substitutes.
There was an MBA, became SNA
The next logical step is to look not at individual pairs of goods, but at all the existing pairs in the aggregate. Those. each pair of goods can be represented as a graph edge with a weight W. If you graph the resulting relationships graphically, you get something like this:
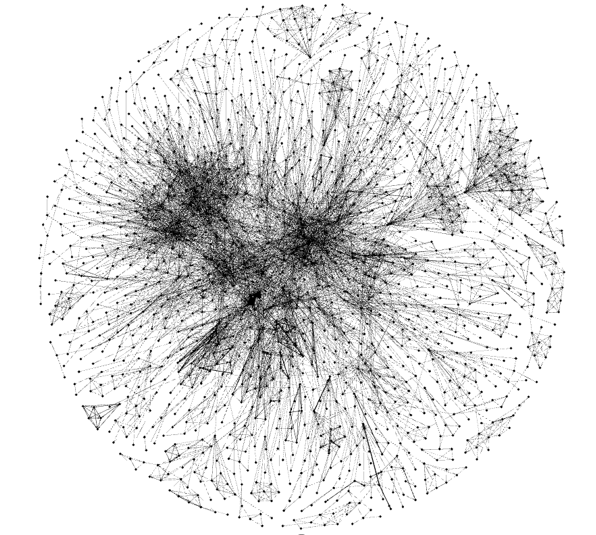
From the graph are clearly visible "community" of goods, strongly associated with each other. Let's apply the community search algorithms in graphs ( social network analysis, SNA ) and look at the result. For example, the Louvain algorithm is used . As a result, you should get a group of substitutes. Let's look at an example of the result:
- DANONE ACTIVIA cherry 2.9% 150g
- DANONE ACTIVIA strawberry 2.4% 150g
- DANONE ACTIVIA blueberries 2.9% 150g
- DANONE ACTIVIA muesli 2.4% 150g
- DANONE ACTIVIA bran and cereals 2.9% 150g
The result looks positive, these products really look like substitutes and close the need for yogurt from DANONE. All received groups of goods are in good agreement with the intuitive understanding of substitute products. There are, of course, less obvious examples that the retailer attributed to different groups, in particular because of the brand, but from the point of view of the buyer, they still close one need:
- Cream Luxe for dry skin
- Cream Amber for the face to dry and normal skin
- Neva cosmetics carrot face cream for dry and sensitive skin
- Neva cosmetics cucumber face cream for oily and combination skin
- Neva cosmetics face cream olive for dry and normal skin
- Neva cosmetics ginseng face cream around the eyes
And now the hierarchy
The Louvain algorithm allows building community hierarchies. In a simplified form - let's build communities of different sizes, turn them into a tree ( customer decision tree, customer decision tree ) and look at an example of the result:
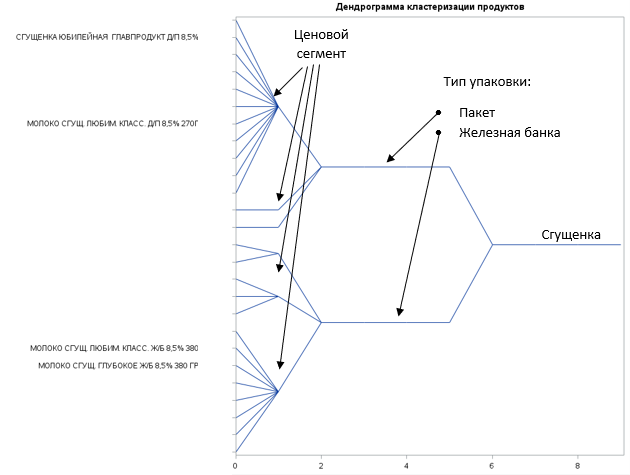
Hooray! The resulting tree is perfectly treated in terms of business logic and intuition - the person decided that he wanted condensed milk, then he chose between a can and a package, then chose the price at which he was ready to buy the product. Now we understand by what characteristics a person closes the need for condensed milk - the type of packaging and price segment. In this particular example, there is no attachment to the brand and other things that they often like to attribute to the product.
The tree is beautiful, and what's next
The resulting tree allows you to determine the needs of customers (lower levels of the tree) and the characteristics of the goods that affect the choice (according to the tree hierarchy). You can apply the result in various retail areas:
- Ideally, it is necessary that every need closes at least one product. Those. in every store of the network must be present products that cover the needs of customers. Those. instead of 20 iron cans of condensed milk it is better to have 10 iron cans and 10 bags.
- within the framework of one need, goods cannibalize each other most strongly. Those. Now we are limited to a set of products in which you can calculate cross-effects for pricing and forecasting demand.
- This tree helps in laying out the goods on the shelf (or the order of the goods on the site)
- in personal recommendations complements the classic MBA for the formation of cross-sale offers
As a result, we have complicated the classical MBA analysis a little, obtained results that can be immediately used in various processes of the retailer. The task is interesting, it is necessary to think logically, and analyze the data, and cluster the graphs.
I hope it was interesting! Optimize processes, cluster graphs, optimize data storage (after all, Garbage In - Garbage Out) and get great results.