Display of parameters of IOT & GPS objects on graphs
The article describes the new features of the VIALATM service for displaying the parameters of IOT & GPS objects on graphs. The most important of the new features is the display of a common parameter for several objects on the same chart.
Requests for this kind of functionality came from 3 users, and all of them use the service to work with IOT objects (on this basis I make the assumption that this feature is most important for the IOT sphere).
The menu call for specifying the graph display parameters has moved from the main menu “Reports” to the left column of icon buttons.

When selecting multiple objects, in the list of options menu you can select one parameter (example on the left). If one object is selected, then you can select several parameters that are defined for this object. When several objects are selected, the control is considered the first in the list. A list of parameters appears in the menu, which is defined specifically for this object. As a rule, objects with a similar composition of parameters are selected for comparison. But a situation may arise when the objects following the first have no selected parameter. In this case, the name of the object will be present in the heading of the graph, but the graph itself will not exist. The same situation occurs when for any of the selected objects for a given parameter there is no data for the selected interval. The selected objects and parameters are saved between sessions with the service.
The date interval for selecting a schedule is set directly in the date fields (beginning and end of the interval) and using the buttons next to them.

Also, you can quickly set the interval using the interval selection button. At the same time, a window appears with predefined intervals: today, yesterday, the day before yesterday, the current week, the previous week and the current month.
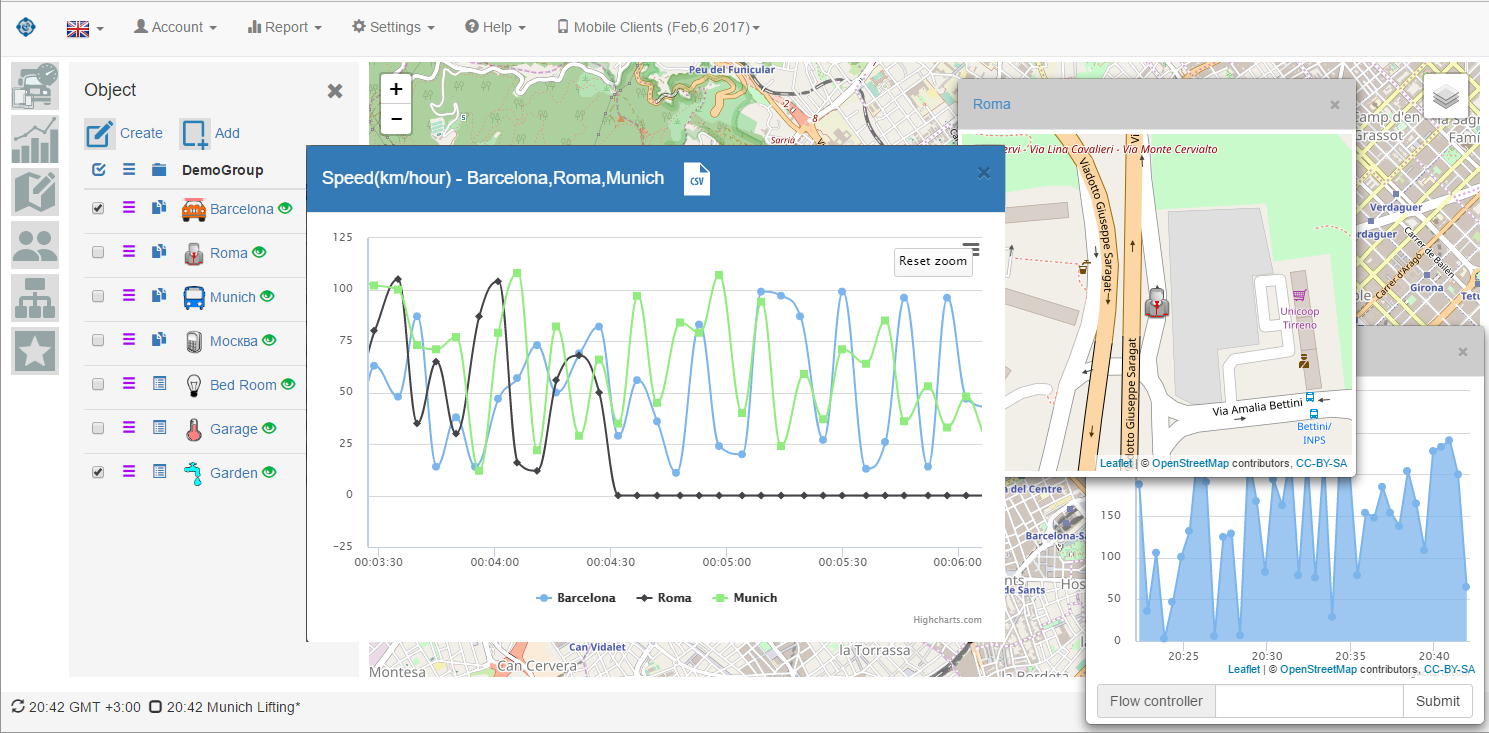
You can set the type of chart rendering. This is set by the button at the bottom of the chart setup panel. At the same time, in the dialog box that appears, the desired type of chart is selected. The selected type is saved between sessions. Examples of various renderings are shown in the image below. Using the “CSV” icon (in the panel header), you can load the chart data imported in CSV format. Comments are included in the data file (lines starting with the # character), which explain for which object and for which parameter the subsequent data set is generated.
