Internet Intelligence in Action: who is Mr./Ms. Habraman?
In a previous article on Internet intelligence , we briefly reviewed the process of collecting and analyzing data for a specific person. Since the topic aroused great interest, we continue our work and in this article we will consider how to collect information about a whole group of users.
Consider the following situation: a new Habr user, having received a “minus in karma” even before his first post / comment on the resource, decides to find out who is hiding behind the sophisticatedly invented nicknames of the Habr users and asks the question: who is Mr./Ms. Habraman?
We will follow the reconnaissance cycle:
Step 1. Statement of the problem
The problem can be formulated as follows: you need to make a portrait of the average Habr user.
Step 2. Planning
2.1 Hypotheses
To effectively collect information, we need working hypotheses, based on which we will understand what data we need and where to look for it. To formulate hypotheses, some preliminary knowledge of the subject is often necessary.
For preliminary information about Habr users, our inexperienced user accesses the Lurkmore website, which, as you know, is distinguished by its many-sided coverage of any phenomenon in the modern world. Perplexed by the negative mood of the author of the article, our Internet scout formulates the following hypotheses regarding who the average Habr user is all the same:
Please note that when formulating hypotheses, we try to comply with the MECE rule (mutually exclusive and collectively exhaustive, which can be translated as a “mutually exclusive and jointly exhaustive list”).
2.2 Data and their sources
Based on a set of formulated hypotheses, we can now determine what data we need so that we can verify it.
Accordingly, we are interested in the following data:
A good source of such information, as we know, is social networks, in particular the Russian VKontakte network, in which our hero finds a Habrhabr group with almost 670 thousand subscribers and with the motto indirectly confirming one of the hypotheses formulated: “UFO with you!” .
Step 3. Data collection
3.1 Tools
To access the data of subscribers of the group on the VKontakte network, we need:
3.2 Access to data.
To upload data from users of the VKontakte social network, you must use the VK API. Thanks to Dmitry Sorokin , who created the vkR library, working with the VK API from the R environment is now available to any confident (and insecure) user.
In order to be able to access the VK API, it is necessary to generate a so-called access token.
3.3 Data collection process
Since in the comments on the previous article, dear readers showed great interest in the practical component of the data collection process, we will give an example of R code, on the basis of which, if desired, the steps described below can be fully reproduced.
To work with the data of users of the Hubhabr group on the VKontakte network, you will need its unique identifier, which is easy to determine by moving the mouse cursor over, for example, the "Write message" button and, when you see a link like " vk.com/im?sel=- 20629724 ". The numbers are 20629724 and are the desired ID.
3.4 Sample
Internet intelligence should be effective and efficient, so "shoveling" all 670 thousand users is not a good idea. We need a fairly large sample, randomly generated. Our hero likes the figure 3000 and he stops at it. Given the recommendations of sociologists , this amount will be enough even if not all profiles are completely filled.
Step 4. Data processing
Thanks to R, data processing turned out to be quite simple. The only problem our scout encountered was an encoding problem: after uploading data from the VKontakte network, the text in the RStudio console did not display correctly, but the problem was solved as follows:
Surely, there is a more optimal solution to this problem, who knows - share information in the comments to the article.
Step 5. Analysis of the information
Let's proceed to the analysis of the received data.
5.1 Guys, girls and aliens
If you look at the distribution by gender, you can see the following picture:

We see that about 2/3 were guys, 1/3 were girls, but aliens who could not determine their membership in any particular sex, in our sample there were only two. Hypothesis 2 can be safely discarded.
5.2 Cities and countries
Testing the first hypothesis, which includes the assumption that among the users of Habré, mainly residents of our two capitals, we look at the distribution by city.
Only 2092 users from our selection indicated this field in their profile. The list of the top 15 cities was as follows:
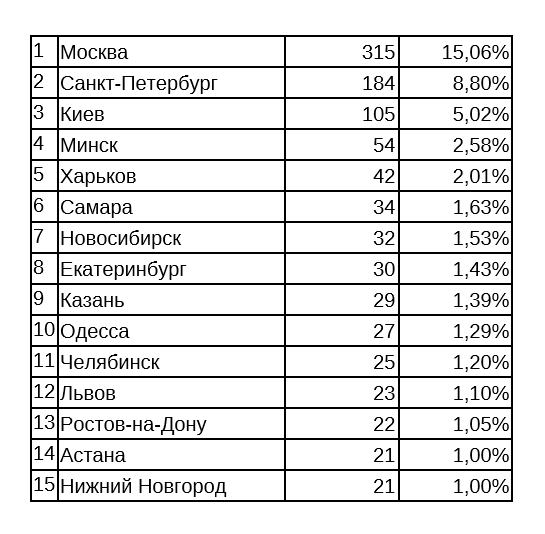
Two capitals occupy the first positions, but the total number of users who indicated Moscow and St. Petersburg is less than a quarter of 2092. Accordingly, it is difficult to call Habr purely metropolitan.
As for the countries in which our users live, it is clear that we are mainly talking about Russia, Ukraine, Kazakhstan and Belarus.

5.3 Audience age
It is interesting to look at the distribution by year of birth of Habr users from the sample and see that the age of the majority of users is in the range of 20-30 years.
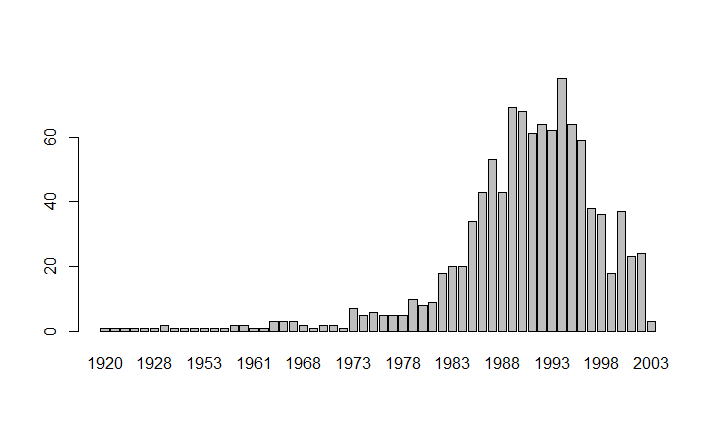
The assumption of age from the first hypothesis can be safely excluded, but the corresponding assumption from the third hypothesis is confirmed.
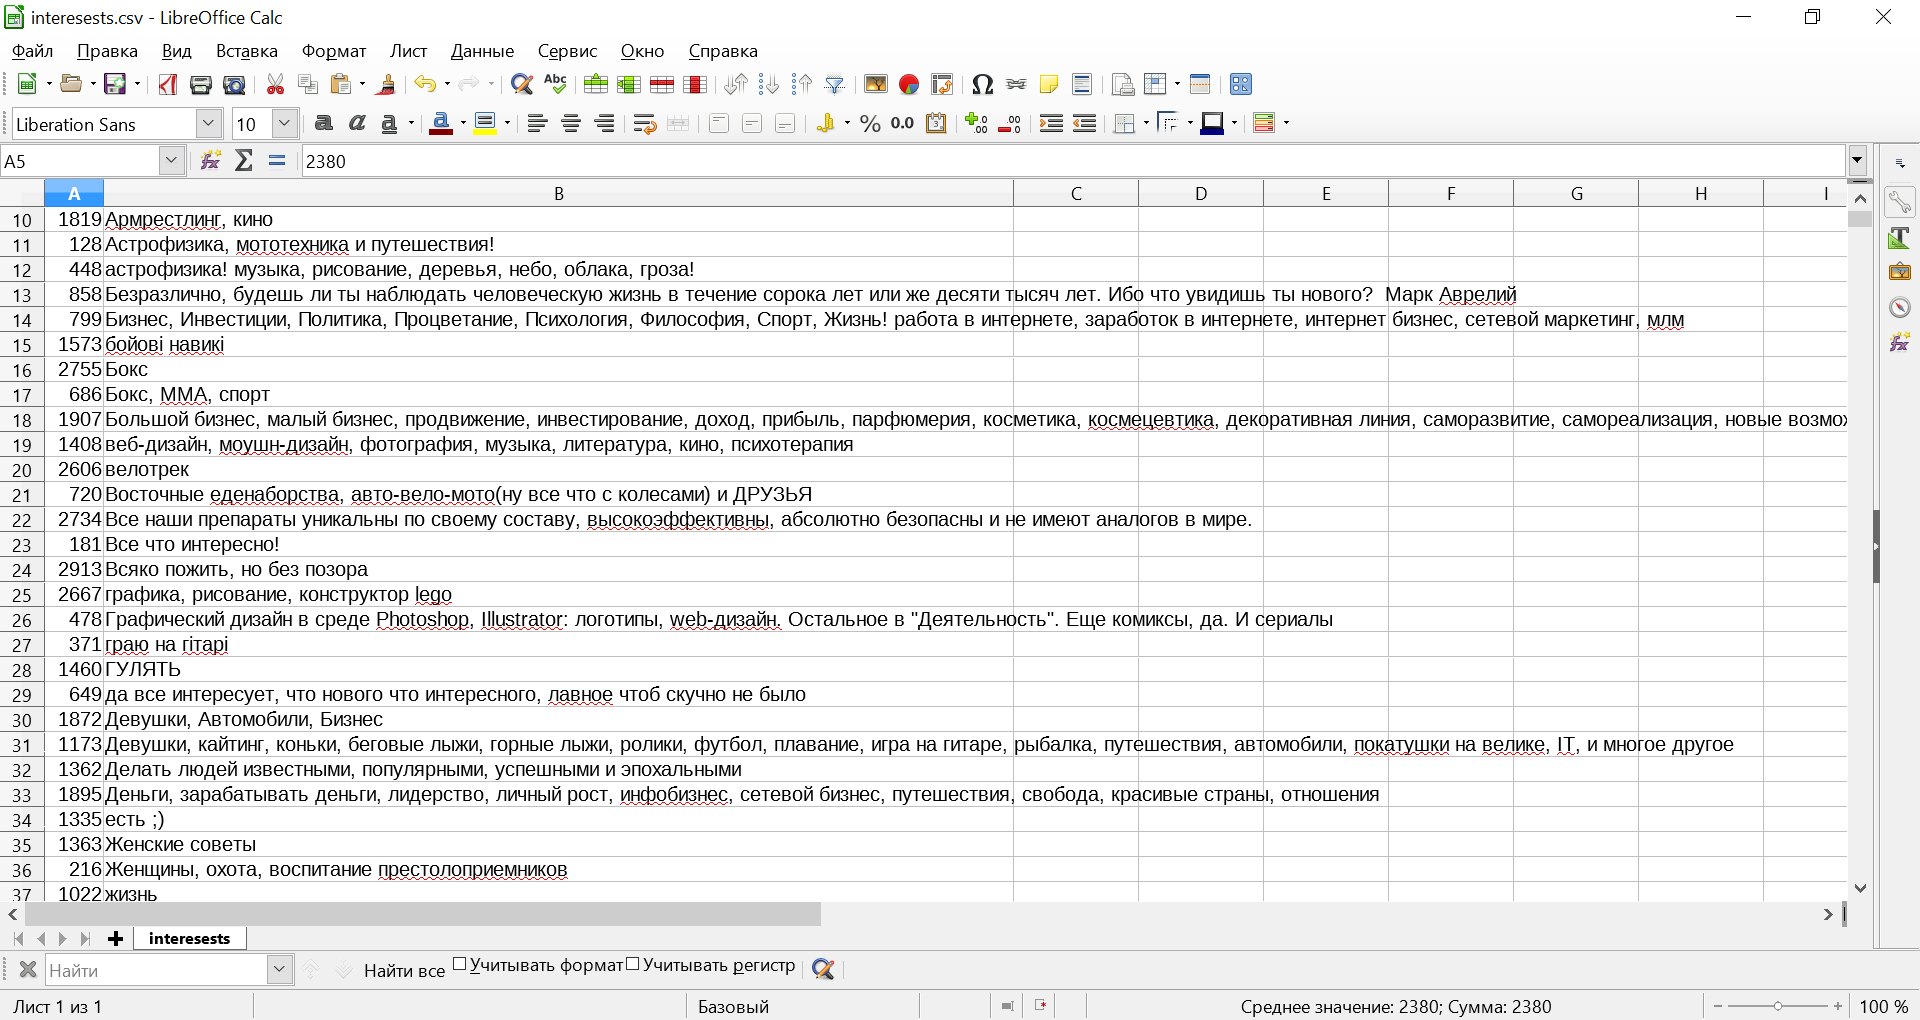
5.4 Interests
Let's see how our users live. This can be done at least by analyzing the following fields specified in the profiles: interests, movies, tv, books, games, about. Additionally, you can analyze the groups in which our users are members, since we have a wonderful getGroupsForUsers () method. With the analysis of groups, we will begin. Below are the top 15 VKontakte groups that Habr users like to be a member of.
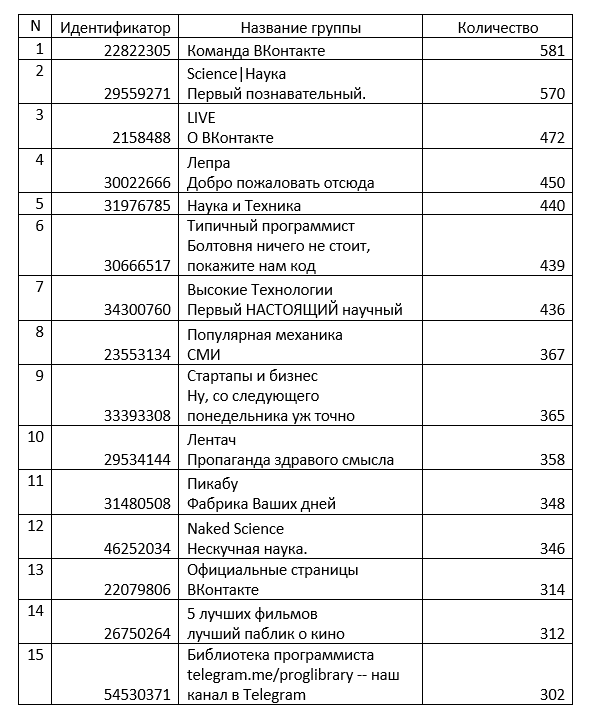
As you can see, information technology and programming do not occupy the last place in the lives of Habr users, but obviously no one is fixated on them.
It makes sense to build histograms based on the values of the fields interests, movies, tv, books, games, about after a long comparison of what users have indicated with general categories, but, unfortunately, there is no time for this. Therefore, let’s go through some points that caught my eye.
1. Apparently, a significant number of Habr’s audience does not favor television, but this is not a fact, but an assumption, since we see only about 20 people, and we don’t know how many people chose not to report it, although they do just that.
2. Literature is the most diverse, and that is typical, the works of Donald Knuth are not included in the list of favorite books for the night.
3. Interests are extremely diverse, and, which is especially pleasing, - sport is not the last place.
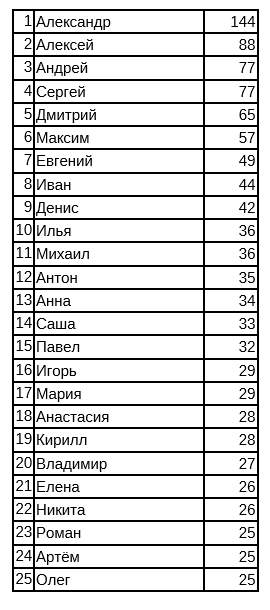
5.5 Just curiosity: TOP-25 names
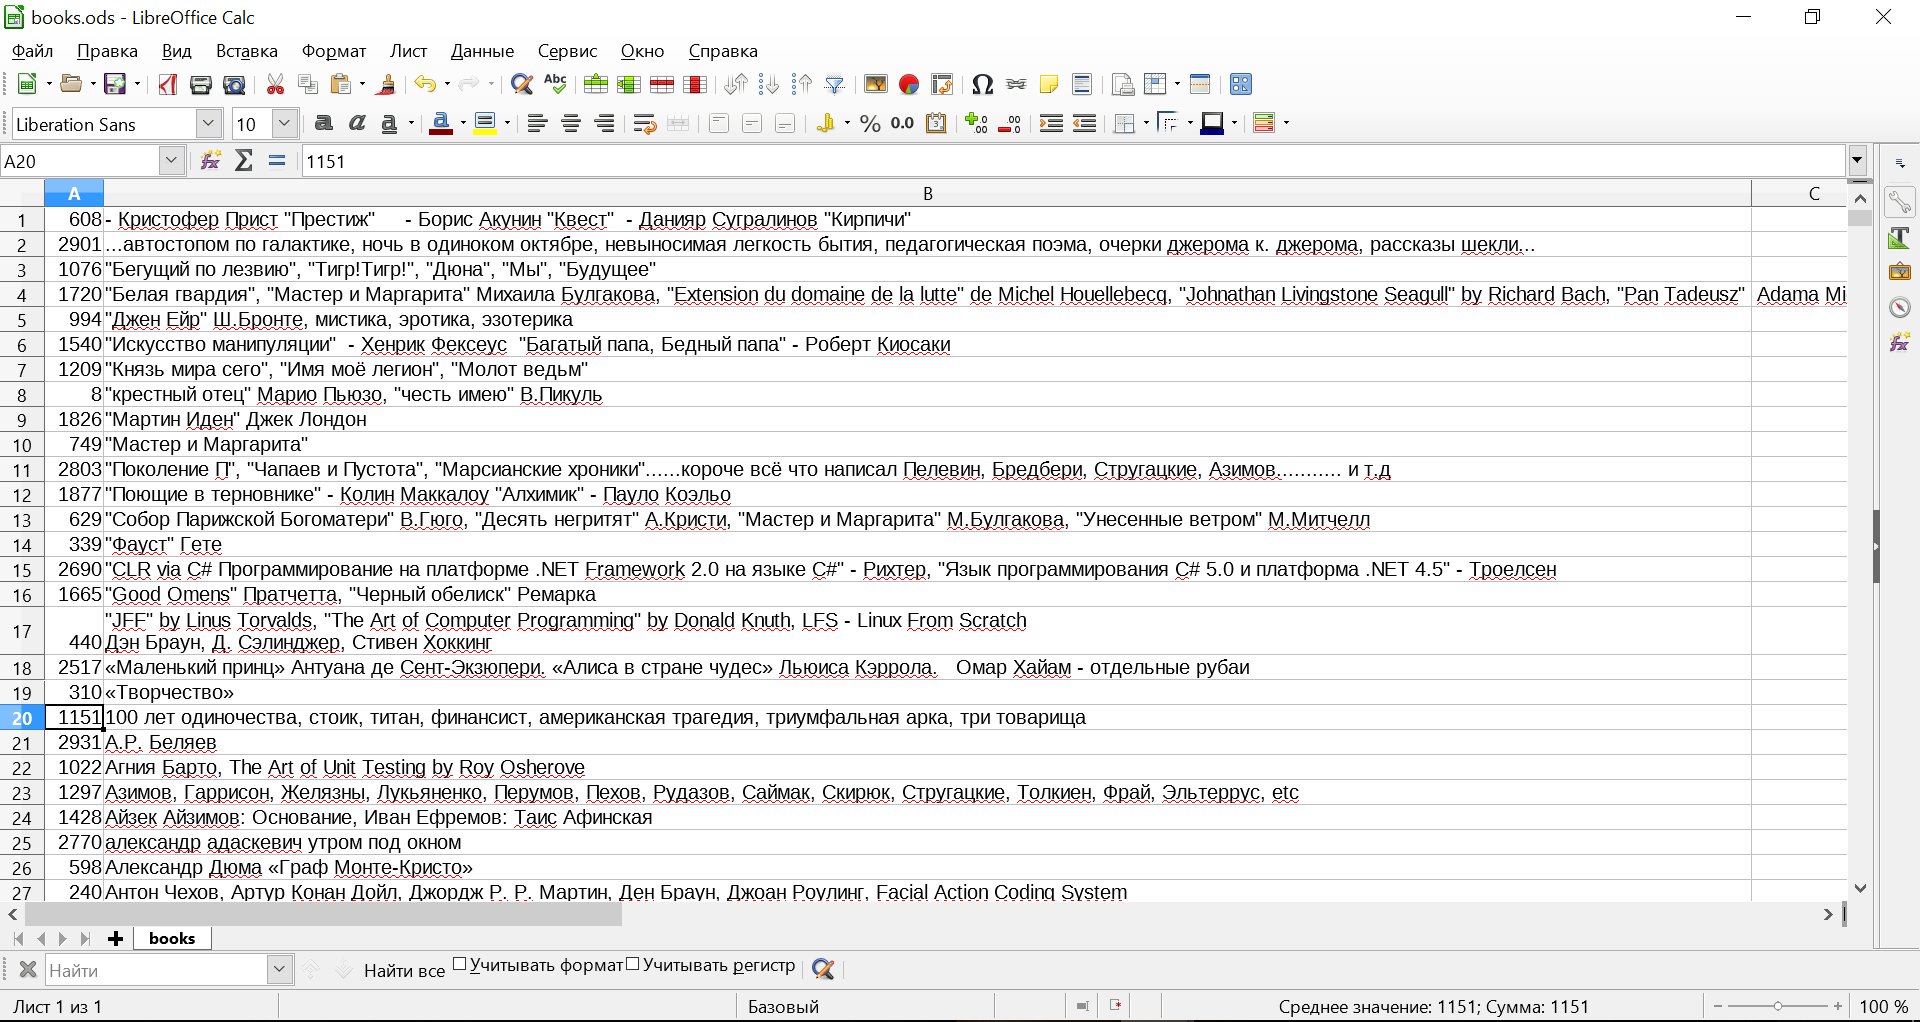
When analyzing the collected data, it became interesting to see what are the most common names for Habr users, most of whom are trying to choose a mysterious nickname. Here is a table from the TOP 25 names from our sample:
Step 6. Preparation of the report and presentation of the results
Thus, summing up the results of a small study, we can safely describe the portrait of the average Mr. or Ms. Habraman:
Accordingly, of the three hypotheses formulated, the third turned out to be the most probable. The first two were dropped.
Data Verification
When someone presents his analysis, and even reports his findings, a real scout will always double-check. Let us do this, and we will - compare the results obtained with data already available from alternative sources.
Let's check with the data that is presented in the "Users" section , accessible to any Habr user.
Matches:
Discrepancies:
Let's also compare with data from a similar study conducted in 2014 by the user Apatic : Who is following Habrahabr?
Matches:
Conclusion
So we figured out how the intelligence cycle can be used to analyze information about communities, which will be useful both for a blogger to understand the audience of readers and a marketer who analyzes who buys products from competitors.
Literature
Update:
A number of readers have doubts that the Habrhabr group on the VKontakte network significantly overlaps with the group of users of Habr. To test this thesis, I suggest a small survey.
Consider the following situation: a new Habr user, having received a “minus in karma” even before his first post / comment on the resource, decides to find out who is hiding behind the sophisticatedly invented nicknames of the Habr users and asks the question: who is Mr./Ms. Habraman?
We will follow the reconnaissance cycle:
Step 1. Statement of the problem
The problem can be formulated as follows: you need to make a portrait of the average Habr user.
Step 2. Planning
2.1 Hypotheses
To effectively collect information, we need working hypotheses, based on which we will understand what data we need and where to look for it. To formulate hypotheses, some preliminary knowledge of the subject is often necessary.
For preliminary information about Habr users, our inexperienced user accesses the Lurkmore website, which, as you know, is distinguished by its many-sided coverage of any phenomenon in the modern world. Perplexed by the negative mood of the author of the article, our Internet scout formulates the following hypotheses regarding who the average Habr user is all the same:
- Hypothesis 1. A stern IT specialist aged who lives in one of our capitals, embittered by stampedes in the metro or kilometers of traffic jams;
- Hypothesis 2. An alien who remained on our planet until the final repair of the control system of his ship, which he hopes to complete according to the manuals posted on Habré by other aliens;
- Hypothesis 3. A young, educated person with a wide range of interests, who is interested not only in computers.
Please note that when formulating hypotheses, we try to comply with the MECE rule (mutually exclusive and collectively exhaustive, which can be translated as a “mutually exclusive and jointly exhaustive list”).
2.2 Data and their sources
Based on a set of formulated hypotheses, we can now determine what data we need so that we can verify it.
Accordingly, we are interested in the following data:
- Interests (hobbies, movies, books, etc.);
- Floor;
- Age;
- Location (city, country).
A good source of such information, as we know, is social networks, in particular the Russian VKontakte network, in which our hero finds a Habrhabr group with almost 670 thousand subscribers and with the motto indirectly confirming one of the hypotheses formulated: “UFO with you!” .
Step 3. Data collection
3.1 Tools
To access the data of subscribers of the group on the VKontakte network, we need:
- Token of access to network data (access token);
- R - programming language for statistical data processing and visualization by graphics;
- Library for accessing the VK API: vkR;
- Development Environment for R: RStudio ;
- MS Excel and LibreOffice.
3.2 Access to data.
To upload data from users of the VKontakte social network, you must use the VK API. Thanks to Dmitry Sorokin , who created the vkR library, working with the VK API from the R environment is now available to any confident (and insecure) user.
In order to be able to access the VK API, it is necessary to generate a so-called access token.
3.3 Data collection process
Since in the comments on the previous article, dear readers showed great interest in the practical component of the data collection process, we will give an example of R code, on the basis of which, if desired, the steps described below can be fully reproduced.
To work with the data of users of the Hubhabr group on the VKontakte network, you will need its unique identifier, which is easy to determine by moving the mouse cursor over, for example, the "Write message" button and, when you see a link like " vk.com/im?sel=- 20629724 ". The numbers are 20629724 and are the desired ID.
#устанавливаем библиотеку vkR
>install.packages("vkR")
#загружаем библиотеку и теперь можем обращаться к ее методам напрямую
>library(vkR)
#подключаемся с помощью добытого маркера доступа
>setAccessToken(access_token = "000000000..000")
#выгружаем в переменную userids список всех идентификаторов пользователей группы
>userids<-getGroupsMembersExecute(group_id = "20629724", progress_bar = TRUE)
#формируем выборку из 3000 случайно выбранных элементов списка
>sampleids<-sample(userids, 3000, replace=FALSE)
#выгружаем данные по выбранным пользователям
#описание полей: https://vk.com/page-1_27445058
>groupdata<-getUsersExecute(sampleids,fields = "sex,bdate,city,country,education,universities,relation,interests,movies,tv,books,games,about", drop=FALSE, flatten = FALSE, progress_bar = TRUE)
#подсчитываем количество инопланетян, девушек и парней
> qofmale_female<-as.data.frame(table(groupdata$sex))
#смотрим, что получилось
> qofmale_female
  Var1 Freq
1    0    2
2    1  853
3    2 2145
#добавляем столбец с подписями для красивой гистограммы
qofmale_female$name<-c("Инопланетяне", "Девушки", "Парни")
#добавляем столбец с кодами цветов
qofmale_female$color<-c("#51b828", "#ff5d4e", "#2879a8")
#выводим диаграмму
> barplot(qofmale_female$Freq, names.arg = qofmale_female$name, col=qofmale_female$color, border = NA)
#выгружаем в CSV-файл на память или для дальнейших манипуляций в MS Excel/LibreOffice
write.csv2(qofmale_female, "C://girlsboysaliens.csv")
3.4 Sample
Internet intelligence should be effective and efficient, so "shoveling" all 670 thousand users is not a good idea. We need a fairly large sample, randomly generated. Our hero likes the figure 3000 and he stops at it. Given the recommendations of sociologists , this amount will be enough even if not all profiles are completely filled.
Step 4. Data processing
Thanks to R, data processing turned out to be quite simple. The only problem our scout encountered was an encoding problem: after uploading data from the VKontakte network, the text in the RStudio console did not display correctly, but the problem was solved as follows:
- We upload the data received from the social network to a variable;
- Save to CSV file;
- Open in LibreOffice - check that everything is read as it should;
- Save the CSV file by setting the unicode UTF-8 encoding;
- We load it back into R using read.csv with the UTF-8 encoding.
Surely, there is a more optimal solution to this problem, who knows - share information in the comments to the article.
Step 5. Analysis of the information
Let's proceed to the analysis of the received data.
5.1 Guys, girls and aliens
If you look at the distribution by gender, you can see the following picture:
We see that about 2/3 were guys, 1/3 were girls, but aliens who could not determine their membership in any particular sex, in our sample there were only two. Hypothesis 2 can be safely discarded.
5.2 Cities and countries
Testing the first hypothesis, which includes the assumption that among the users of Habré, mainly residents of our two capitals, we look at the distribution by city.
Only 2092 users from our selection indicated this field in their profile. The list of the top 15 cities was as follows:
Two capitals occupy the first positions, but the total number of users who indicated Moscow and St. Petersburg is less than a quarter of 2092. Accordingly, it is difficult to call Habr purely metropolitan.
As for the countries in which our users live, it is clear that we are mainly talking about Russia, Ukraine, Kazakhstan and Belarus.
5.3 Audience age
It is interesting to look at the distribution by year of birth of Habr users from the sample and see that the age of the majority of users is in the range of 20-30 years.
The assumption of age from the first hypothesis can be safely excluded, but the corresponding assumption from the third hypothesis is confirmed.
5.4 Interests
Let's see how our users live. This can be done at least by analyzing the following fields specified in the profiles: interests, movies, tv, books, games, about. Additionally, you can analyze the groups in which our users are members, since we have a wonderful getGroupsForUsers () method. With the analysis of groups, we will begin. Below are the top 15 VKontakte groups that Habr users like to be a member of.
As you can see, information technology and programming do not occupy the last place in the lives of Habr users, but obviously no one is fixated on them.
It makes sense to build histograms based on the values of the fields interests, movies, tv, books, games, about after a long comparison of what users have indicated with general categories, but, unfortunately, there is no time for this. Therefore, let’s go through some points that caught my eye.
1. Apparently, a significant number of Habr’s audience does not favor television, but this is not a fact, but an assumption, since we see only about 20 people, and we don’t know how many people chose not to report it, although they do just that.
2. Literature is the most diverse, and that is typical, the works of Donald Knuth are not included in the list of favorite books for the night.
3. Interests are extremely diverse, and, which is especially pleasing, - sport is not the last place.
5.5 Just curiosity: TOP-25 names
When analyzing the collected data, it became interesting to see what are the most common names for Habr users, most of whom are trying to choose a mysterious nickname. Here is a table from the TOP 25 names from our sample:
Step 6. Preparation of the report and presentation of the results
Thus, summing up the results of a small study, we can safely describe the portrait of the average Mr. or Ms. Habraman:
- Age from 20 to 30 years;
- Lives in a large city in Russia, Ukraine, Kazakhstan or Belarus;
- He leads an active lifestyle, is interested in IT, modern science and much more;
- The probability that we have a guy is 2/3, and that a nice girl is 1/3, and certainly not an alien.
Accordingly, of the three hypotheses formulated, the third turned out to be the most probable. The first two were dropped.
Data Verification
When someone presents his analysis, and even reports his findings, a real scout will always double-check. Let us do this, and we will - compare the results obtained with data already available from alternative sources.
Let's check with the data that is presented in the "Users" section , accessible to any Habr user.
Matches:
- Total users: 739,159, and in the VKontakte group almost 670 thousand - the order is the same.
- The sequence of countries in terms of the number of users almost coincides: Russia, Ukraine, Belarus, Kazakhstan, the USA.
- Priority cities: the first 5 are the same.
Discrepancies:
- According to the site, among the users of men - 134 thousand, women - 10 thousand, and the “rest” - about 600 thousand. Perhaps this indicates an invasion of aliens, but most likely users simply did not fill out their profiles completely.
- The percentage of cities differ significantly. We have Moscow - at least 15%, the site also indicates that there are only 6 thousand users in Moscow, which is 1% of all registered users, which is most likely caused by the reluctance of users to completely fill out their profile on the site.
Let's also compare with data from a similar study conducted in 2014 by the user Apatic : Who is following Habrahabr?
Matches:
- 76% are men, 24% are women, which is very close to our result;
- The age distribution is the same;
- The top 4 countries are those in the same order.
Conclusion
So we figured out how the intelligence cycle can be used to analyze information about communities, which will be useful both for a blogger to understand the audience of readers and a marketer who analyzes who buys products from competitors.
Literature
- The art of visualization in business. How to present complex information in simple images. Nathan Yau ISBN: 978-5-91657-737-2
- A lot of numbers. Big data analysis with Excel. John Foreman ISBN 978-5-9614-5032-3, 978-5-9614-5954-8
Update:
A number of readers have doubts that the Habrhabr group on the VKontakte network significantly overlaps with the group of users of Habr. To test this thesis, I suggest a small survey.
Only registered users can participate in the survey. Please come in.
Your age:
- 9.9% <20 years 43
- 28.3% 20 - 25 years 123
- 45.8% 25 - 35 years old 199
- 13.5% 35 - 45 years old 59
- 2.9% 45 - 55 years 13
- 2.3% > 55 years 10
Your gender:
- 87.2% male 371
- 9.1% female 39
- 3.5% find it difficult to answer 15
Your interests:
- 79.1% programming 326
- 4.8% tv 20
- 60.4% of the book 249
- 48% movie 198
- 56% music 231
- 32% sport 132
- 37.8% travel 156