Application Insights. About analytics and other new tools
About a year ago, I wrote a short article about using the preview version of Azure Application Insights (AI) diagnostic and monitoring service . Since then, a lot of interesting additions have appeared in AI. And now, a little over a month ago, AI finally got General Availability.
In this article, I will conduct another review of AI, taking into account new additions, and share the experience of its use on real projects.
To begin with, I work at Kaspersky Lab, in a team that develops .NET services. We mainly use the Azure and Amazon cloud platforms as hosting. Our services handle a fairly high load from millions of users and provide high performance. It is important for us to maintain a good reputation for services, to achieve which we must respond very quickly to problems and find bottlenecks that can affect performance. Similar problems can arise when generating an abnormally high load or non-specific user activity, various failures of infrastructure (for example, databases) or external services, and no one canceled the banal bugs in the service logic.
We tried to use various diagnostic systems, but at the moment AI has proved to be the most simple and flexible tool for collecting and analyzing telemetry.
AI is a cross-platform tool for collecting and visualizing diagnostic telemetry. If you have, for example, a .NET application, then to connect AI, you just need to create an AI container on the Microsoft Azure portal, then connect the ApplicationInsigts package to the nugget application.
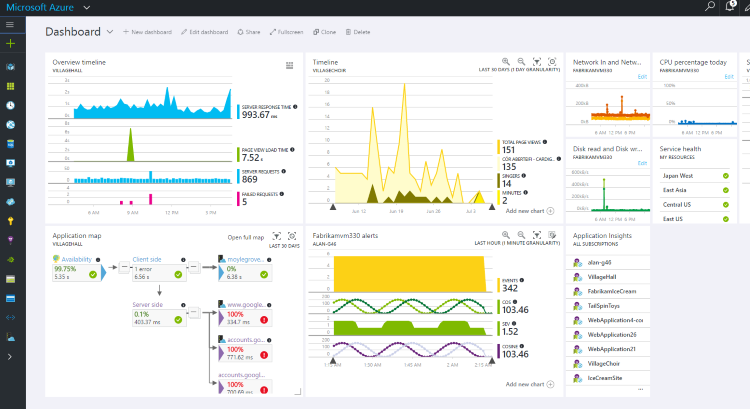
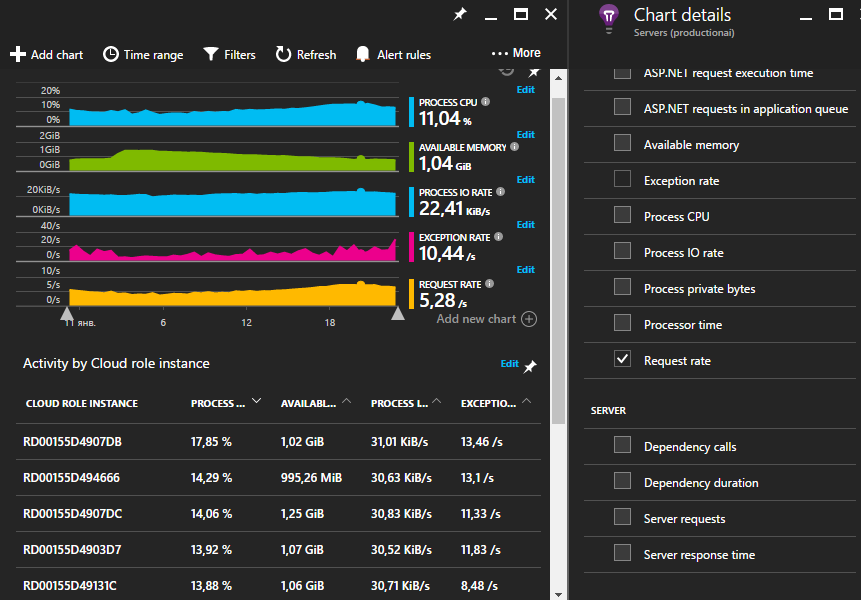
Literally out of the box, AI will start collecting information on the main performance counters of the machine (memory, processor) that your application is running on.
You can start collecting server telemetry like this without modifying the application code: for this it’s enough to install a special diagnostic agent on the machine. The list of collected counters can be changed by editing the ApplicationInsights.config file.
The next interesting point is “dependency monitoring”. AI tracks all outgoing external HTTP calls to your application. External calls or dependencies are understood as calls of your application to the database and other third party services. If your application is a service hosted in the IIS infrastructure, then AI will intercept telemetry for all requests to your services, including all external requests (due to forwarding additional diagnostic information through the CallContext stream). That is, thanks to this, you can find the request you are interested in, as well as see all its dependencies. Application Map allows you to view a complete map of the external dependencies of your application.
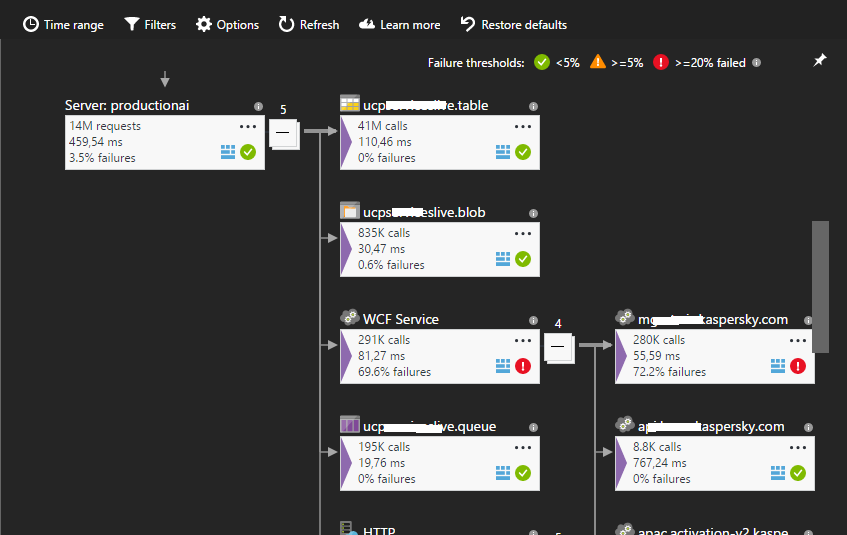
If your system has obvious problems with external services, then theoretically this picture is able to give you some information about the problem.
You can dive deeper for a more detailed study of information on external requests
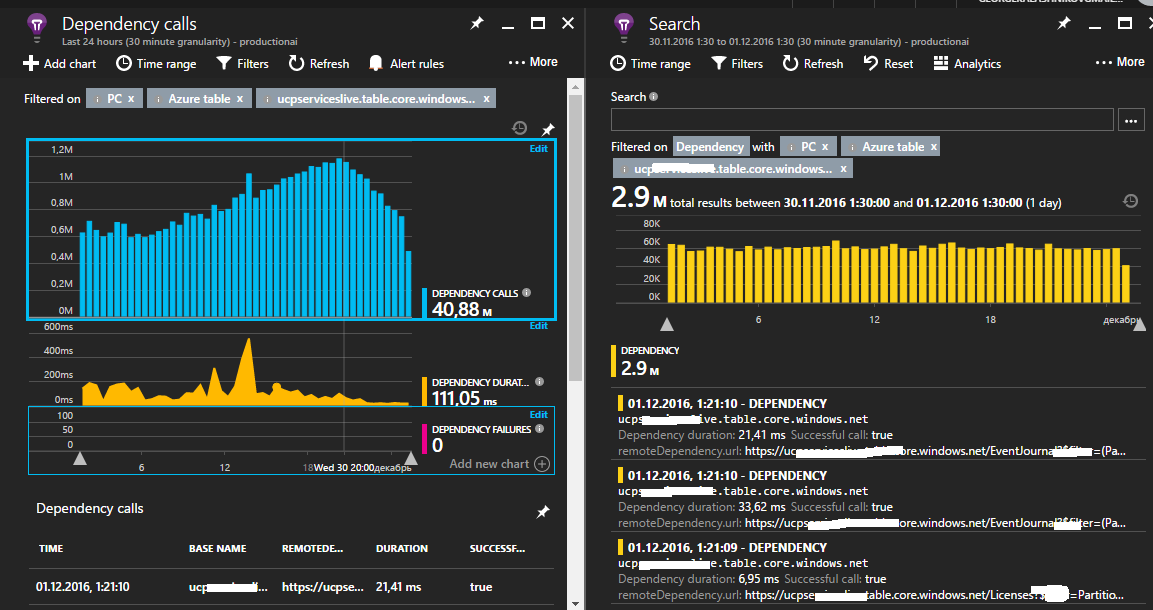
Regardless of the platform, you can connect the extensible Application Insights API to your application, which allows you to save arbitrary telemetry. It can be logs or some custom performance counters.
For example, we write in AI aggregated information on all the main methods of our services, such as the number of calls, percentage of errors and the time of the operation. In addition, we store information on critical areas of the application, such as the performance and availability of external services, the size of message queues (Azure Queue, ServiceBus), the throughput of their processing, etc.
Dependency monitoring, which I wrote about earlier, is a rather powerful tool, but at the moment it is able to automatically intercept only all outgoing HTTP requests, so we are forced to independently write telemetry based on dependencies that were called through another transport. In our case, these are Azure ServiceBus and RMQ, which work on custom protocols.
The telemetry that you collect does not have to have a flat structure (counterName-counterValue). It may contain a multi-level structure with various nesting. This is achieved through the use of a dynamic data type.
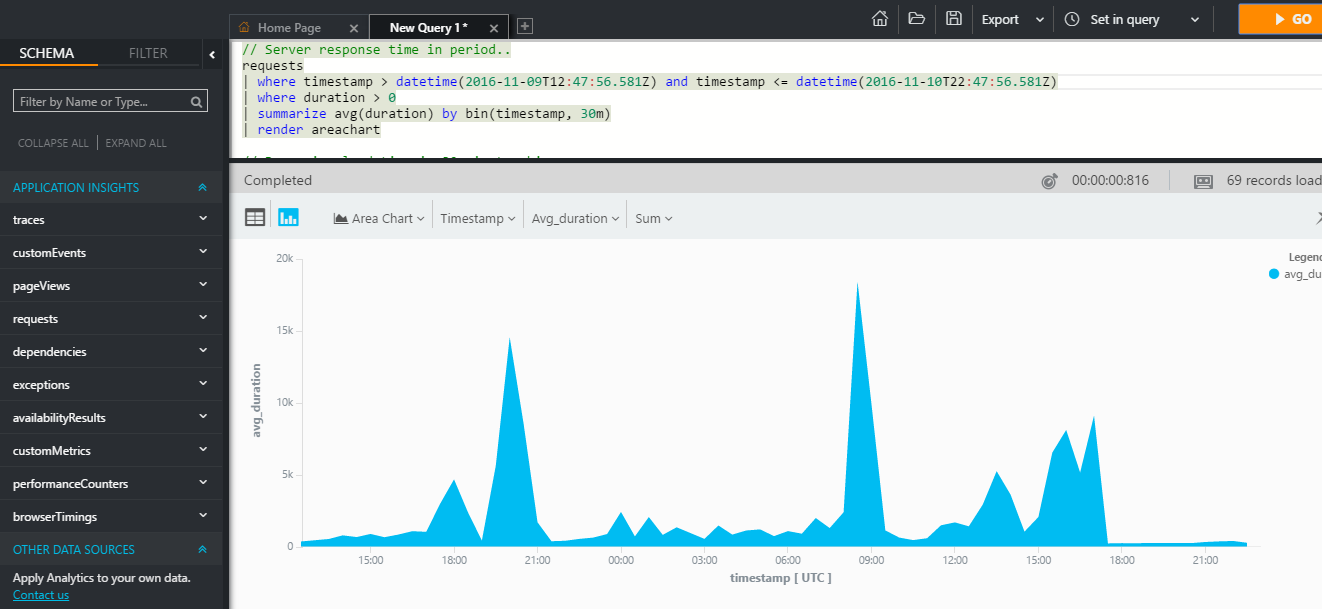
AI allowed writing a similar sophisticated telemetry a year ago, but it was practically impossible to use, because at that time, charts could only be built using simple metrics. The only options for using this telemetry were custom queries, which could only estimate the frequency of occurrence. Now a very powerful Analytics tool has appeared .
This tool allows you to write various queries to your telemetry, accessing the properties of arbitrary events using a special (SQL-like) language.
For an example of syntax, you can look at a query that displays 10 of any successful queries to your web application in the last 10 minutes:
This language comes with many ready-made operators for analysis (aggregate functions and connections, searching percentiles, medians, building reports, etc.) and visualizing telemetry in the form of graphs.

Such information can be used both for performance analysis and for obtaining analytics in solving some business problems. For example, if you are developing some kind of online store, using AI analytics, almost out of the box, can give you an idea of customer preferences depending on their geographical location.
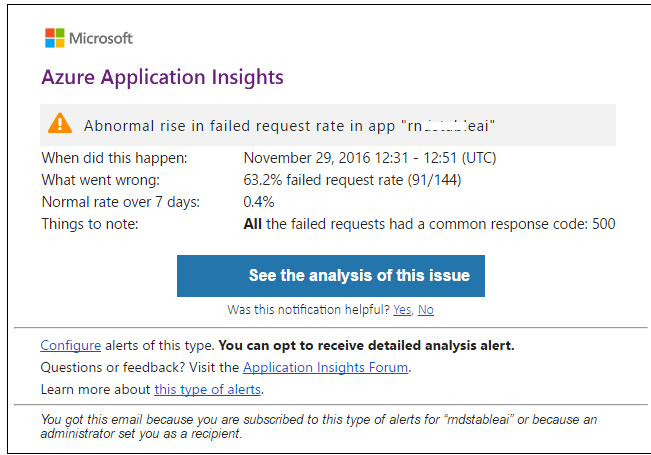
The composition of AI includes the ProactiveDetection component, which, based on machine learning algorithms, is able to determine anomalies in the collected telemetry. For example, the number of requests to your services has increased or dropped sharply, the number of errors or the total duration of some operations has increased.
You can also configure alerts for the telemetry counters you need.
AI stores telemetry for 30 days. If this is not enough for you, then you can use the Continues Export function, which allows you to export telemetry to Azure Blobs. Using Azure Stream Analytics to search for patterns of interest to you in exported telemetry is good practice .
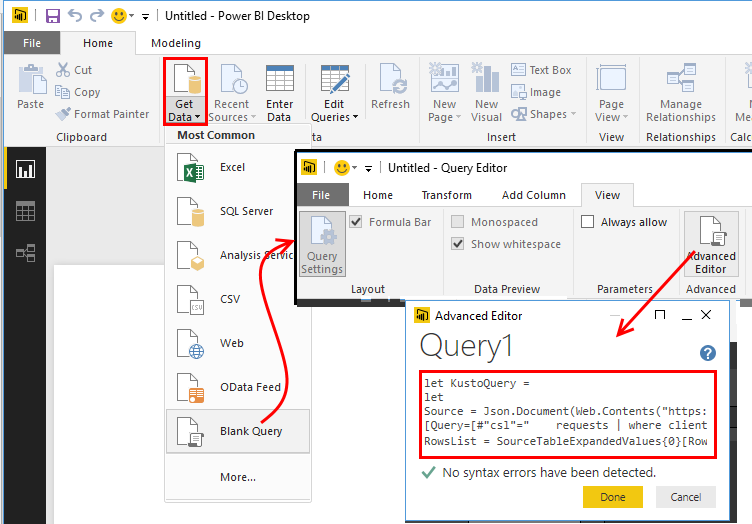
Power BI is a powerful tool for data visualization and analysis. You can connect a special Application Insights Power BI adapter to itand automatically forward some diagnostics to Power BI. To do this, just build the desired query in Analytics and click the export button. As a result of this, you will get a small M-script that will be used as an AI data source.

Sometimes it’s convenient to monitor the health of the system in real time. This is especially true after installing updates. Most recently, the Live Metrics Stream tool has appeared in AI, which gives such an opportunity.

AI can also act as a monitoring service. You can import tests from Visual Studio that test the health of your application. Or, you can create a set of checks directly from the AI portal for geo-distributed validation of the availability of the endpoints you are interested in. AI will perform scheduled checks and display the results on an appropriate schedule.
There is also a special plugin that allows you to display telemetry from an application debugged in dabeg directly in Visual Studio.
These are far from all tools. It is also recommended to use AI for the analysis of user telemetry.
Currently, AI is charged according to the number of so-called save points. A million of which cost about 100 p. One savepoint corresponds to one diagnostic event. Because The AI client itself does not aggregate telemetry, it is advisable for the application to take care of the aggregation itself.
This recommendation should be guided by the assumption that throttling AI will not allow you to save more than 300 diagnostic events per second. Dependencies are getting harder.
For example, in our services the database is called about 10 thousand times per second. AI retains the overall rate of requests, but detailed information (duration, URL, return code, etc.) is saved only for several hundred requests, data for other requests is lost. Despite this, we still have enough data to localize the problems that arise.
Thanks to Analytics and other new features, AI has already helped identify several serious performance issues for our services.
We continue to monitor the further development of this tool.
In this article, I will conduct another review of AI, taking into account new additions, and share the experience of its use on real projects.
To begin with, I work at Kaspersky Lab, in a team that develops .NET services. We mainly use the Azure and Amazon cloud platforms as hosting. Our services handle a fairly high load from millions of users and provide high performance. It is important for us to maintain a good reputation for services, to achieve which we must respond very quickly to problems and find bottlenecks that can affect performance. Similar problems can arise when generating an abnormally high load or non-specific user activity, various failures of infrastructure (for example, databases) or external services, and no one canceled the banal bugs in the service logic.
We tried to use various diagnostic systems, but at the moment AI has proved to be the most simple and flexible tool for collecting and analyzing telemetry.
AI is a cross-platform tool for collecting and visualizing diagnostic telemetry. If you have, for example, a .NET application, then to connect AI, you just need to create an AI container on the Microsoft Azure portal, then connect the ApplicationInsigts package to the nugget application.
Literally out of the box, AI will start collecting information on the main performance counters of the machine (memory, processor) that your application is running on.
You can start collecting server telemetry like this without modifying the application code: for this it’s enough to install a special diagnostic agent on the machine. The list of collected counters can be changed by editing the ApplicationInsights.config file.
The next interesting point is “dependency monitoring”. AI tracks all outgoing external HTTP calls to your application. External calls or dependencies are understood as calls of your application to the database and other third party services. If your application is a service hosted in the IIS infrastructure, then AI will intercept telemetry for all requests to your services, including all external requests (due to forwarding additional diagnostic information through the CallContext stream). That is, thanks to this, you can find the request you are interested in, as well as see all its dependencies. Application Map allows you to view a complete map of the external dependencies of your application.
If your system has obvious problems with external services, then theoretically this picture is able to give you some information about the problem.
You can dive deeper for a more detailed study of information on external requests
Regardless of the platform, you can connect the extensible Application Insights API to your application, which allows you to save arbitrary telemetry. It can be logs or some custom performance counters.
For example, we write in AI aggregated information on all the main methods of our services, such as the number of calls, percentage of errors and the time of the operation. In addition, we store information on critical areas of the application, such as the performance and availability of external services, the size of message queues (Azure Queue, ServiceBus), the throughput of their processing, etc.
Dependency monitoring, which I wrote about earlier, is a rather powerful tool, but at the moment it is able to automatically intercept only all outgoing HTTP requests, so we are forced to independently write telemetry based on dependencies that were called through another transport. In our case, these are Azure ServiceBus and RMQ, which work on custom protocols.
The telemetry that you collect does not have to have a flat structure (counterName-counterValue). It may contain a multi-level structure with various nesting. This is achieved through the use of a dynamic data type.
Sample metric structure
{
 "metric": [ ],
 "context": {
 ...
 "custom": {
    "dimensions": [
      { "ProcessId": "4068" }
    ],
    "metrics": [
      {
        "dispatchRate": {
          "value": 0.001295,
          "count": 1.0,
          "min": 0.001295,
          "max": 0.001295,
          "stdDev": 0.0,
          "sampledValue": 0.001295,
          "sum": 0.001295
        }
      },
     "durationMetric": {
       "name": "contoso.org",
       "type": "Aggregation",
       "value": 468.71603053650279,
       "count": 1.0,
       "min": 468.71603053650279,
       "max": 468.71603053650279,
       "stdDev": 0.0,
       "sampledValue": 468.71603053650279
  }
     } ] }
}
AI allowed writing a similar sophisticated telemetry a year ago, but it was practically impossible to use, because at that time, charts could only be built using simple metrics. The only options for using this telemetry were custom queries, which could only estimate the frequency of occurrence. Now a very powerful Analytics tool has appeared .
This tool allows you to write various queries to your telemetry, accessing the properties of arbitrary events using a special (SQL-like) language.
For an example of syntax, you can look at a query that displays 10 of any successful queries to your web application in the last 10 minutes:
requests | where success == "True" and timestapm > ago(10m) | take 10This language comes with many ready-made operators for analysis (aggregate functions and connections, searching percentiles, medians, building reports, etc.) and visualizing telemetry in the form of graphs.
Such information can be used both for performance analysis and for obtaining analytics in solving some business problems. For example, if you are developing some kind of online store, using AI analytics, almost out of the box, can give you an idea of customer preferences depending on their geographical location.
The composition of AI includes the ProactiveDetection component, which, based on machine learning algorithms, is able to determine anomalies in the collected telemetry. For example, the number of requests to your services has increased or dropped sharply, the number of errors or the total duration of some operations has increased.
You can also configure alerts for the telemetry counters you need.
AI stores telemetry for 30 days. If this is not enough for you, then you can use the Continues Export function, which allows you to export telemetry to Azure Blobs. Using Azure Stream Analytics to search for patterns of interest to you in exported telemetry is good practice .
Power BI is a powerful tool for data visualization and analysis. You can connect a special Application Insights Power BI adapter to itand automatically forward some diagnostics to Power BI. To do this, just build the desired query in Analytics and click the export button. As a result of this, you will get a small M-script that will be used as an AI data source.
Sometimes it’s convenient to monitor the health of the system in real time. This is especially true after installing updates. Most recently, the Live Metrics Stream tool has appeared in AI, which gives such an opportunity.
AI can also act as a monitoring service. You can import tests from Visual Studio that test the health of your application. Or, you can create a set of checks directly from the AI portal for geo-distributed validation of the availability of the endpoints you are interested in. AI will perform scheduled checks and display the results on an appropriate schedule.
There is also a special plugin that allows you to display telemetry from an application debugged in dabeg directly in Visual Studio.
These are far from all tools. It is also recommended to use AI for the analysis of user telemetry.
Currently, AI is charged according to the number of so-called save points. A million of which cost about 100 p. One savepoint corresponds to one diagnostic event. Because The AI client itself does not aggregate telemetry, it is advisable for the application to take care of the aggregation itself.
This recommendation should be guided by the assumption that throttling AI will not allow you to save more than 300 diagnostic events per second. Dependencies are getting harder.
For example, in our services the database is called about 10 thousand times per second. AI retains the overall rate of requests, but detailed information (duration, URL, return code, etc.) is saved only for several hundred requests, data for other requests is lost. Despite this, we still have enough data to localize the problems that arise.
Thanks to Analytics and other new features, AI has already helped identify several serious performance issues for our services.
We continue to monitor the further development of this tool.