December 7, 2016 at 10:58
Trust formula

Today we will talk about one of the key features of our DLP system - the level of trust. This is an indicator that is assigned to each person in the company and reflects the likelihood that this employee will be a violator.
Now in DLP solutions analytics comes to the fore. A couple of years ago, all Russian vendors began to gradually try to “deploy” DLP-systems from the fight against leaks in the direction of identifying and preventing other illegitimate actions of employees - fraud, kickbacks, collusion, etc. However, each person generates such an amount of information per day that it is impossible to track the actions of each even in medium-sized companies, not to mention big business. Therefore, the ability of the system to do high-quality analytics in an automatic mode and outline a circle of people “under suspicion” would be an obvious advantage. So the idea of creating a level of trust arose, the main purpose of which was transparency of the situation with internal threats in the company.
We wanted the security guard to quickly, without a long analysis of the data of the DLP system, understand who the company should take a closer look at. Very simple and elegant concept, right? It would seem that the idea lies on the surface. However, in order to create such a trust formula that would not cause a furious amount of false positives, it took a lot of work to be done and the results of social engineering, statistics and business analysis should be combined into a single whole. In this article, we will talk about how to derive a formal expression of the amount of trust in employees in terms of protection against intentional or accidental leakage. Judging by the real statistics of incidents, this formula turned out to be quite accurate.
Bit of theory
The idea of automatic person profiling in DLP systems is not just in the air, but also often appears in international safety standards and recommendations. But its implementation today does not have a generally accepted methodology. The natural way is to build such an indicator based on the analysis of a large amount of data (Big Data). In the Big Data language of the technique, this problem relates to “trust and reputation management” [1].
Profiling is inherently a field of behavioral analysis. From the point of view of business behavior, methods of modern psychology, physiology, sociology are applied here [2, 3].
The methods of mathematical statistics, random processes, and statistical physics are considered as a computing device [4-9]. A separate branch of models is based on the theory of neural networks [10, 11].
Trust formula - accuracy and simplicity
Consultations with experts in the field of information protection against leakage made it possible to single out the most effective among theoretical methods: sociology, mathematical statistics, business analysis. Even such a set of methods is very extensive, and their verification is very time-consuming, despite the fact that combining these methods is an exciting undertaking. Therefore, we started by selecting the most suitable methods for our purpose. The main criteria for choosing were accuracy and simplicity.
We decided that the best indicator of accuracy is how many people from the number of real intruders detected by security officers, the system was able to automatically identify as potential violators. Thus, we compared the results of the work of the security officer and the calculations of different methods.
The second criterion issimplicity - it is responsible for the absence of redundant variables (factors) in the model of confidence level. The fact is that each additional factor introduces uncertainty; as a result, the transparency of the result is lost. In other words, if the level of trust assigned to a person changes dramatically, it will be more difficult for a security guard to understand what caused these changes. This would negate our efforts to achieve the main goal - to make DLP analytics data as clear and transparent for the user as possible.
According to these criteria, the optimal algorithm was adopted, which was subsequently embedded in the DLP system.
Initial data
We have a very vast array of data on real security incidents. Each implementation and pilot project generates reports on events and incidents. These reports also contain information about violators - personnel information, a list of events related to this employee, signs for placing a person in a high-risk group.
Actual data were incident data from 8 industries:
- industry,
- IT & Telecom,
- government bodies
- power engineering
- cans
- oil and gas industry,
- trade and services
- transport.
Some measurable factors were also taken into account, including:
- volume of correspondence;
- the number of IS events and incidents;
- distribution of events among groups of persons of special control;
- distribution of messages over communication channels;
- distribution of events by criticality levels;
- persons included in the pilot or deployment report are real participants in security incidents;
- other.
As a result, we chose three tools for creating a trust formula - statistics, sociology, and business specifics. These three “Cs” were supposed to provide us with a three-dimensional vision of employee activity.
"C" No. 1 - Statistics
As a statistical tool, we chose the traditional autoregressive model with an error in the form of white noise. This model allows you to choose the best line (law) on the graph of the dependence of the factors taken into account. This model has shown good results in a number of similar tasks.
We began the factor analysis by comparing the volume of the person’s correspondence and the number of events detected in this correspondence. Assuming that events linearly depend on the volume of correspondence, we obtain the following law of the dependence of events on the number of messages: The

graph of the dependence function is indicated by a dotted line because in some sense the “accuracy” of this law (the value of R 2 ) is insufficient to consider this law as -Any acceptable to all persons. Usually for accuracy criteria we accept a lower threshold of this value of 0.8.
The next step that statistics allows you to do is to blindly divide people into groups. The division is dichotomous - we divide all persons into 2 groups, and if the accuracy of the model becomes sufficient, we accept such a partition. Otherwise, divide each subgroup by 2 more and so on. In practice, 1-2 iterations are sufficient.
The statistical division into groups of persons already at the first iteration gave convincing "accuracy" - more than 90%. Naturally, the question of the adequacy of the sample size for such a conclusion is separately solved.
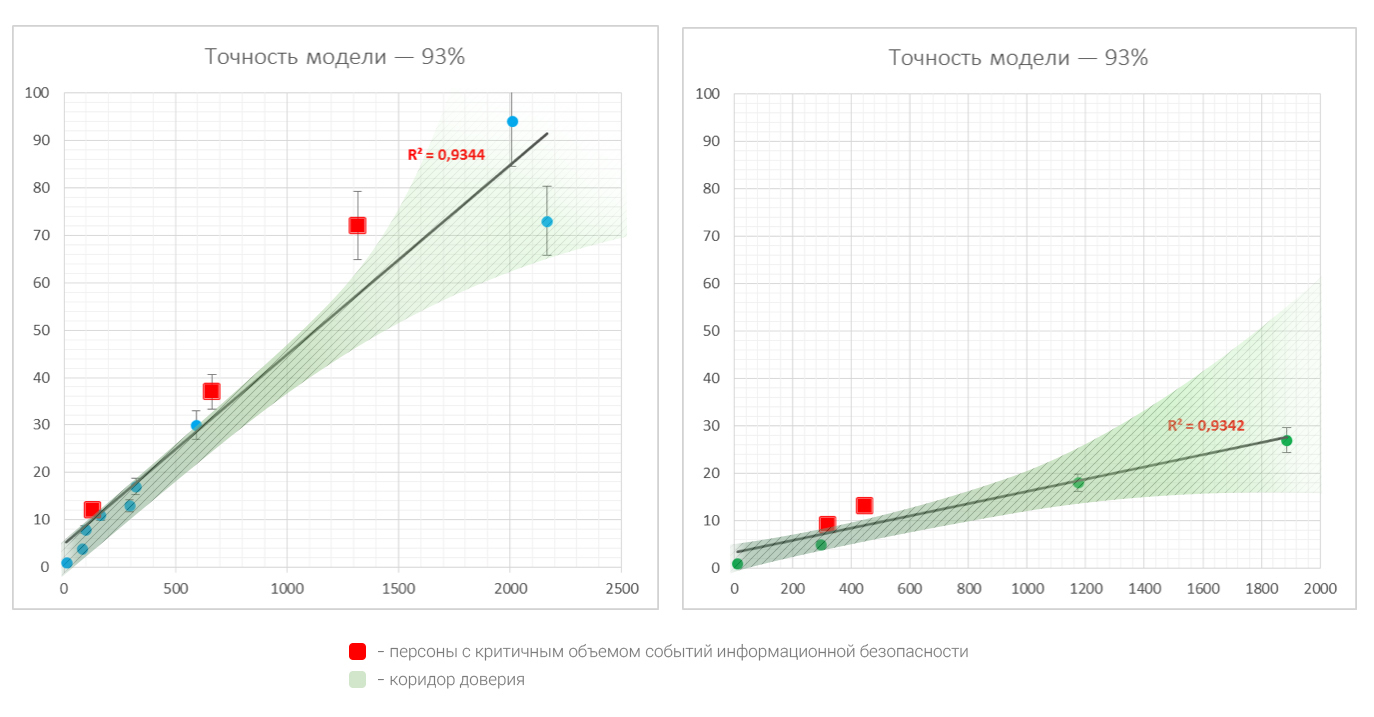
With a fairly good sample, the regression line (the law of dependence) can be used as a forecast for any person. And deviations of persons from this law can be attributed, from the point of view of statistics, to anomalies.
Everything would be fine, but statistics that are not supported by business sense often give results that are inadequate to the real state of affairs.
"C" No. 2 - Sociology
In the third stage, we slightly adjusted our model. We needed to understand what connects the persons within each statistically selected group. Therefore, the need arose to search for features consistent with the statistical partition. For this, we used the methods of sociology and business analysis.
Monitoring sociological research and their practical assessment gave the following options for categories of persons:
- neglected users;
- careful users;
- advanced users;
Each group has its own pattern of behavior, which people involuntarily adhere to. Moreover, on the basis of each behavior pattern, certain predictive threat models can be built. For example, the actions of users who are negligent in the transfer and storage of data will carry a higher risk of accidentally compromising information, regardless of the communication channel. Cautious users, by contrast, are more likely to be a source of intentional threats. Their activity usually affects communication channels that are not described in corporate rules.
Advanced users are well acquainted with the IT infrastructure and are especially advanced in modifying, replacing data. This group requires special control of workstations and used programs at the OS kernel level. Communications of advanced users and neglected users are also of interest, since the former can take advantage of the insufficient information security competence of the latter. Cyber security incidents, avalanche events, events related to corporate document management systems and databases are common among the advanced users group.
"C" No. 3 - Business Specifics
Regarding business factors, it is especially important to determine the level of detail in order to avoid inefficient complication of the model.
Of course, in the ideal case, the security officer has business process diagrams that involve commercially important data. In reality, this is extremely rare.
In these situations, the ability of DLP systems to determine the types of documents in the information flow and visualize their movement helps. At the same time, even for a short observation period, the accumulated information gives a clear picture of how data is transferred within the framework of certain processes. We identified several groups of employees, including:
- persons approving documents;
- persons with privileged access rights;
- employees liable
- and some others.
From the point of view of labor characteristics, you can distinguish persons in the following groups:
- outsourced employees, contractors;
- Active business users
- employees on probation or, on the contrary, leaving.
All these groups have certain features of working with information, and accordingly require separate control. So, outsourced employees and business-active users differ not only in the volume of information security events generated, but also in communication channels.
A special position is enjoyed by a group of financially responsible employees. They are characterized by a predominance of events related to economic security events. In the field of accounting, some industry workflow is usually used, which can be successfully taken into account by the rules of the policies of the automated DLP system.
The final formula for the level of confidence
During the evaluation of various models of the level of confidence, it became clear that it should depend on:
- number of events;
- risk groups, which include sources and senders of messages;
- distribution of events by criticality level - from low to high
Thus, the level of trust is a materially limited function. It can be formally defined as follows:

where S is the number of events, GR n is the distribution of events on the set of risk groups, n is the dimension GR n , D K is the distribution of events on the set of criticality levels, K is the number of criticality levels (in our case, K = 5 ), t is the considered moment of time.
Using a model that takes into account these factors, we were able to automatically identify more than 60% of the total number of violators independently identified by security officers in the course of investigations and analysis of incidents.
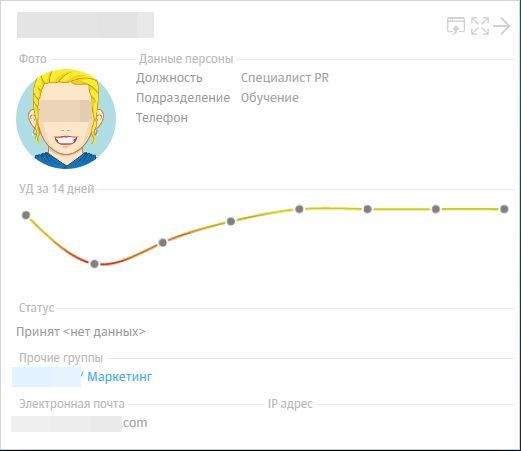
This result was a powerful argument in order to put into practice a dynamic level of trust in a DLP solution.
Conclusion
Despite the fact that now the level of trust is working successfully and is one of the key elements of analytics in our DLP system, we are constantly working on improving the formula. Perhaps someday in the future we will be able to write a continuation of this article entitled "How we made the formula of trust more accurate several times."
Most likely, competition will help in the development of technology. While we are one of the DLP vendors seriously playing in this field, however, as already mentioned at the beginning of the article, behavioral analysis is now in trend, so other domestic developers will probably begin to look en masse in this direction soon.
Sources
- Omar Hasan, Benjamin Habegger, Lionel Brunie, Nadia Bennani, Ernesto Damiani. University of Lyon, Department of Computer Technology, University of Milan. A Discussion of Privacy Challenges in User Profiling with Big Data Techniques: The EEXCESS Use Case.
- George W. Fairweather, Louis G. Tornatzky. Experimental Methods for Social Policy Research.
- Long Jin, Yang Chen, Tianyi Wang, Pan Hui, Athanasios V. Vasilakos. Understanding User Behavior in Online Social Networks: A Survey // IEEE Communications Magazine September 2013.
- Lanouar Charfeddine Wadie Nasri. The Behavior Intention of Tunisian Banks' Customers on using Internet Banking // International Journal of Innovation in the Digital Economy, 4 (1), 16-30, January-March 2013.
- Gunjan Mansingh & Lila Rao & Kweku-Muata Osei-Bryson & Annette Mills. Profiling internet banking users: A knowledge discovery in data mining process model based approach // Springer Science + Business Media New York 2013.
- Rathindra Sarathy, Krishnamurty! Muralidhar. Evaluating Laplace Noise Addition to Satisfy Differential Privacy for Numeric Data // TRANSACTIONS ON DATA PRIVACY 4 (2011) 1-17.
- Chang-Moo Lee. Criminal profiling and industrial security // Springer Science + Business Media New York 2014.
- Yanli Yu, Keqiu Li, Wanlei Zhou, Ping Li. Trust mechanisms in wireless sensor networks: Attack analysis and countermeasures // Journal of Network and Computer Applications 35 (2012) 867–880.
- WT Luke Teacya, Michael Luckb, Alex Rogersa, Nicholas R. Jenningsa. An Efficient and Versatile Approach to Trust and Reputation using Hierarchical Bayesian Modelling.
- Weihua Song, Vir V. Phoha. Neural Network-Based Reputation Model in a Distributed System // Proceedings of the IEEE International Conference on E-Commerce Technology.
- Bo Zong, Feng Xu, Jun Jiao and Jian Lv. A Broker-Assisting Trust and Reputation System Based on Artificial Neural Network // Proceedings of the 2009 IEEE International Conference on Systems, Man, and Cybernetics.
Thanks to Solar-Alex for helping with this article.