Raise IDS / NMS: Mikrotik and Suricata with a web interface
- Tutorial
Apparently, I have such a karma: no matter how I undertake the implementation of any service on the open source, I will definitely find a bunch of manuals, each of which will not work in my particular case, the ready solution will not start or dislike it, what else will happen somebody is indigestible, and as a result you have to make your own way to the result.
This time all the manuals were on ELK5 or even older, but I didn’t really like to install the software of the previous versions. I wanted to take a software with the most promising terms of support: preferably the freshest of stable ones.
As a result, in order to continue to be able to repeat the perfect feat without repeating all the torment, you have to write such step-by-step cheat sheets, which I share with you.
So, today Mikrotik (RouterOS), Suricata 4.1, Elasticsearch + Filebeat + Kibana 6.5.
Conditions:
I will not tell you here what IDS / IPS / NMS is, why it is needed and how it happens. Everyone knows this without me, but whoever does not know will naguglit.
Also, I will not justify my choice between Snort and Suricata in favor of the latter. It's a matter of taste.
But I will superficially explain how this works:
Suricata in some way receives traffic. There are three options: a) pass it through itself in inline-mode, b) receive a copy of the traffic from the switch port and c) analyze the dumps with the traffic. The resulting traffic Suricata analyzes and on the basis of the analysis gives data about what she found there in this traffic.
Suricata data can be issued in JSON. Accordingly, having structured data, they can be fed to any system for processing, systematization, analysis and visualization.
For the analysis and visualization of data, as I understand it, not being an expert in this field, ELK-stack is perfect. ELK-stack originally consisted of Elasticsearch, Logstash, Kibana. Now Beat has been added to it (a family of program interfaces acting as an intermediary between the data source and Logstash or Elasticsearch). Looking ahead, I will say that there was no Logstash, because the Beat gives the data directly to Elasticsearch perfectly, and Elasticsearch eats it perfectly. The bored data Elasticsearch passes Kibana to the web interface for the entire ELK stack. Kibana, using the templates transferred to it by Filebeat, provides the user with a visualization of the data, the so-called Dashboards. Considering the fact that Elasticsearch, Logstash, Beat and Kibana is the fruit of the work of a single manufacturer,
Thus, based on the above, the task can be described as follows: get a copy of the traffic from the router port, transfer it to Suricata, get JSON-formatted data from Suricata, transfer it to Filebeat so that the latter in turn sends it to Elasticsearch and helped Kibana create their visual display.
If I had a hardware Mikrotik router, then the question of port mirroring would not be at all. Everything would be decided by the inclusion of traffic mirroring passing through the external interface to any free port of Mikrotik itself. If there were no free port on Mikrotik, it would be possible to enable port mirroring on the switch. But in my case, Mikrotik had no physical ports at all, and the port on the switch received traffic from the entire host, on which, besides Mikrotik, there were several other virtual machines.
And then I once again mentally said: "Thank you, Mikrotik!". Thanks for the sniffer built into RouterOS. By tradition, we manage without screenshots, only console commands.
Open the terminal in WinBox and turn on the sniffer:
the name of the interface from which you intend to intercept traffic, and instead of 192.168.1.253 , the IP address of the machine to which the intercepted traffic will be sent via the TZSP protocol .
With Mikrotik'om everything.
In general, I am not very Linux-headed, so I like pop distros most of all. Well, except that I like the more ascetic Debian more. That started with him. Well, of course, by virtue of non-linear headaches, I wanted to put the binaries from the repository as well. Build is always lazy for me. So, if it is possible to choose Debian, do not choose . Now I don’t remember exactly where I had a plug in the installation of the entire farm under Debian, but it was. And the whole further story about installing everything under Ubunta.
A 4-core virtual machine with 4 gigs of RAM was created, Ubuntu Server 18.04.1 LTS (x64) was downloaded and installed on it
Since at each stage I made snapshots, and then repeatedly rolled back to them, at the end I lit up pretty glitches with the time sync in a virtual machine with real time.
Therefore, we immediately set the correct time zone and NTP synchronization: In order to have no problems with dependencies during the installation of Suricata, we add the universe repositories in /etc/apt/sources.list :
We also add a repository, from where we will take Suricata:
Update the package database:
Install Suricata:
The next step is to install the rules for Suricata and their update : Start the update itself suricata-update : Running without additional configuration will give us Emerging Threats Open ruleset: To see a list of sources , execute: Updating the sources of the rules: Let's see what has been updated there in the sources, we will execute it again: We include all free sources: And once again we update the rules: Suricata is installed. Now you need to get traffic.
Trafr is an application written by Mikrotik to convert TZSP traffic to pcap. The application is 32-bit, so to start it you will need to enable support for 32-bit applications in 64-bit Ubunta: Download and unpack trafr : Check that traffic is caught: I had a symbolic output in graphical mode in the virtual machine console after such launch reboot. When connecting remotely via ssh to PuTTY, there were no problems. If you see random flickering on the screen, then the traffic arrives, and trafr catches it. If so, we transfer the trafr to the permanent residence and start it with the transfer of the caught traffic through the pipeline immediately to Suricata:
Now we check that the traffic arrives in Suricata, for this we perform in the next terminal: You
should see a smart scrolling of meaningful text - a log for receiving traffic of meerkaty.
It is also useful to make sure that Suricata not only receives traffic, but also analyzes:
This is the very output of events from Suricata in JSON format that we will feed to Filebeat.
Install the PGP key required to use the Elastic repository and install the necessary dependencies: Please note that Java version 8. Everything above 8 is not supported. Therefore, if you have previously managed to install more recent Java, demolish it and put 8. Make sure that Java is installed as it should: We get something like this output:
Create a username and password to access Kibana. Instead of admin, select something that suits your taste:
Since ELK will run on localhost, configure the reverse proxy in nginx:
Restart nginx:
Put Elasticsearch:
Turn on autorun when booting the OS: Run: Check if the hardware has risen: Depending on the performance of your piece of hardware, it may take some time to start the ES. If we get connection refused , then just repeat the request and wait until we get something like a response:
Put Kibana: Enable
autorun when booting the OS: Start: Now you can go to 192.168.1.253 (of course, the IP address is the one that was assigned to your car with meerkat). The Kibana title page should open. Put the Filebeat: Enable autorun when booting the OS: Enable the Suricata module included in the Filebeat module set: Install the Suricata plugins in Elasticsearch: See UPD on May 22, 2019. Restarting Elasticsearch: Perform the initial Filebeat configuration, at the same time loading the templates in Kibana: Check that Filebeat found /var/log/suricata/eve.json
and processes it, to do this, run Filebeat in a mode of displaying data with a publish marker :
The first is the json-formatted output of Filebeat itself, then the simple text output of its logs, and only after some time the output from Suricata, so wait and see that everything works. After that, interrupt Filebeat and return to bash.
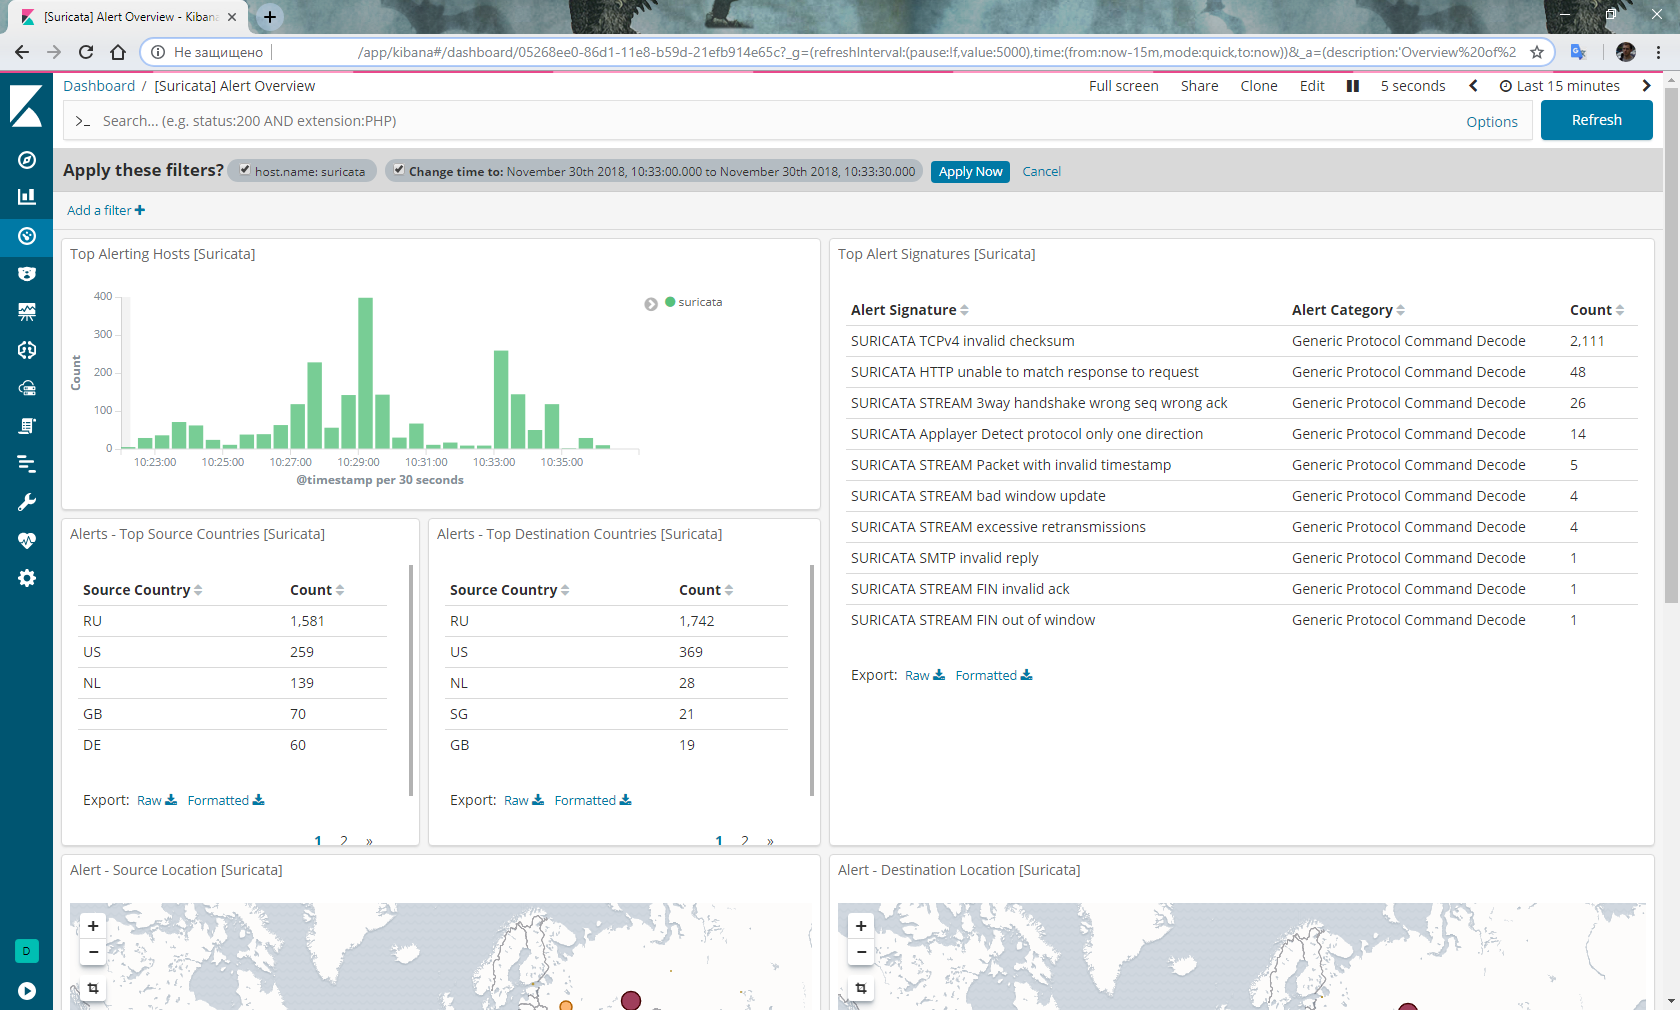
Enable autorun when booting the OS: Start Filebeat: Go to Kibana, select Dashboard from the menu on the left, select the filebeat- * index . Again choose Dashboard, select [Suricata] Alert Overview from the list and should get something like this:
Do not forget the logrotate, and not that no matter how capacious the hard drive, Suricata will score it very quickly:
In addition, there were rumors that someone regularly has a sniffer in Mikrotik with the status of running and stops sending traffic. Then we write a script to restart the sniffer and run it on a schedule:
Frankly, I'm not quite happy with the stability of the above bundle. Namely: it is worth rebooting, and miracles begin. Once I stopped processing all the rules except the pair. I had to reinstall everything. The second time Elasticsearch stopped receiving data from Filebeat at all, and had to roll back to the snapshot state before rebooting.
These problems have not yet decided.
In addition, plans to implement IPS on the basis of IP-addresses of villains identified by Suricata transferred to Mikrotik.
UPD: Accusations of instability are cleared. My conclusion about stopping rule processing was wrong. In fact, the reason for the emptiness in Dashboard after a reboot is due to the fact that Filebeat and Elasticsearch take quite a lot of time to parse a multi-gigabyte json file from meerkats. If you open the Dashboard with events for the period, which includes the date of creation of the eve.json file , you can see how the columns of the chart grow as the file is processed. Along with the processed events, there are also alerts in the corresponding Dashboard. In addition, the sniffer in RouterOS on x86 did not hang even once.
UPD dated May 22, 2019 : Starting with Elasticsearch 6.7, the ingest-geoip and ingest-user-agent plugins are converted to modules. Accordingly, the item with their installation is skipped.
Also, when updating, get the Elasticsearch launch error. You will see an error in the logs:
To restore performance perform:
This time all the manuals were on ELK5 or even older, but I didn’t really like to install the software of the previous versions. I wanted to take a software with the most promising terms of support: preferably the freshest of stable ones.
As a result, in order to continue to be able to repeat the perfect feat without repeating all the torment, you have to write such step-by-step cheat sheets, which I share with you.
So, today Mikrotik (RouterOS), Suricata 4.1, Elasticsearch + Filebeat + Kibana 6.5.
Instead of intro
Conditions:
- Mikrotik on i386 in a virtual machine on host A. All interfaces on Mikrotik are scattered across VLANs, the host has one physical network interface.
- Free resources for IDS / IPS / NMS on host B with a single physical network interface.
- 20 megabyte channel out.
- The desire to receive analytics about traffic passing through the Mikrotik interface.
- The budget in horseradish rubles and FIG kopeks.
- Some hassle free time.
I will not tell you here what IDS / IPS / NMS is, why it is needed and how it happens. Everyone knows this without me, but whoever does not know will naguglit.
Also, I will not justify my choice between Snort and Suricata in favor of the latter. It's a matter of taste.
But I will superficially explain how this works:
Suricata in some way receives traffic. There are three options: a) pass it through itself in inline-mode, b) receive a copy of the traffic from the switch port and c) analyze the dumps with the traffic. The resulting traffic Suricata analyzes and on the basis of the analysis gives data about what she found there in this traffic.
Suricata data can be issued in JSON. Accordingly, having structured data, they can be fed to any system for processing, systematization, analysis and visualization.
For the analysis and visualization of data, as I understand it, not being an expert in this field, ELK-stack is perfect. ELK-stack originally consisted of Elasticsearch, Logstash, Kibana. Now Beat has been added to it (a family of program interfaces acting as an intermediary between the data source and Logstash or Elasticsearch). Looking ahead, I will say that there was no Logstash, because the Beat gives the data directly to Elasticsearch perfectly, and Elasticsearch eats it perfectly. The bored data Elasticsearch passes Kibana to the web interface for the entire ELK stack. Kibana, using the templates transferred to it by Filebeat, provides the user with a visualization of the data, the so-called Dashboards. Considering the fact that Elasticsearch, Logstash, Beat and Kibana is the fruit of the work of a single manufacturer,
Thus, based on the above, the task can be described as follows: get a copy of the traffic from the router port, transfer it to Suricata, get JSON-formatted data from Suricata, transfer it to Filebeat so that the latter in turn sends it to Elasticsearch and helped Kibana create their visual display.
Mikrotik RouterOS
If I had a hardware Mikrotik router, then the question of port mirroring would not be at all. Everything would be decided by the inclusion of traffic mirroring passing through the external interface to any free port of Mikrotik itself. If there were no free port on Mikrotik, it would be possible to enable port mirroring on the switch. But in my case, Mikrotik had no physical ports at all, and the port on the switch received traffic from the entire host, on which, besides Mikrotik, there were several other virtual machines.
And then I once again mentally said: "Thank you, Mikrotik!". Thanks for the sniffer built into RouterOS. By tradition, we manage without screenshots, only console commands.
Open the terminal in WinBox and turn on the sniffer:
/tool sniffer set filter-interface=if-out filter-stream=yes streaming-enabled=yes streaming-server=192.168.1.253

/tool sniffer start
the name of the interface from which you intend to intercept traffic, and instead of 192.168.1.253 , the IP address of the machine to which the intercepted traffic will be sent via the TZSP protocol .
With Mikrotik'om everything.
Suricata
In general, I am not very Linux-headed, so I like pop distros most of all. Well, except that I like the more ascetic Debian more. That started with him. Well, of course, by virtue of non-linear headaches, I wanted to put the binaries from the repository as well. Build is always lazy for me. So, if it is possible to choose Debian, do not choose . Now I don’t remember exactly where I had a plug in the installation of the entire farm under Debian, but it was. And the whole further story about installing everything under Ubunta.
A 4-core virtual machine with 4 gigs of RAM was created, Ubuntu Server 18.04.1 LTS (x64) was downloaded and installed on it
Agreement : all further actions are performed on behalf of the superuser, so either log in as root, or add sudo to each command .
Since at each stage I made snapshots, and then repeatedly rolled back to them, at the end I lit up pretty glitches with the time sync in a virtual machine with real time.
Therefore, we immediately set the correct time zone and NTP synchronization: In order to have no problems with dependencies during the installation of Suricata, we add the universe repositories in /etc/apt/sources.list :
systemctl start systemd-timesyncd

systemctl status systemd-timesyncd

dpkg-reconfigure tzdata
nano /etc/apt/sources.list...
deb archive.ubuntu.com/ubuntu bionic main universe
deb to archive.ubuntu.com/ubuntu bionic-security main universe
deb archive.ubuntu.com/ubuntu bionic-updates main universe
We also add a repository, from where we will take Suricata:
add-apt-repository ppa:oisf/suricata-stableUpdate the package database:
apt-get updateInstall Suricata:
apt-get install -y suricataThe next step is to install the rules for Suricata and their update : Start the update itself suricata-update : Running without additional configuration will give us Emerging Threats Open ruleset: To see a list of sources , execute: Updating the sources of the rules: Let's see what has been updated there in the sources, we will execute it again: We include all free sources: And once again we update the rules: Suricata is installed. Now you need to get traffic.
apt-get install -y python-pip

pip install pyyaml

pip install https://github.com/OISF/suricata-update/archive/master.zip
pip install --pre --upgrade suricata-updatesuricata-updatesuricata-update list-sourcessuricata-update update-sourcessuricata-update list-sourcessuricata-update enable-source ptresearch/attackdetection
suricata-update enable-source oisf/trafficid
suricata-update enable-source sslbl/ssl-fp-blacklistsuricata-updateTrafr
Trafr is an application written by Mikrotik to convert TZSP traffic to pcap. The application is 32-bit, so to start it you will need to enable support for 32-bit applications in 64-bit Ubunta: Download and unpack trafr : Check that traffic is caught: I had a symbolic output in graphical mode in the virtual machine console after such launch reboot. When connecting remotely via ssh to PuTTY, there were no problems. If you see random flickering on the screen, then the traffic arrives, and trafr catches it. If so, we transfer the trafr to the permanent residence and start it with the transfer of the caught traffic through the pipeline immediately to Suricata:
dpkg --add-architecture i386

apt-get update && apt-get install -y libc6:i386
wget http://www.mikrotik.com/download/trafr.tgz
tar xzf trafr.tgz./trafr -smv trafr /usr/local/bin/
/usr/local/bin/trafr -s | suricata -c /etc/suricata/suricata.yaml -r /dev/stdin
Now we check that the traffic arrives in Suricata, for this we perform in the next terminal: You
tail -f /var/log/suricata/fast.logshould see a smart scrolling of meaningful text - a log for receiving traffic of meerkaty.
It is also useful to make sure that Suricata not only receives traffic, but also analyzes:
tail -f /var/log/suricata/eve.jsonThis is the very output of events from Suricata in JSON format that we will feed to Filebeat.
Elasticsearch + Filebeat + Kibana 6.5
Install the PGP key required to use the Elastic repository and install the necessary dependencies: Please note that Java version 8. Everything above 8 is not supported. Therefore, if you have previously managed to install more recent Java, demolish it and put 8. Make sure that Java is installed as it should: We get something like this output:
wget -qO - https://artifacts.elastic.co/GPG-KEY-elasticsearch | sudo apt-key add -

echo "deb https://artifacts.elastic.co/packages/6.x/apt stable main" | sudo tee -a /etc/apt/sources.list.d/elastic-6.x.list

apt-get update && apt-get install -y openjdk-8-jre apt-transport-https wget nginx
java -versionjava version "1.8.0_191"
Java (TM) SE Runtime Environment (build 1.8.0_191-b12)
Java HotSpot (TM) 64-Bit Server VM (build 25.191-b12, mixed mode)
Create a username and password to access Kibana. Instead of admin, select something that suits your taste:
echo "admin:`openssl passwd -apr1`" | sudo tee -a /etc/nginx/htpasswd.usersSince ELK will run on localhost, configure the reverse proxy in nginx:
nano /etc/nginx/sites-available/kibanaserver {
listen 80;
server_name suricata.server;
auth_basic "Restricted Access";
auth_basic_user_file /etc/nginx/htpasswd.users;
location / {
proxy_pass localhost : 5601;
proxy_http_version 1.1;
proxy_set_header Upgrade $ http_upgrade;
proxy_set_header Connection 'upgrade';
proxy_set_header Host $ host;
proxy_cache_bypass $ http_upgrade;
}
}
rm /etc/nginx/sites-enabled/default

ln -s /etc/nginx/sites-available/kibana /etc/nginx/sites-enabled/kibana
Restart nginx:
systemctl restart nginxPut Elasticsearch:
apt-get install -y elasticsearchTurn on autorun when booting the OS: Run: Check if the hardware has risen: Depending on the performance of your piece of hardware, it may take some time to start the ES. If we get connection refused , then just repeat the request and wait until we get something like a response:
systemctl daemon-reload

systemctl enable elasticsearch.service
systemctl start elasticsearch.servicecurl -X GET "localhost:9200/"{
"Name": "lcZuxxm",
"cluster_name": "elasticsearch",
"cluster_uuid": "kmJHqJnlQe2Rk7F-CRi4EA",
"version": {
"number": "6.5.1",
"build_flavor": "default",
“Build_type”: “deb”,
“build_hash”: “8c58350”,
“build_date”: “2018-11-16T02: 22: 42.182257Z”,
“build_snapshot”: false,
“lucene_version”: “7.5.0”,
“ minimum_wire_compatibility_version ":" 5.6.0 ",
" minimum_index_compatibility_version ":" 5.0.0 "
},
" tagline ":" You Know, for Search "
}
Put Kibana: Enable
apt-get install -y kibanaautorun when booting the OS: Start: Now you can go to 192.168.1.253 (of course, the IP address is the one that was assigned to your car with meerkat). The Kibana title page should open. Put the Filebeat: Enable autorun when booting the OS: Enable the Suricata module included in the Filebeat module set: Install the Suricata plugins in Elasticsearch: See UPD on May 22, 2019. Restarting Elasticsearch: Perform the initial Filebeat configuration, at the same time loading the templates in Kibana: Check that Filebeat found /var/log/suricata/eve.json
systemctl daemon-reload

systemctl enable kibana.service
systemctl start kibana.serviceapt-get install -y filebeatsystemctl daemon-reload
systemctl enable filebeatfilebeat modules enable suricata/usr/share/elasticsearch/bin/elasticsearch-plugin install ingest-geoip
/usr/share/elasticsearch/bin/elasticsearch-plugin install ingest-user-agentsystemctl restart elasticsearch.servicefilebeat setup -eand processes it, to do this, run Filebeat in a mode of displaying data with a publish marker :
filebeat -e -d "publish"The first is the json-formatted output of Filebeat itself, then the simple text output of its logs, and only after some time the output from Suricata, so wait and see that everything works. After that, interrupt Filebeat and return to bash.
Enable autorun when booting the OS: Start Filebeat: Go to Kibana, select Dashboard from the menu on the left, select the filebeat- * index . Again choose Dashboard, select [Suricata] Alert Overview from the list and should get something like this:
systemctl daemon-reload

systemctl enable filebeat.servicesystemctl start filebeat.serviceOptional
Do not forget the logrotate, and not that no matter how capacious the hard drive, Suricata will score it very quickly:
nano /etc/logrotate.d/suricata/var/log/suricata/*.log /var/log/suricata/*.json
{
weekly
rotate 3
missingok
nocompress
create
sharedscripts
postrotate
/ bin / kill -HUP `cat /var/run/suricata.pid 2> / dev / null` 2> / dev / null || true
endscript
}
In addition, there were rumors that someone regularly has a sniffer in Mikrotik with the status of running and stops sending traffic. Then we write a script to restart the sniffer and run it on a schedule:
/tool sniffer stop

:delay 30s

/tool sniffer start
Conclusion
Frankly, I'm not quite happy with the stability of the above bundle. Namely: it is worth rebooting, and miracles begin. Once I stopped processing all the rules except the pair. I had to reinstall everything. The second time Elasticsearch stopped receiving data from Filebeat at all, and had to roll back to the snapshot state before rebooting.
These problems have not yet decided.
In addition, plans to implement IPS on the basis of IP-addresses of villains identified by Suricata transferred to Mikrotik.
UPD: Accusations of instability are cleared. My conclusion about stopping rule processing was wrong. In fact, the reason for the emptiness in Dashboard after a reboot is due to the fact that Filebeat and Elasticsearch take quite a lot of time to parse a multi-gigabyte json file from meerkats. If you open the Dashboard with events for the period, which includes the date of creation of the eve.json file , you can see how the columns of the chart grow as the file is processed. Along with the processed events, there are also alerts in the corresponding Dashboard. In addition, the sniffer in RouterOS on x86 did not hang even once.
UPD dated May 22, 2019 : Starting with Elasticsearch 6.7, the ingest-geoip and ingest-user-agent plugins are converted to modules. Accordingly, the item with their installation is skipped.
Also, when updating, get the Elasticsearch launch error. You will see an error in the logs:
expected database [GeoLite2-ASN.mmdb] to not exist in [/ etc / elasticsearch / ingest-geoip]
To restore performance perform:
/usr/share/elasticsearch/bin/elasticsearch-plugin remove --purge ingest-geoip