Simulation theory: the interrelation of quantum-chemical calculations and reality
Introduction
What is this text about
If a person hears about "reality simulation", then in the most likely he will come up with various sci-fi works (such as The Matrix, the Dark City, or the Zero Theorem), or computer games. In the case of people whose heads are littered with engineering education, packages like
But there is one more level of Reality, which will be undeservedly forgotten: the one on which all chemistry takes place is the level of atoms and molecules. It can also be quite successfully simulated on a computer. Since quantum mechanics is in charge of everything in this slice of Reality, such calculations are often called quantum chemistry. And here we will talk about its connection with the Reality studied by experimental methods.
This text will be about the most elementary things. But, the practice of reading scientific journals and listening to various reports shows that this must be constantly reminded.
The text is intended for people who understand and / or are interested in how atoms and molecules live.
Taken from xkcd.com
Brief background
Так случилось, что собрат по несчастью работы в российской науке предложил мне прочитать лекцию на своём спецкурсе для 2-х человек в одном из известных физических ВУЗов России. Но, по странному стечению обстоятельств её перенесли на проходившую параллельно студенческую конференцию… Там она особого интереса у студентов она не вызвала, а материал мне было очень-очень жалко, поэтому решил немного заспамить Хабр, попробовав превратить учебную лекцию в научно-популярную статью.
Physical methods for studying the life of molecules
We know from school courses in chemistry and physics that all substances consist of atoms, molecules, ions, or their combinations. And we, it seems, even know what kind of life they live. But this information should have its own reliable sources (research methods), and they really do exist.
There are very many such ways to spy on the life of atoms. Those who wish, for example, can familiarize themselves with some of them in more detail in classical textbooks
- Pentin Yu.A., Vilkov L.V. Physical research methods in chemistry. - M .: Mir, 2006,
- R. Drago. Physical methods in chemistry. - M .: Mir, 1981.
But, 3 main groups of methods stand out roughly and fairly easily:
- spectroscopic methods
- diffraction methods
- various methods of microscopy (not important, transmission or scanning, for us it is not essential now).
About the last speech will not be, but its tools are no less important than the first two.
Why not talk about microscopy
(просто я в микроскопии не шарю от слова совсем)
Spectroscopic methods for studying substances
This powerful group of methods provides us with very, very many: from finding and determining molecules in the interstellar medium and on other planets to the banal check for explosives at the airport.
The general principle of the spectral methods
When talking about spectroscopy, usually refers to the following general principle of operation.
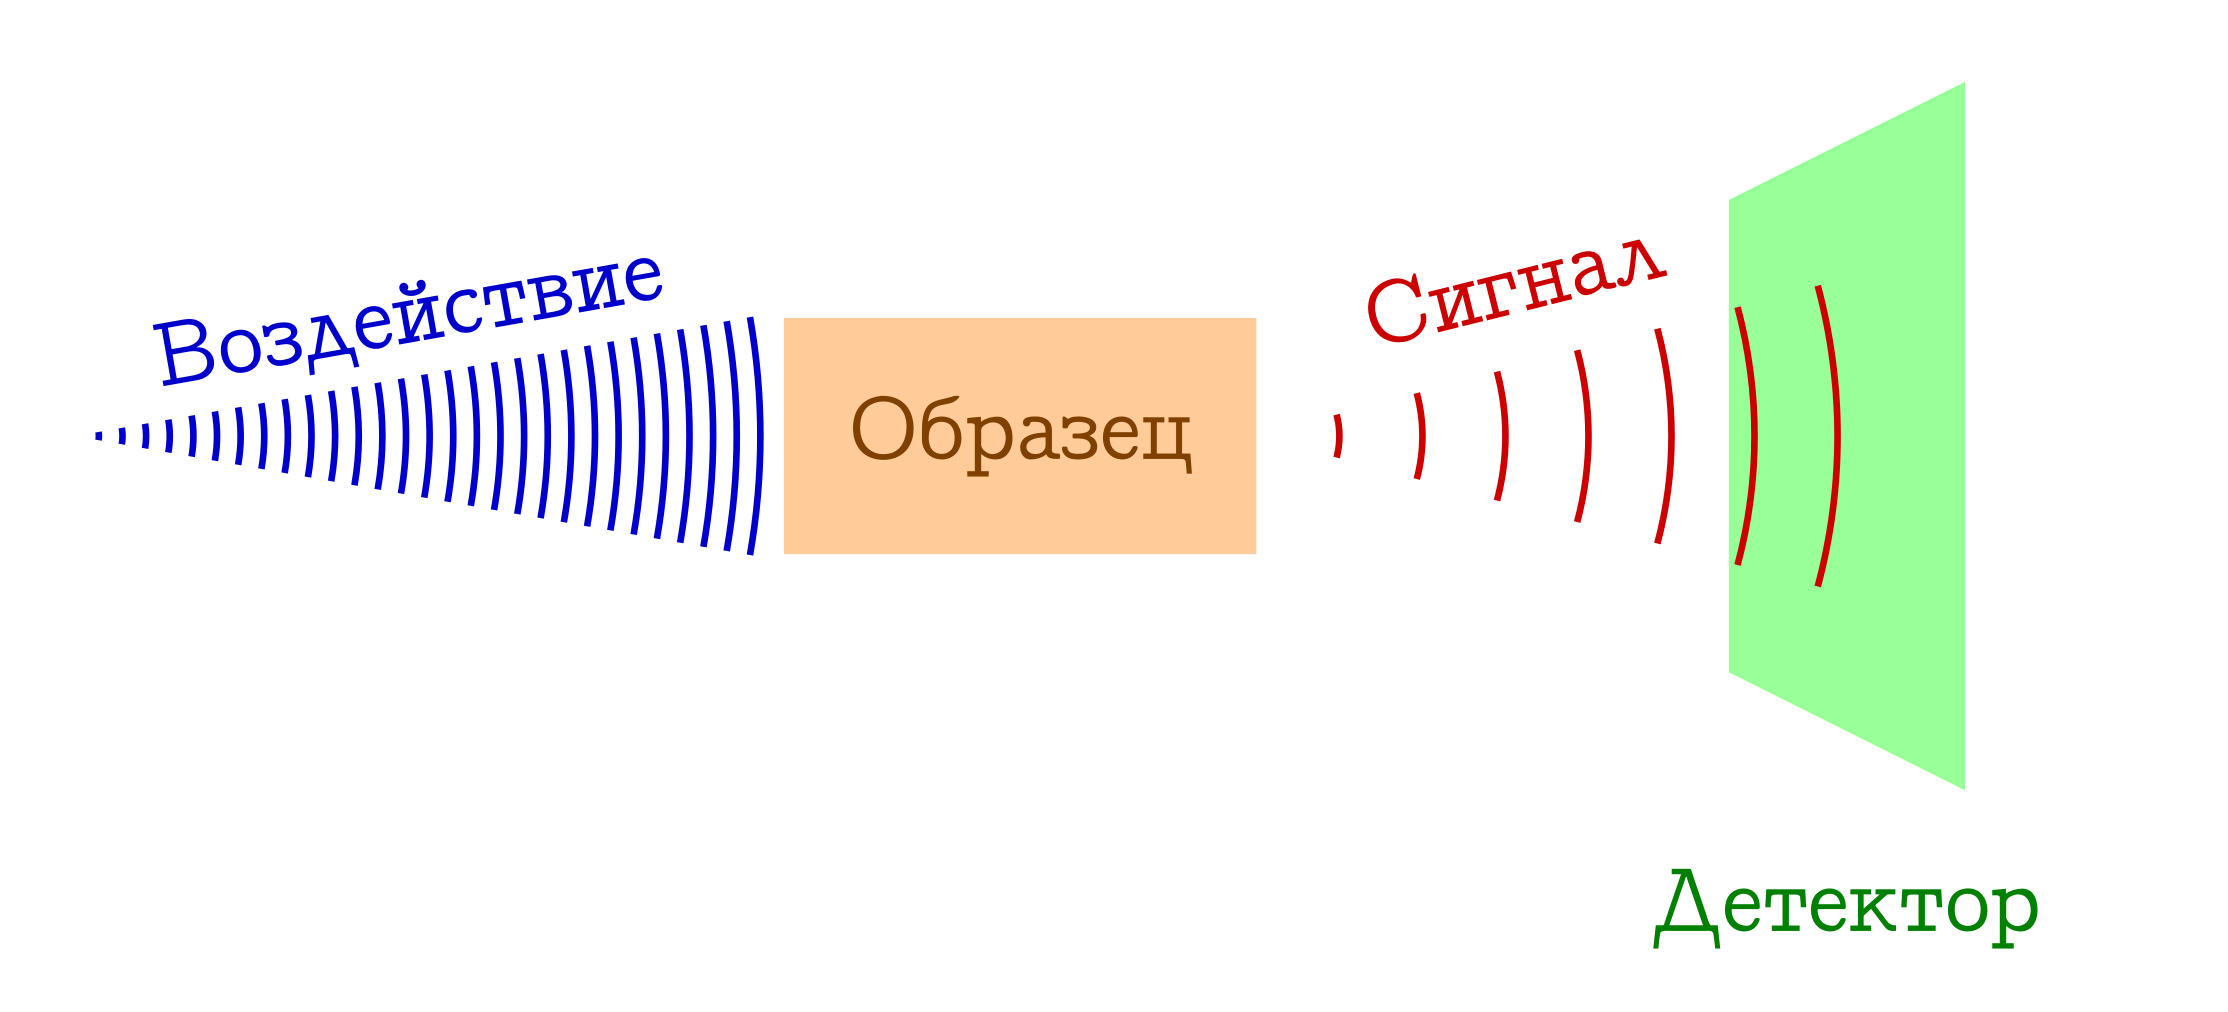
General scheme of spectral methods for the study of substances
- We have something that we (for example, a light bulb / laser / sunlight) affect the sample of interest. Most often it is an electromagnetic study, but this may well be electrons (for example, in mass spectroscopy with electron impact ionization) or a cocktail of everything possible and impossible from plasma (for example, in flame spectroscopy , so beloved by schoolchildren and junior students of himfakov). Somehow, something must work on our sample.
- When a sample is exposed to something, something happens that changes its state. This may be a transition to some excited level (in any spectrophotometry or Raman spectroscopy), or even the collapse of the molecular system (as in mass spectra or photoelectron spectroscopy ). But one way or another, the sample at some point should be different.
- ???
- PROFIT !!! We register a certain signal (emitted or absorbed) during this change of the sample at the molecular level. These can be lost photons spent on changing a sample (then we have absorption spectroscopy), or vice versa, extra photons emitted after preliminary excitation of a substance (emission spectroscopy), a change in the wavelength of original photons as a result of interaction with a substance (Raman spectroscopy, more known abroad as a
ramenovskayaframes and Novskaya ), well or blunt fragments of the original molecules (in mass spectra or photoelectron spektrskopii ). There are many options - the essence is the same: there is a signal!
An example of such methods is a bunch of different little letters: NMR, ESR, MW, THz, IR, UV / Vis, XRF, MS, PES, EXAFS, XANES, etc. etc.
All (or many of them) are familiar (or should be familiar) to every chemist. All of these methods are a (far from complete) standard arsenal of a self-respecting researcher dealing with substances.
Spectral ranges and their relationship with the life of molecules
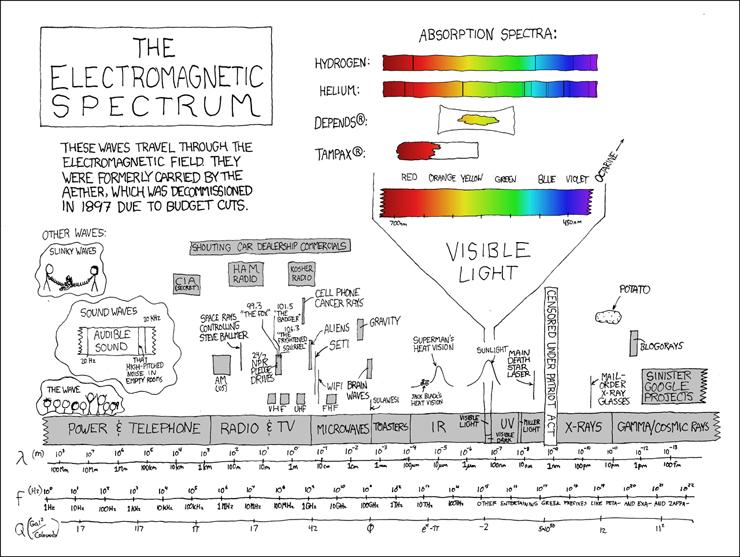
Taken from xkcd.com.
Since in the overwhelming number of cases spectroscopy is still tied to electromagnetic radiation, it is logical to link the ranges of the electromagnetic spectrum to various aspects of atomic-molecular life. After all, the frequency of electromagnetic waves used in spectroscopy is a kind of “clock” that allows you to detect how long a given process lasts in molecular systems. So, by changing this frequency, one can study (and even influence) various molecular processes.
So.
- From the chemical point of view, nothing interesting is happening in the superlong wavelength range, so you can ignore it.
- With the frequency of radio and microwaves (and even long-wave infrared radiation, IR = IR), different molecules rotate in the gas phase: large and heavy - in the region of radio waves (lower frequencies), and small and light - in IR (higher frequencies).
- In the IC, however, (mainly) various oscillations of molecules occur: all conformational and other non-obvious movements inside the molecules occur in the long-wave IR, and stretching vibrations (stretchings - shortenings of chemical bonds) occur in the short-wave (up to 4000 cm –1 ).
- Well, then comes the place of the spectrum, where different electronic transitions live (up to the area of γ-quanta). At lower frequencies (visible, UV = UV and soft X-rays), there are mainly transitions associated with valence electrons.Why do we see?Кстати, именно, из-за электронных переходов мы и можем видеть: в наших глазах (в колбочках) содержатся структуры, имеющие в составе ретиналь. При поглощении фотона видимого цвета этой молекулой, в ней происходит разрыв двойной связи, что приводит к цис-транс изомеризации. И именно это изменение воспринимается нами как первичный сигнал, который далее передаётся в наш мозг.
But with increasing photon energy (i.e. with increasing frequency, as we remember from the Planck formula ) we get to deeper and deeper layers of the electronic structure, until we rest in the X-ray range to the final 1s-shells ( or, what their names are X-ray, K ).
So, choosing the correct wavelength of electromagnetic radiation, we can look more closely at a particular process in the molecules.
Diffraction methods for the study of matter
Now let's talk a little about diffraction. The basic scheme of such experiments is also simple.
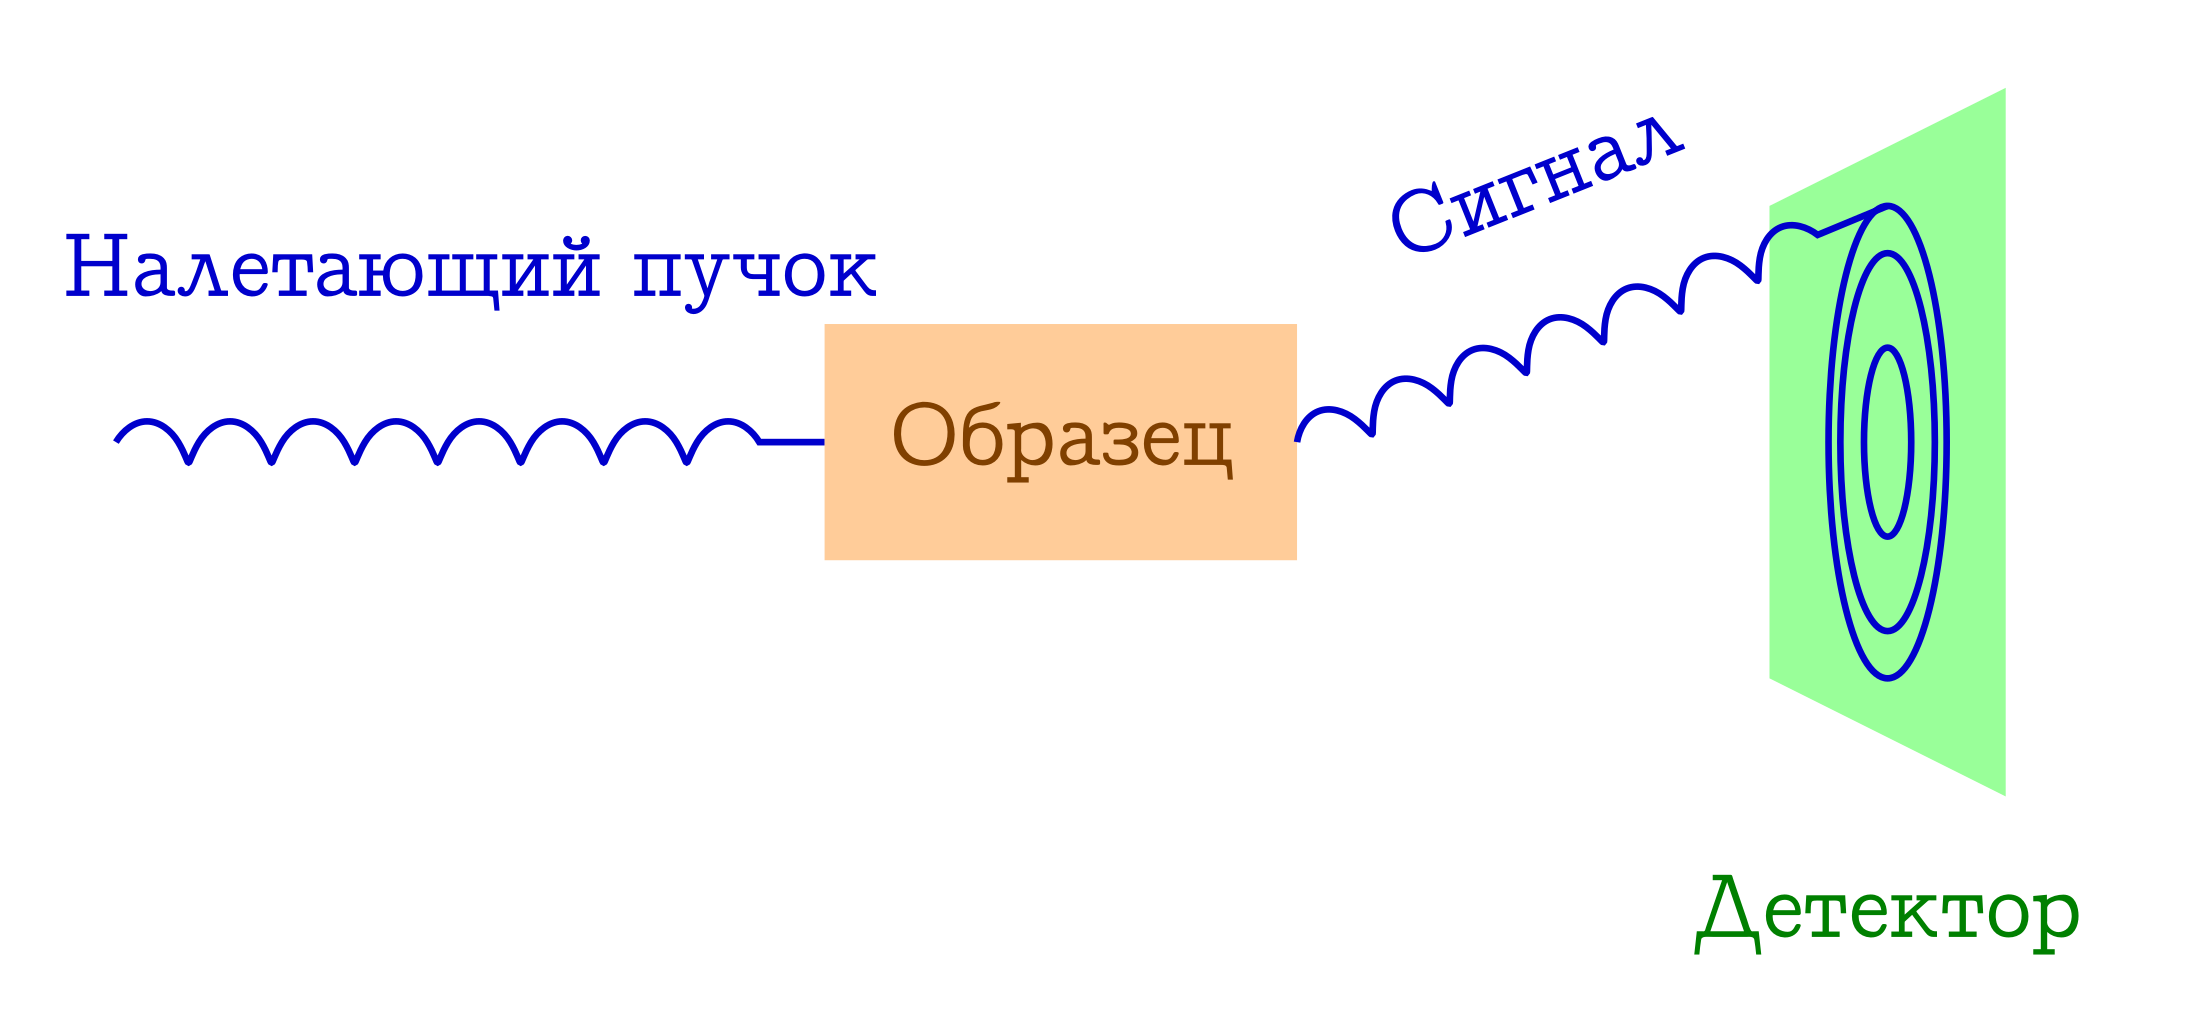
General scheme of diffraction methods for the study of substances
- A bunch of particles fly over the sample. Most often it is either x-ray photons, or electrons, or neutrons.
- These particles, by different mechanisms, are elastically scattered on atoms in the sample of interest to us (that is, without changing the length and phase of the wave, they simply change the direction of their flight). Nothing happens to the sample from these flown particles: it simply does not have time to react to them.
- Interatomic distances serve as a diffraction lattice for the incident beam, therefore as a result we will see a beautiful diffraction image on the detector.
From the last point, a condition appears on the wavelength of the incident particles (λ): it must be of the same order or less than the characteristic order of interatomic distances, therefore the typical λ for these methods is 1-0.01 Å.
The main types of errors when comparing experiments and theoretical calculations
As a result, we have a very interesting picture: in spectroscopy and diffraction, we observe some kind of left signal, which somehow indirectly indicates what is actually happening in the molecular system.
Analogy with Plato's cave
Картина эта до жути напоминает миф о пещере Платона. У нас есть некий Реальный Мир Молекул. Но мы видим только лишь тени от него на стенке пещеры (детекторе), которые являются неполным отображением всех интересных вещей, происходящих на этом уровне Реальности.
But, fortunately, sometimes we can theoretically calculate the signal of interest to us (as, for example, in microwave, IR or UV / Vis spectroscopy), and sometimes we can extract from the observed signal the quantities of interest that are available for quantum-chemical calculation (for example, distances between atoms in a molecule, dipole moment, etc.). And here we have a chance that a numerical and a real experiment can unite in a passionate stage of comparison with each other ... and here 4 types of errors can occur as standard.
Attention! The term “error” here does not mean that the result of the comparison is obviously wrong. It’s just that the ground for comparison becomes very unsteady and swampy, and one sloppy step can easily mess up all the work.
- Different conditions of the experiment and / or calculation (state of aggregation, temperature, pressure, etc.). We can suddenly begin to compare different systems with each other, for some reason considering them to be the same. For example, it is obvious that adding one or five teaspoons of sugar to a cup of tea will result in the same physical system called “tea with sugar”, but the properties of this system will be very different. And it can be easily measured. For example, with a thermometer (measuring the temperature of tea immediately after sugar dissolving) or with a tongue (one of the so-called organoleptic methods of analysis). So comparing the resulting systems with each other (whether it is a real cup of sugar with tea, or its computer model), we must not forget that the similarity has its limits, and that if we reduce the allowable error for "similarity", then we will eventually find differences.
- Different physical and / or mathematical meaning of the parameters (the parameter of the physical meaning in the usual sense may not be at all). Here, too, everything is simple: if we compare 2 quantities with a similar name, this does not mean that the quantities have the same physical meaning. For example, the rating of the deputy among the entire population of the city vs. rating only among grannies. Both that rating (whatever it is), these numbers (or that it is there) can even correlate strongly between themselves, but the meaning of these parameters is still different, and this difference can be detected.
- "Random" errors . This refers to some systematic errors that are not known to the experimenter / theorist-simulator, or indeed random errors in the experiment / calculation, which cannot be controlled and / or predicted. In principle, such things can themselves become the subject of research of various interesting systematic effects.An example of such researchНапример, есть история с непонятными сигналами на радиотелескопеСпойлер
убийца — микроволновка
которые оказались следствием слишком рано открываемой микроволновки
or just an estimate of the most useful S / N ratio (“signal / noise”). - And the last standard error is the growth of the hands of the experimenter / pelvic calculator , that is, ordinary human errors. Here it is not necessary to investigate anything, it is enough to double-check the work or repeat the experiment made in order to detect and eliminate the corresponding joint.
Nothing more specific can be said about the last two types of errors, but about the first two, and if you take a specific research method, you can tell a lot of things. Therefore, we concentrate on them. The main focus here will be on the structural differences of molecules.
Error # 1. Differences of molecular properties in different conditions
NaCl: when errors do not occur
For some reason, it does not occur to anyone to say that a single crystal of sodium chloride (NaCl), which is a huge molecule of Na + and Cl - ions , and a diatomic NaCl molecule, produced by evaporation of this crystal at rabid temperatures, is one let's say a structure.
And even if we assume that at least the distance between chlorine and sodium ( r NaCl ) is the same here and there, the experiment will put us in place:
Where do we make a mistake
На самом деле при таком сравнении мы допускаем возможность Ошибки #2, но тут всё нормально, если мы оценим погрешности подобного сравнения, то они будут порядка 0.01 Å, что существенно меньше разности сравниваемых параметров. Т.е. это не погрешность, а реальный эффект.
- in a diatomic molecule, this value is r NaCl = 2.36 Å ,
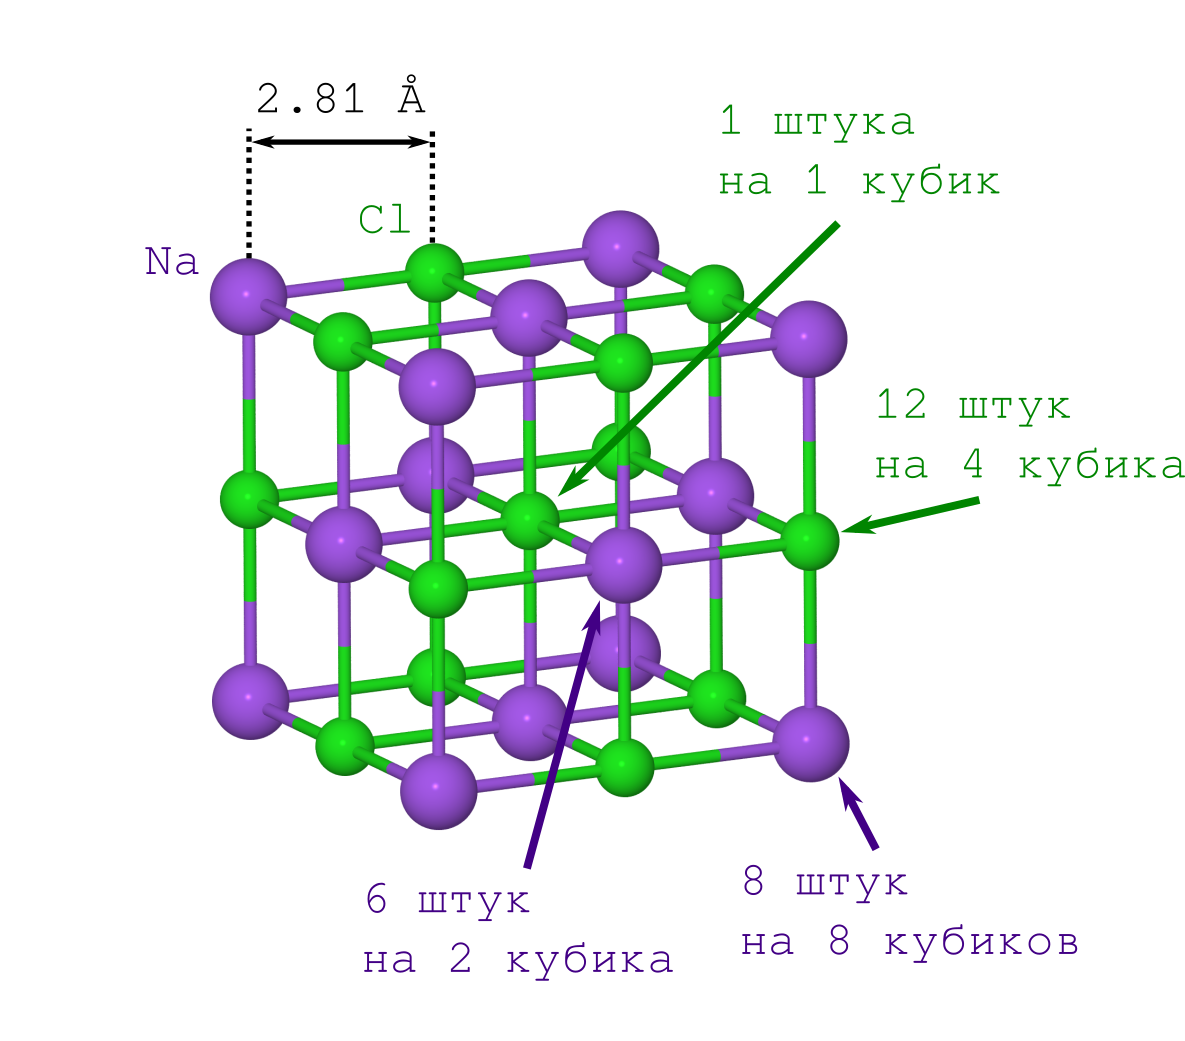
- and in the crystal, a similar value will be r NaCl = 2.81 Å.
How to get the distance between the sodium cation and the chlorine anion in the salt crystal
Получение расстояния между атомами в двухатомной молекуле NaCl из экспериментальных данных тоже не такая уж и сложная процедура. Но проблема заключается только в том, что подобный эксперимент — штука сложная. Поэтому проще воспользоваться базой данных, где уже приведены нужные расстояния.
Но для получения расстояния между атомами в кристалле достаточно только плотности кристаллика поваренной соли ρ=2.165 г/см3, которую можно как легко достать из Википедии, так и померить самому в домашних условиях.
Для вычисления расстояния нам понадобится:
Если бы делали это впервые (скажем, в начале XX века), то пришлось бы помучиться со вторым пунктом. Но современным людям это уже и так известно: решётка NaCl имеет форму кубика, в котором чередуются между собой ионы Na+ и Cl– (см. картинку выше). Размножая указанный фрагмент кристалла («копипастя» указанный кусок и прилаживая его к предыдущей итерации грань к грани), мы получим кристалл NaCl любого желаемого размера и любой желаемой (майнкрафтовой) формы.
А значит плотность этого кубика должна быть такой же, что и у всего кристалла. Учитывая, что плотность это (т.е. масса на объём), то получается, что зная массу и геометрическое выражение для объёма мы можем посчитать и расстояние между атомами.
Объём кубика очевиден: длина ребра составляет удвоенное расстояние Na--Cl (), а значит искомый объём равен .
С массой же не так всё просто. Большинство атомов у нас лежат на вершинах, рёбрах и гранях кубика, а значит одновременно принадлежат нескольким из этих кубиков. Это надо учесть при вычислениях.
Начнём учёт с ионов Na+. Их у нас всего 2 типа (см. рисунок решётки кристалла):
В итоге получаем, что в нашем кубе содержатся иона натрия.
Теперь о Cl–. Их тоже всего 2 типа (см. рисунок решётки кристалла):
Поэтому нашем кубе содержатся иона хлора.
Состав кристалла, очевидно, соответствует химической формуле NaCl, но масса нашего кубика оказывается равна (не забываем, что массы атомов в таблице Менделеева даются в атомных единицах массы):
Теперь же из соотношения мы можем составить уравнение на длину :
,
которое легко решается:
.
От данных из рентгеновской кристаллографии 2.81 Å (например из Abrahams, S.C.;Bernstein, J.L. Accuracy of an automatic diffractometer. Measurement of the sodium chloride structure factors // Acta Crystallographica (1965) 18, 926-932) мы промазали всего на 0.01 Å, что достаточно круто.
Но для получения расстояния между атомами в кристалле достаточно только плотности кристаллика поваренной соли ρ=2.165 г/см3, которую можно как легко достать из Википедии, так и померить самому в домашних условиях.
Для вычисления расстояния нам понадобится:
- плотность кристалла NaCl (есть),
- знание расположения ионов этого кристалла.
Если бы делали это впервые (скажем, в начале XX века), то пришлось бы помучиться со вторым пунктом. Но современным людям это уже и так известно: решётка NaCl имеет форму кубика, в котором чередуются между собой ионы Na+ и Cl– (см. картинку выше). Размножая указанный фрагмент кристалла («копипастя» указанный кусок и прилаживая его к предыдущей итерации грань к грани), мы получим кристалл NaCl любого желаемого размера и любой желаемой (майнкрафтовой) формы.
А значит плотность этого кубика должна быть такой же, что и у всего кристалла. Учитывая, что плотность это (т.е. масса на объём), то получается, что зная массу и геометрическое выражение для объёма мы можем посчитать и расстояние между атомами.
Объём кубика очевиден: длина ребра составляет удвоенное расстояние Na--Cl (), а значит искомый объём равен .
С массой же не так всё просто. Большинство атомов у нас лежат на вершинах, рёбрах и гранях кубика, а значит одновременно принадлежат нескольким из этих кубиков. Это надо учесть при вычислениях.
Начнём учёт с ионов Na+. Их у нас всего 2 типа (см. рисунок решётки кристалла):
- те, что лежат в вершинах куба (их столько же, сколько и вершин куба, т.е. 8, и они одновременно лежат в 8 кубиках, поэтому надо будет делить это число на 8),
- те, что лежат на гранях (их 6 штук, и они одновременно принадлежат 2-м кубикам).
В итоге получаем, что в нашем кубе содержатся иона натрия.
Теперь о Cl–. Их тоже всего 2 типа (см. рисунок решётки кристалла):
- те, что лежат на рёбрах куба (их 12 штук, и они находятся в совместном владении у 4-х кубиков),
- тот Cl–, что в центре куба, он один и принадлежит только нашему кубику.
Поэтому нашем кубе содержатся иона хлора.
Состав кристалла, очевидно, соответствует химической формуле NaCl, но масса нашего кубика оказывается равна (не забываем, что массы атомов в таблице Менделеева даются в атомных единицах массы):
Теперь же из соотношения мы можем составить уравнение на длину :
,
которое легко решается:
.
От данных из рентгеновской кристаллографии 2.81 Å (например из Abrahams, S.C.;Bernstein, J.L. Accuracy of an automatic diffractometer. Measurement of the sodium chloride structure factors // Acta Crystallographica (1965) 18, 926-932) мы промазали всего на 0.01 Å, что достаточно круто.
Someone might think that the difference of 0.45 Å is insignificant, but it is almost the Bohr radius (0.52 Å), which is equal to the most probable distance of an electron, and by atomic standards the difference is huge.
Why NaCl in the form of a 2-atomic molecule is different from a crystal
Тут всё очень просто. Бесконечная решётка кристалла создаёт возможность необратимого «перепрыгивания» для 3s1 электрона натрия на атом хлора, поскольку получившаяся разность зарядов компенсируется взаимодействием с соседями.
В двухатомной молекуле 3s1 электрон натрия тоже хочет перепрыгнуть на атом хлора (ведь у них большая разность электроотрицательностей), но получающаяся разность зарядов тянет электрон обратно на натрий, в результате устанавливается «равновесие» между двумя резонансными структурами:
с ковалентной связью (слева) и ионной (справа), причём вторая более выражена.
Этот эффект можно измерить, поскольку реальный заряд на атомах будет не , как мы привыкли в школе, а нечто меньшее по модулю.
У молекулы NaCl в газовой фазе известны и расстояние между атомами (2.36 Å), и дипольный момент, где и есть искомый модуль зарядов атомов (у натрия заряд будет , а у хлора ). Дебай для нас не очень удобен, поэтому перейдём к единицам «заряд электрона на ангстрем» при помощи множителя 0.21, т.е. , и в результате решения простейшего уравнения получим: . Вот эти «убежавшие» 0.2 заряда электрона и создают разницу между кристаллом NaCl и молекулой NaCl в газовой фазе.
Ferrocene
It is necessary to move from ionic to molecular crystals, in which molecules are tightly packed, so it becomes suddenly possible to compare, without any reservations.
But the difference should not be forgotten. And on this subject there is even a classic example: the ferrocene molecule .
This is the simplest sandwich mix. In it, a neutral iron atom (like a chop) is sandwiched between two five-membered aromatic rings (buns).
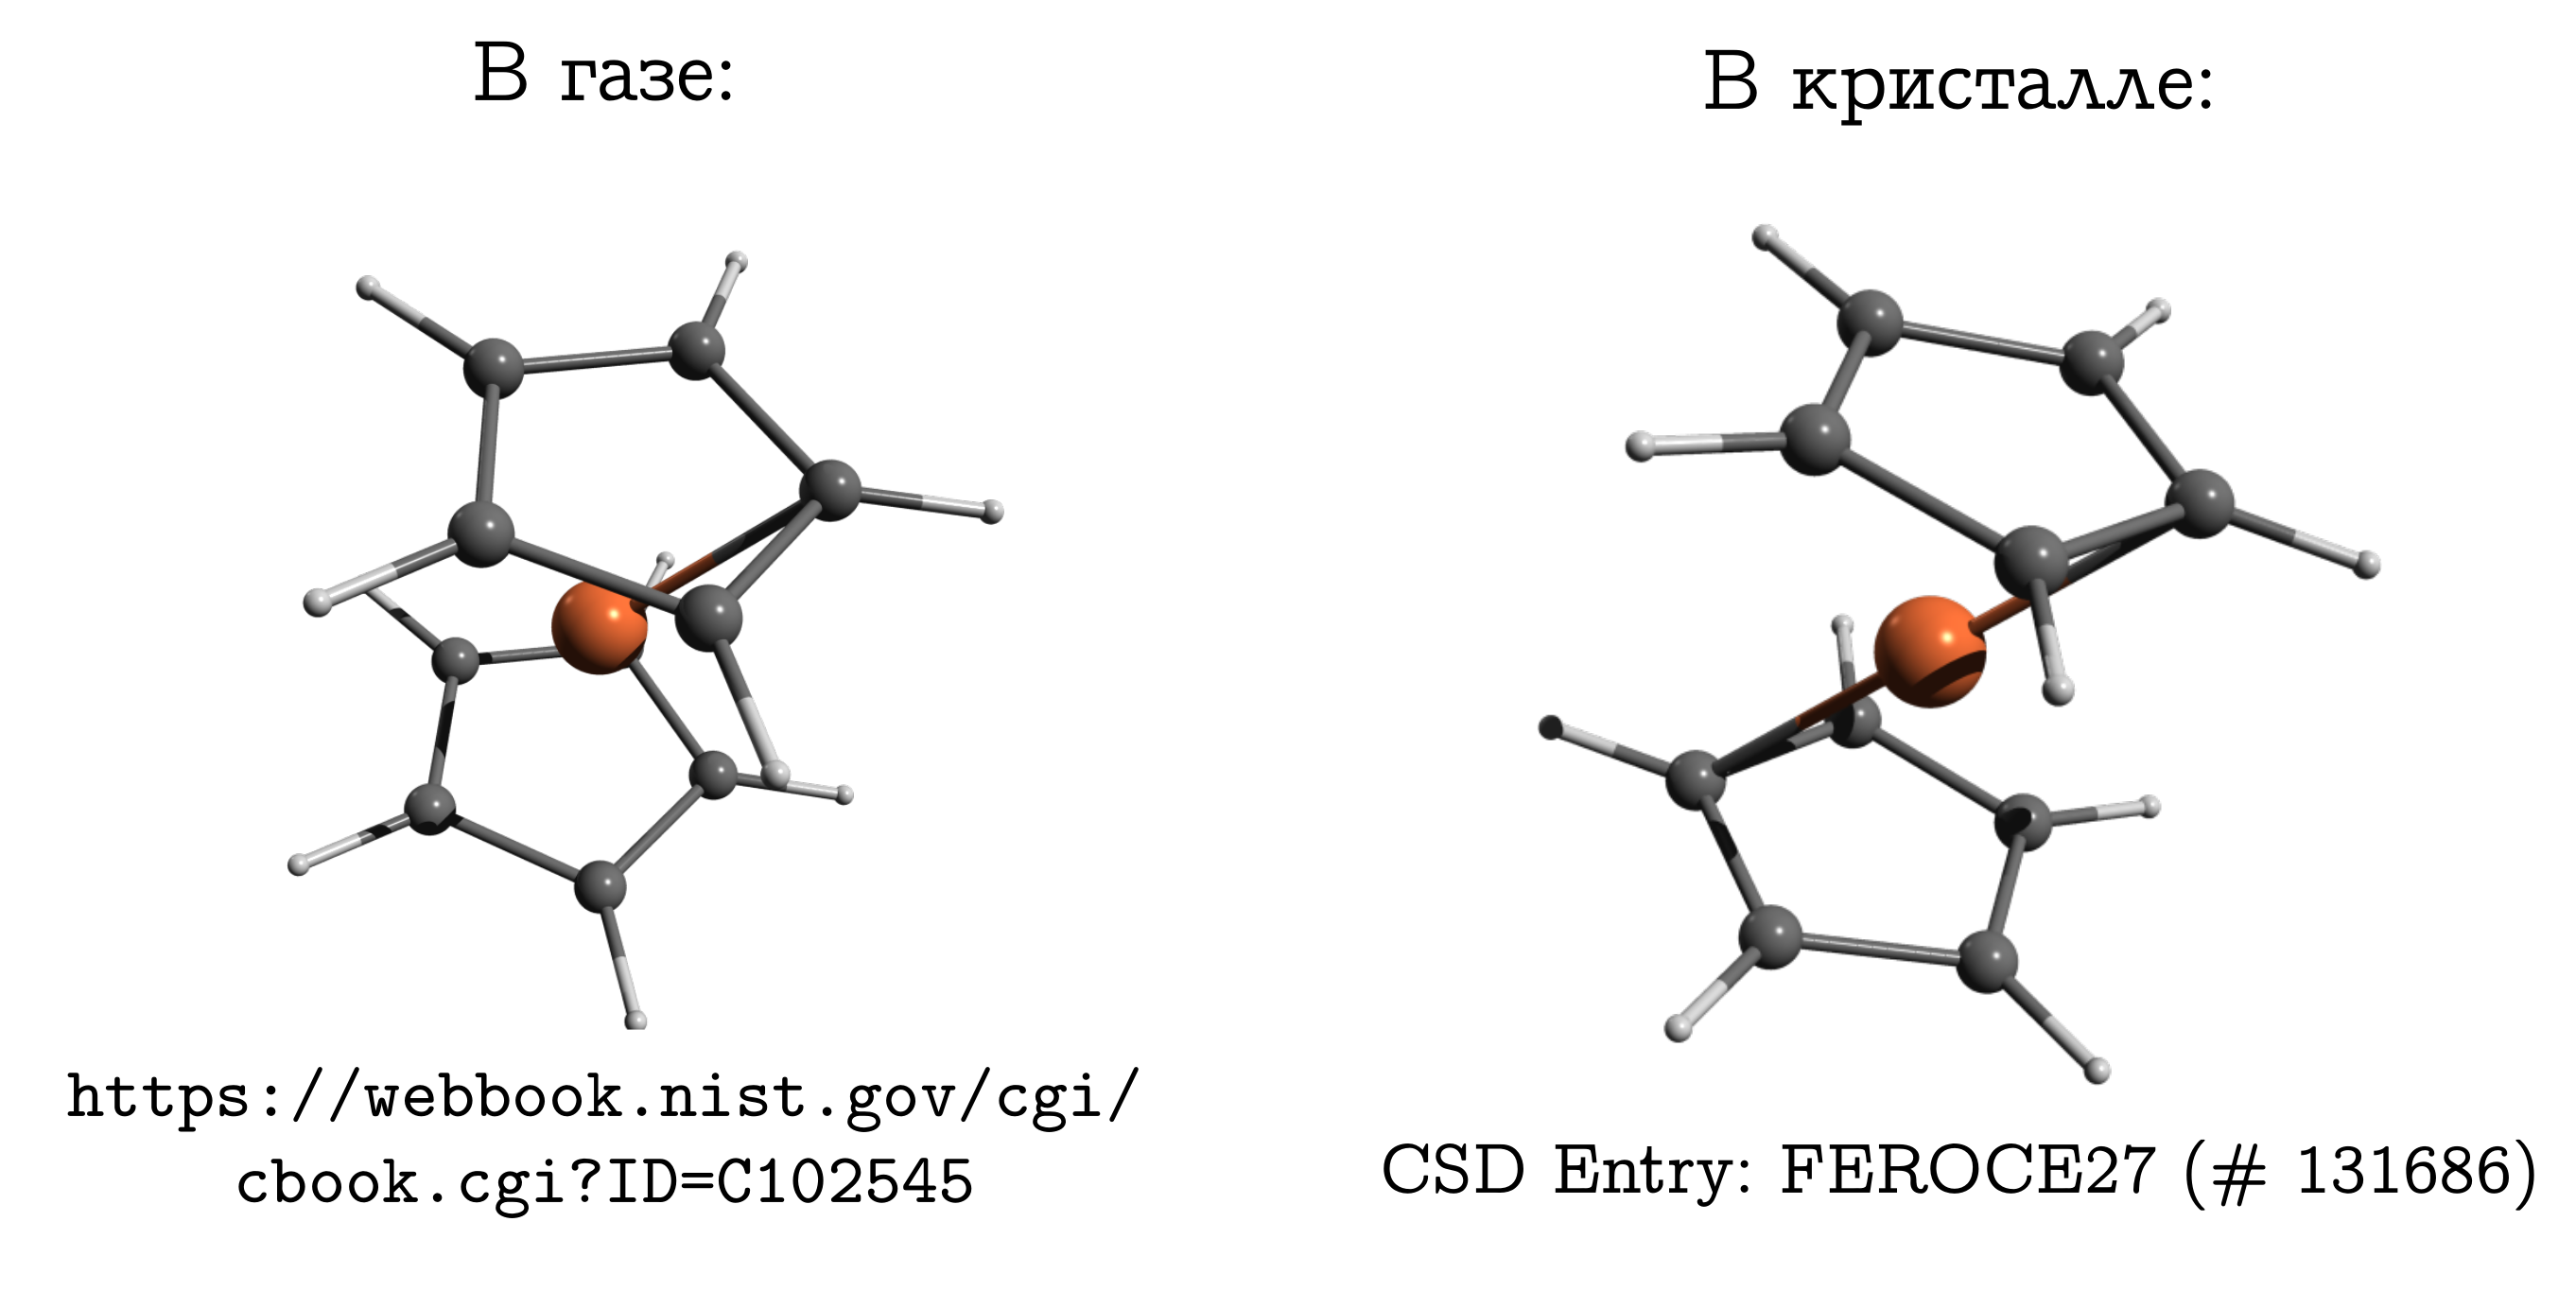
This molecule can be evaporated quite easily, and it is known that the most stable structure in the gas phase is the so-called. obscured conformation. In it, the carbons and hydrogens of the upper and lower rings are opposite each other (see the picture above), since in this case the dispersion interactions are strongest between these pieces of the molecule, and dispersion is always beneficial.
In fact...
Реальность ещё сложнее: в газе эти кольца вращаются друг относительно друга вдоль оси, связывающей центры колец и атом железа, но заслонённая конформация всё равно будет самой выгодной.
If we take a ferrocene crystal, it turns out that there molecules have another stable conformation (which for hydrocarbons is called hindered), in which the hydrogen and carbon of one ring are above / below the C – C bond of the other. There are also dispersion interactions between molecules, and a similar structure, which seems inconvenient for a molecule, arises because it is easier for molecules to fit closely together only in an inconvenient form, and this personal inconvenience is compensated by interaction with each other.
Why ferrocene is so different from ethane
Человеку, знакомому с химией, обычно приходится пересиливать себя, чтобы запомнить структуру ферроцена в газе. Ведь у него есть воспоминания о этане (С2H6), у которого наиболее стабильной конформацией является заторможенная (когда водороды одного куска CH3 лежат «между» водородами другого CH3), т.к. в этом положении минимизируется межатомное отталкивание между электронными оболочками водородов.

Взято из www.chem.msu.su/rus/teaching/stereo
А здесь вся разница в расстоянии. Стандартной формой потенциала дисперсионных взаимодействий является потенциал Леннарда-Джонса (это, кстати, один, а не два мужика):
В нём первое слагаемое берётся из межатомного отталкивания, а второе — из межатомного притяжения, возникающего из флуктуаций электронной плотности. В целом, этот потенциал выглядит как-то так:
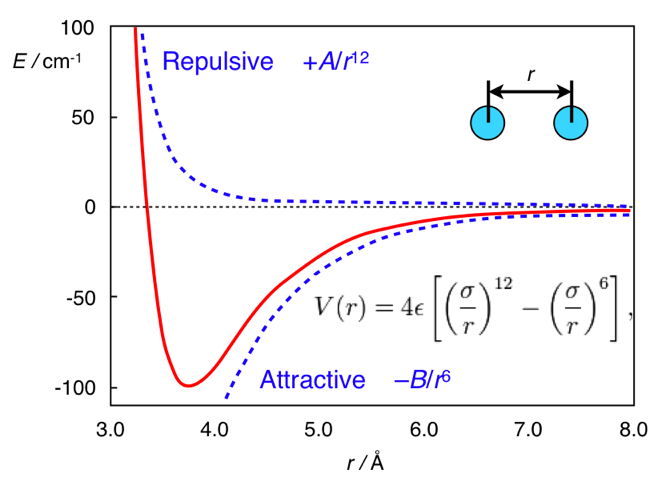
Потенциал Леннарда-Джонса. Взято из chemistry.stackexchange.com/questions/34214/physical-significance-of-double-well-potential-in-quantum-bonding
И в случае этана, атомы водорода находятся слишком близко друг к другу, поэтому они находятся (относительно её минимума) в левой части кривой, и для них характерно отталкивание. В случае же ферроцена, между кольцами есть прослойка нехилого размера (атом железа), из-за которого кольца оказываются достаточно далеко, чтобы не чувствовать межатомное отталкивание. И поэтому они находятся на правой (притягивающей) части потенциала.
Взято из www.chem.msu.su/rus/teaching/stereo
А здесь вся разница в расстоянии. Стандартной формой потенциала дисперсионных взаимодействий является потенциал Леннарда-Джонса (это, кстати, один, а не два мужика):
В нём первое слагаемое берётся из межатомного отталкивания, а второе — из межатомного притяжения, возникающего из флуктуаций электронной плотности. В целом, этот потенциал выглядит как-то так:
Потенциал Леннарда-Джонса. Взято из chemistry.stackexchange.com/questions/34214/physical-significance-of-double-well-potential-in-quantum-bonding
И в случае этана, атомы водорода находятся слишком близко друг к другу, поэтому они находятся (относительно её минимума) в левой части кривой, и для них характерно отталкивание. В случае же ферроцена, между кольцами есть прослойка нехилого размера (атом железа), из-за которого кольца оказываются достаточно далеко, чтобы не чувствовать межатомное отталкивание. И поэтому они находятся на правой (притягивающей) части потенциала.
Histamine
In the case of ferrocene, we saw the so-called. conformational differences: the molecule remained the same (i.e., no chemical bonds broke or formed), and its shape slightly changed.
But the differences can be even stronger, for example, if in the system we have so-called tautomeric transformations . Tautomerization is a class of chemical reactions that occur so easily and quickly that, as a result, we can simultaneously have several isomers of one molecule, which easily transfer to each other. These isomers are called tautomers.
A standard example of this: keto-enol tautomerism in ketones:

Most often, as in this example, tautomerism is associated with a proton jump from one warm place to another. And these reactions are tied to the tunnel effecthydrogen as the lightest of atoms is most susceptible.
Such chemical transformations are characteristic of many biological molecules, for example, for the nitrogenous bases that make up the DNA , or for sugars .
But when moving from system to system, the equilibrium constants of such reactions often change, so we can observe different tautomeric composition in different phases.
An example of this is the histamine molecule (see figure below).
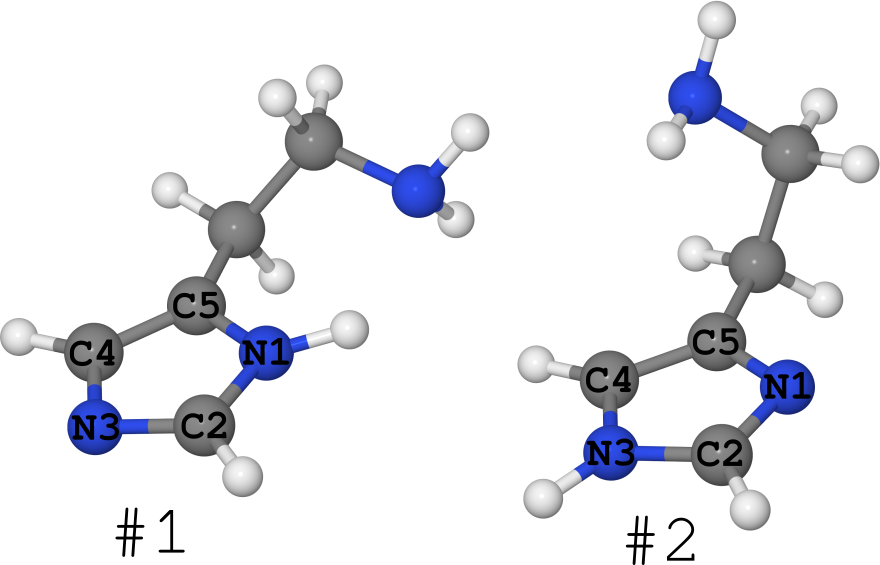
It exists in the form of 2 tautomers (I generally keep quiet about the number of conformers, there are a lot of them):
- # 1, where hydrogen sits on nitrogen N1,
- # 2 where hydrogen sits on nitrogen N3.
It so happened that for this molecule its structure is known in different phases.
- In the crystal, it is completely “frozen” in the form of # 1. (see article DOI: 10.1021 / ja00796a011 and structure in the Cambridge bank of structures under the name “HISTAN” and / or number 1176642)
- In aqueous solutions, this molecule exists in both forms, with tautomer # 2 being noticeably larger ( DOI: 10.1021 / ja027103x ).
- In gas, however, histamine exists equally in the form # 1 and in the form # 2 ( DOI: 10.1021 / ja980560m ).
Those. different phases contain different numbers of different molecules, which means they are different systems.
Error Output # 1
The main conclusion to be drawn from the examples given is as follows:
When comparing calculations in one phase with experiment in another, one must be prepared for systematic differences.
This does not mean that it is not necessary to compare: it is necessary to compare, but it is just necessary to be more critical about the detected differences and / or coincidences, and to evaluate such effects if possible.
Error # 2. "Zoo" molecular parameters.
The second error is briefly described as follows: if the parameters are called similar, but not the same, these are different parameters.
To understand what the source of such a disagreement between theory and experiment is, it is necessary to examine in more detail both the standard experimental methods that are used to derive molecular parameters, and models that calculate similar values purely from the theory.
And here we will again speak only about structures.
How to get experimental molecular structures
To somehow limit ourselves, let's talk only about the methods of studying the structure of single molecules, i.e. about the gas phase.
We have two main sources of such information:
- gas electron diffraction,
- microwave spectroscopy.
We will dwell on each of these methods in more detail.
Gas electron diffraction
The method is quite old; it takes its origin in the 1930s, when German scientists Mark and Wirl conducted the first experiments on diffraction of electrons by gas.
Few people know, but this research method is involved in obtaining three Nobel Prizes in chemistry.
3 nobel with electronographic contribution
- Питер Дебай в 1936-м году получил свою награду с формулировкой:
"[for his work on] molecular structure through his investigations on dipole moments and the diffraction of X-rays and electrons in gases"
Это единственное явное упоминание газовой электронографии в заслугах лауреата, и не спроста. Основное уравнение электронографии для интенсивности молекулярного рассеяния носит имя Дебая.собственно, уравнение Дебая
Здесь обозначает интенсивность рассеяния электронов (или рентгеновских лучей, или других частиц) парой i-го и j-го атомов на расстоянии друг от друга, — координата рассеяния, связанная с углом рассеяния и длиной волны частиц , а — способность этой пары атомов к рассеянию дифрагирующих частиц.
И несмотря на то, что об этом замечательном физике помнят что угодно (модель ионных растворов, его модель для расчёта теплоёмкости кристаллов), но только не электронографию, главный научный приз он получил (в частности) за неё. - Лайнус Полинг в 1954. Да, тот самый, получивший 2 личные нобелевские премии,
да ещё и посадивший весь мир на витамин C, Великий Полинг. В бытность своей работы в Калтехе он, в частности, занимался газовой электронографией (см., например, DOI: 10.1021/ja01873a047). И конечно, знание структурной химии свободных молекул помогло ему создать знаменитую теорию химической связи (но не будем тут принижать и его большой кристаллографический бэкграунд). - Одд Хассель, лауреат 1969 года. Свою 1/2 нобелевской премии он получил за открытие конформационного равновесия. Сделал он это на основе электронографического исследования циклогексана. Эта молекула существует в виде двух конформаций: кресло (chair) и ванная (в английской традиции — лодка, boat).

Отсюда: www.shapeways.com/product/N5FE298DS/cyclohexane-2-molecules-boat-and-chair-form
Эти варианты расположения атомов быстро переходят друг в дружку, но в то время об этом не знали, и считали, что должна реализовываться только одна из структур. Только вот электронографический сигнал никак не хотел описываться ни одной из этих структур, и только комбинация сигналов от обеих конформаций смогла объяснить наблюдающуюся дифракционную картину (об этом можно подробнее почитать в книге И. Харгиттаи «Откровенная наука. Беседы со знаменитыми химиками»).
The scheme of the method itself is very simple (see the picture below).
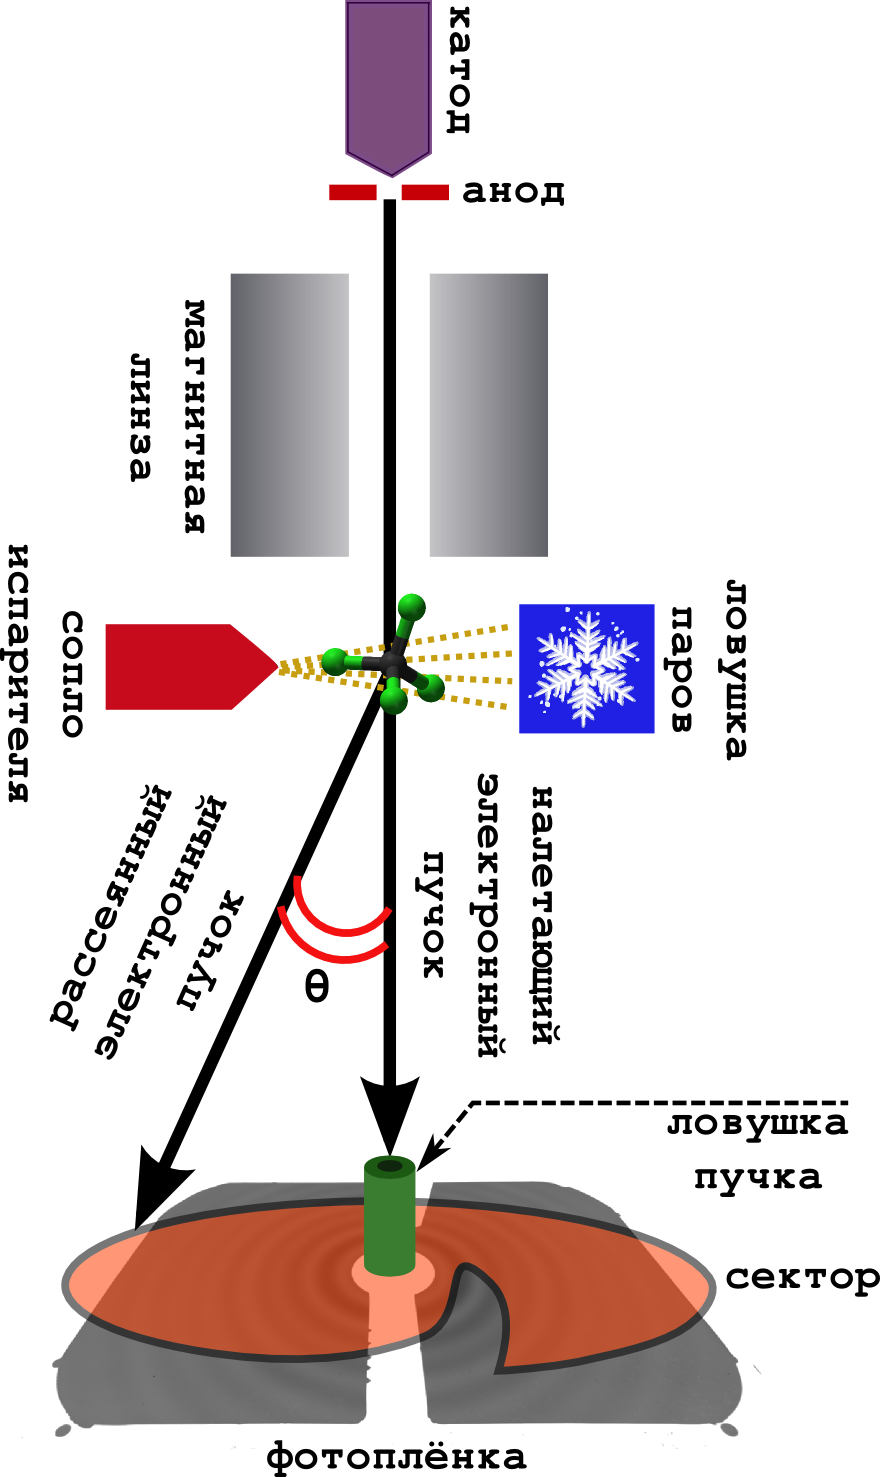
It happens in a vacuum.
- From the cathode, fast electrons are continuously knocked out, which are accelerated in the field of the anode to energies of 40–60 keV.
- Enough scattered (but fast) electrons are focused by a magnetic lens, after which they turn into a narrow beam.
- Perpendicular to the beam is a camera with a substance. The sample is heated to a boil, and the resulting steam goes to meet the electron beam.
- The electrons are successfully scattered on the molecules, and quietly fly away further, where they fall on the photographic film.
- Usually they put so-called in front of the film. sector device. This is a very fast rotating screen of unusual shape. The fact is that the electron has a probability of deviating from the initial direction (on a large scattering angle), very quickly falls. Therefore, in order to smooth out this drop in intensity, the sector evenly eclipses the central part of the film, leaving the far part open. The result is a more evenly illuminated picture.
- The beam trap catches those electrons that are not scattered at all (and there are a lot of them).
- Well, so that the molecules do not fly around the device, soiling it, they are frozen in a cold trap cooled with liquid nitrogen.
The result is the same diffraction pattern of concentric rings, described by the Debye equation (this is a signal). From it, you can then directly pull out various molecular parameters.
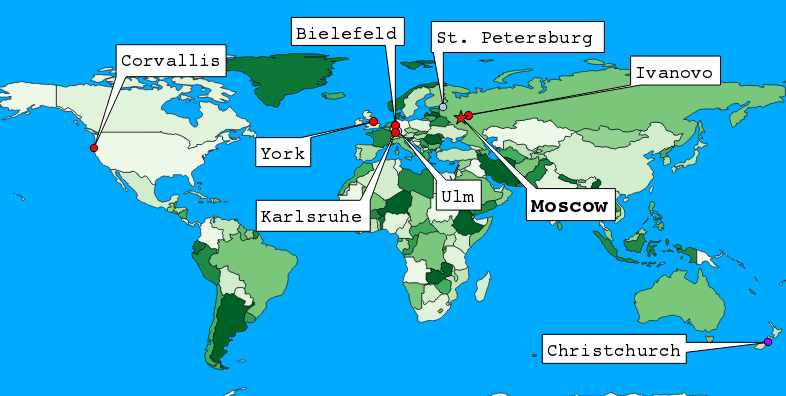
Where can I find laboratories involved in gas electron diffraction?
Их не так уж и много осталось.
Но в РФ их две: Москве (на Химфаке МГУ), и в Ивановском Химико-Технологическом Университете.
Но в РФ их две: Москве (на Химфаке МГУ), и в Ивановском Химико-Технологическом Университете.
Microwave spectroscopy
This method of studying molecules is known more, so I’ll talk about it a little more briefly, using the example of the most modern modification: a spectrometer with Fourier transform (xs as in Russian, shorter than Fourier-transformed microwave spectroscopy).
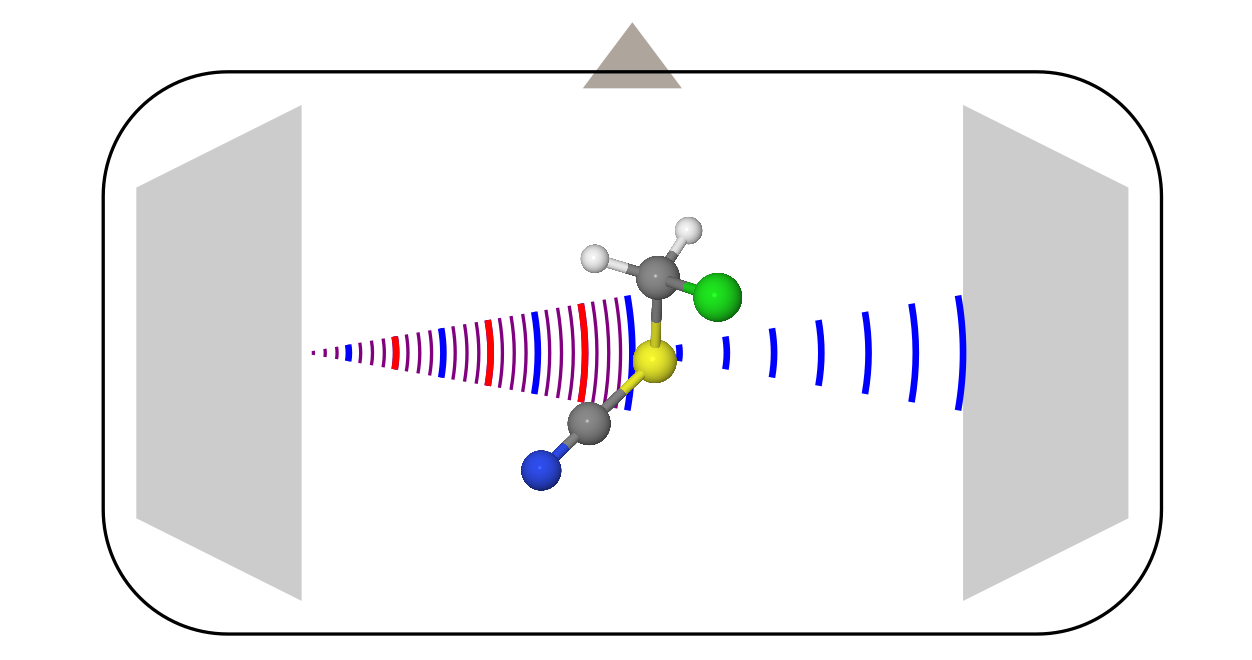
The design here is more complicated, because it requires a bunch of different electronics (amplifiers, frequency modulators, etc.). All this we omit, and talk only about what is happening inside the vacuum chamber.
- There are two horn antennas opposite each other (like the one with which relic study was discovered ). One of them serves as a transmitter, and the second is a receiver.
- Perpendicular to these antennas is a valve that runs the sample. Most often, it is launched in the form of steam along with some carrier gas (usually inert gases) in the adiabatic expansion mode. In such conditions, the molecules are rapidly cooled to temperatures around 0 K, which greatly simplifies the spectrum, making it more susceptible to interpretation.
- When molecules fill the entire chamber, the transmitting antenna irradiates them with a linear frequency modulated signal. In the frequency representation, this corresponds to the sum of all frequencies in a certain range.
- Some molecules absorb this radiation at different transmitted frequencies, and go into the excited state. But, after a while they fall back, starting to radiate what they grabbed during the impulse from the transmitting antenna. This stall looks like a decaying oscillating signal ( free induction decay ). The second antenna registers it. Then, after the Fourier transform of recording this signal over time, the usual spectrum of frequency is obtained.
Unlike electron diffraction, which was not important for considering molecules, a molecule should have a constant dipole moment in microwave spectroscopy (in rare cases, a magnetic dipole moment is also suitable, this is characteristic of radicals, such as an O 2 molecule ). The signal here is “emission intensity vs. frequency". The rotational constants are extracted from these spectra through some models, from which later the structure of molecules is obtained.
Welcome to the Zoo of Molecular Parameters!
Now it's time to look at what geometric parameters we can pull out of various experiments. In fact, each of the types of values indicates what model was used to fit the experimental signal (most often, using the least squares method). Most of the above parameters can be found in the review Kuchitsu K., Cyvin SJ // In: Molecular Structure and Vibrations / Cyvin SJ (Ed.) - Amsterdam: Elsevier, 1972. - Ch.12. - P.183-211.
Let's start again with electron diffraction.
- -structure. It is simply a set of average values of interatomic distances at a given temperature.
- this value is similar , but it is somewhat more natural to describe the diffraction pattern.
- . This value does not have a clear physical meaning and is entirely tied to the interpretative model. In essence, this is what is observed in crystallography.
Crystallographic Examplestructures (tetranitromethane in the crystal). Taken from DOI: 10.1002 / anie.201704396
Each atom is approximated by an ellipsoid describing its oscillatory motion, and the interatomic distances are taken as the distances between the centers of the ellipses obtained. But such a simplification of the nature of the motion of atoms corresponds to the introduction of an approximation of a harmonic oscillator for oscillations, but it does not always work well.
An example of the distribution of atoms, when the approximation of a harmonic oscillator does not work. The same tetranitromethane, but in gas. - . This
HEROmiracle whale fish is not described in any way, it has a very weak relation to reality, but has remarkable properties: it must be geometrically consistent (see below) and is easy to calculate. Due to this, she gained her great popularity in the electron-diffusion community.
In microwave spectroscopy, the variants of the structures are somewhat smaller.
- The most physically understandable is structure. In essence, this is the average geometry over a certain vibrational state of the molecule (). Since most often they work with cold molecules, they usually observe one specific structure from this class:i.e. the geometry of the molecule in the ground state, when the atoms make zero oscillations around their most advantageous position.
- The most popular is -structure. The index "s" means "substitution". They get it this way: they assume that there are some atomic coordinates that are fixed in space, then they produce a monoatomic isotopic substitution of an atom in a molecule, and the position of this atom is determined by changing the rotational constants. The main advantage of this technology is simplicity. Minus: you need only monosubstitution + not all the positions of atoms can be set so + the physical meaning of such a model is not very clear.
- Logical development -structures are -structures that are obtained from mass-weighted OLS fitting. For them, isotope-substituted molecules are also needed, but here any are suitable.
And this is far from all possible types of structures ...
But the
And here comes the question: is it correct to comparestructure with some of the experimental, looking only at the experimental error?
The answer here is simple: no , it is necessary to lay an additional error for possible systematic differences. And this is a very vivid example: the Bastiensen-Morino effect (see DOI: 10.1107 / S0365110060002557 and DOI: 10.1107 / S0365110060002545 ).
Suppose we have a molecule of type CX 2 (i.e. CO 2 , CS 2 , etc.). As we should know from the course of school chemistry, these molecules have a linear structure (carbon atoms and two chalcogen X lie on one straight line).
This means that the distance between the atoms X must be equal to twice the length of the C – X bond (i.e. ).

Be that as it may, if we measure the distances between C and X atoms () and XX () by the method of gas electron diffraction, we obtain that i.e. the molecule is kinda bent. The reason lies in the fact that the molecule makes a so-called. scissor vibrations , due to which the atoms of X are much closer to each other than in the most favorable location (see. Fig. below).
Where does the Bastansen-Morino effect come from? Picture from article DOI: 10.1039 / C6CP05849C .
Therefore, if we equate the temperature-averaged-structure to equilibrium (), we would make the wrong conclusion that the molecules of carbon dioxide and carbon disulfide are curved.
That is why when comparing different types of geometrical parameters one should always be very careful. This applies to both the comparison between experimental data and the comparison of experiment and theory.
Weeds of Standard Molecule Model
And now imagine that we desired to wholeheartedly simulate the result of an experiment based on our theoretical model, in order to compare the simulation with reality in a fair fight.
And here we must also be careful, because different models of molecules also have their limits of applicability. Let us analyze this using the example of the Standard Molecule Model.
First you need to understand what a Standard Molecule Model is. The BAK physicists have their Standard Model , the astronomers have their own , and so the physical chemists have their own basic design, from which they later dance. But unlike physical models, what we consider is a set of approximations that allow the user to get a result relatively automatically and quickly.
For users Gaussian
Сейчас мы вспомним, что же лежит в основе Гауссиановских магических заклинаний «Opt» и «Freq».
The general scheme of the introduced approximations looks something like this:

At the very bottom of quality is our standard model. Briefly go through all the stages of its receipt.
- First, we immediately forget about the existence of relativism, and remain within the framework of classical quantum mechanics (well, an oxymoron). What then do we have? There is a molecule consisting of nuclei and electrons, flying in a vacuum. Since no one touches it, we can introduce an inertial reference system, separating the translational motion of the center of mass of the molecule (“Tr”, from the word translation).
- After this, we notice that electrons are almost 2000 times lighter than nuclei, therefore, under the action of Coulomb attraction to nuclei and Coulomb repulsion from each other, they move much faster than nuclei. As a result, the electrons think that the nuclei are frozen. Therefore, the electronics quietly accept the most advantageous configuration for themselves, and as the nuclei move a little bit, the electrons are already rearranged, as it is more convenient for them. The nuclei see only some averaged potential created by electrons and Coulomb interactions of everything with everything, but they do not see the details of the movement of electrons. This separation of electrons and nuclei is called the " Born-Oppenheimer approximation " (yes, this is the same Robert Oppenheimer , he is not only known for the bomb).
- After the separation of electron motions (“El”), the oscillations of nuclei in the field of electrons, and the rotation of the whole molecule as a whole, remain. In the general case, it is impossible to divide these 2 motions; therefore, the approximation is accepted that the nuclei do not go far from their most advantageous position (equilibrium geometry). In this approximation, we can formulate Eckart conditions , through which it is possible to separate the rotation of the molecule and the vibrations. The rotating system is a molecule frozen in its equilibrium geometry. And this approximation is called a “hard rotator” (“RR”, from a rigid rotor).
- Well, for a sweet: the general form of potential energy for oscillations (created by electrons) is unknown. Therefore, in order to get at least some approximation, this energy is laid out in a Taylor series in the region of the minimum point (ie, in the vicinity of the equilibrium geometry) to quadratic terms:
The resulting potential is nothing more than the energy of a particle on a spring, so solving the equations of motion we get that a molecule is a set of springs oscillating with different frequencies. Therefore, this approximation is called the "harmonic oscillator" ("HO", harmonic oscillator).
The resulting model is called RR-HO (@BO). We will not touch the Born-Oppenheimer (BO) approach, but we will have to talk about the hard rotator and harmonic oscillator in the framework of structural chemistry ...
And the main problem with this approximation is that the molecule is not hard, and the vibrations are completely non-harmonic. Accordingly, in reality, we need an approximation of a non-rigid rotator and an anharmonic oscillator. And the key word here is “anharmonic”, i.e. "Not harmonic."
Let's talk about the simplest molecules: diatomic. There are many examples of them: HCl, HBr, HI, CO, O 2 , N 2 , etc. etc. They are distinguished from all molecules by the fact that they have only one vibration: the stretching / compression of the interatomic distance.
And we can measure this distance between atoms in gas electron diffraction (in the variant of average temperature, ) and in rotational spectroscopy (averaged over, say, the ground vibrational state, i.e. ).
And now the main question of the Universe of Life and Generally arises:
what will and in the harmonic oscillator approximation, and how this relates to the equilibrium distance ?
To answer, you will have to look at the surface of potential energy for a diatomic molecule:

- If we work in the approximation of a harmonic oscillator, then our potential will be symmetric about the equilibrium position: going to the right or left of it looks the same. Therefore, the molecule during the oscillations will walk to the right and left with the same frequency, as a result, we will always have an equilibrium position in the middle position.
- In reality, the potential is not very similar to a parabola, and for diatomic molecules it has a minimum position and 2 asymptotes:
- vertical (with ), arising from the Coulomb repulsion of nuclei, since electrons no longer “fit” between them and do not create a chemical bond,
- horizontal (at )
As a result, if the molecule shortens its bond length relative to the equilibrium position, it rests against the wall, and if it increases, it falls on a soft sofa. And the molecule is not a fool, it will lie more on the couch than beat against the wall. Therefore, the oscillation averaged over the distance will be greater than the equilibrium (), and it is noticeable: similar displacements have an order of 0.01 Å, which is higher than measurement errors.
Therefore, even if we want to calculate something more similar to the experiment, staying within the Standard Model of the Molecule (RR-HO @ BO), we will not get anything new, so the equilibrium geometry will be compared in comparison.
Error Output # 2

Illustration from the article DOI: 10.1002 / anie.201611308 .
And the conclusion is horribly simple and consists of 2 parts.
- With proper comparison, all values should have the same meaning.
- If the values are different, then this should not be forgotten.
Examples of errors in scientific papers
"Hindu works"
Actually, the main place where you can find something like this is low-level magazines. They are rarely found articles with steep results, so they were chosen by the “Leading Researchers” from countries of the second and more Worlds (the BRICS countries and their less successful followers). The “low level” journals here do not mean those that publish articles such as “Rooting: an algorithm of typical unification of access points and redundancy” , but quite respected scientific publications. In my scientific field, the most well known “semi-washes” are:
- Journal of Molecular Structure from Elsiver (with IF = 2.011),
- Journal of Molecular Modeling from Springer (with IF = 1.507),
(there are others). As can be seen, by formal signs, in Russian science they are considered to be very decent editions. But, there comes such an influx of
As an illustration, I took the latest issue of the Journal of Molecular Structure and went through the table of contents, and voila:
S. Sathiya, M. Senthilkumar, C. Ramachandra Raja, Crystal growth, Hirshfeld surface analysis, DFT study and third order NLO studies of thiourea 4 dimethyl aminobenzaldehyde // J. Mol. Struct., V. 1180 (2019), PP. 81-88.
https://doi.org/10.1016/j.molstruc.2018.11.067
The general structure of such works is very simple.
- “Brewed” (but more often stupidly bought on Sigme ) some substance. In this work, the substance is still cooked.
- Further, for this substance, an X-ray diffraction analysis (XRD) can be performed, from which the structure of the molecule in the crystal is obtained. Since PCA is a standard procedure, and PCAsh (except for those that proteins and other huge structures are studying) most often work in conveyor mode, there is nothing special here. Therefore, the molecule is calculated by some simplest methods in the grunt Gaussian program, which is the quintessence of the term "quantum chemistry for housewives." And the structures of a theoretical molecule in gas are compared with the experimental data of X-ray diffraction ... aiiiii, it turns out a combo of 1st and 2nd errors, since Researchers often do not disdain to talk about the quality of quantum chemistry.
- Further, in a similar style, IR and Raman spectroscopy, UV / Vis, measurements are added.
- In standard molecular visualizers, the type (grunt) GaussView beautiful pictures are drawn, but always in poor quality.
- No conclusions are made on the merits: “we experimented a lot, counted a lot, brought tables and pictures we are great, give us some candy. ”
But from my favorites: article
M. Govindarajan, M. Karabacak, FT-IR, FT-Raman and UV spectral investigation; Spectrochimica Acta Part A: Molecular and Biomolecular Spectroscopy, V. 85 (2012), PP. 251-260,
https://doi.org/10.1016/j.saa.2011.10.002.
It stupidly filmed the spectrum in the solid phase, and then was interpreted on the basis of mediocre calculations in the HO model in the gas phase. But the trick is that they couldn’t even make the calculations normally, which they politely hinted at in the commentary on the article .
However, the term “Hindu works” (as well as the term “ Hindu code ”) does not only refer to works coming from the corresponding mysterious subcontinent.
If you go to the wonderful site of Cyberleninki , then
- " Hydrogen bonds on the upper and lower rims of the molecule in calix [n] arenes (n = 4, 6) according to IR spectroscopy and quantum chemical calculations "
- "An approach to an a priori estimate of the optical absorption spectra of large molecules ",
- " Assessment of the adequacy of quantum chemical methods for calculating nitrogen-containing heterocyclic compounds with XRD data ".
I was particularly pleased with the latter, because the “assessment of adequacy” by inadequate comparison of structures in different phases (gas vs. crystal) and with different meanings ( vs. ) - this is really the height of adequacy.
Is there such a thing in good magazines?
Yes, "mistakes" are there.
Do not worry, everything ended well!
К счастью, в той истории, к которой мы сейчас обратимся, небрежное отношение к экспериментальным/теоретическим величинам не привело ни к каким серьёзным и страшным последствиям. А работы, несмотря на реально допущенное упущение, не теряют крутоты и значимости.
Причём, в итоге всё закончилось вообще супер: публикацией офигенной статьи, где справедливость восторжествовала.
Причём, в итоге всё закончилось вообще супер: публикацией офигенной статьи, где справедливость восторжествовала.
It will be a question of one of the organic molecules with an extremely long single C - C bond: about 1,1'-bis-adamantane :

Why is this molecule cool
Если заглянуть в школьный или ВУЗовский учебники по химии, в Вики (да даже просто вбить в Гугл), то мы узнаем, что стандартная длина одинарной C--C связи составляет 1.54 Å.
Так вот, экспериментальная длина центральной одинарной связи в 1,1'-бисдиадамантане Å, почти на 0.08 Å длиннее (это дофига)!
Это удлинение одинарной C--C связи возникает из-за того, что два алмазоподобных куска, которые эта связь держит, очень большие, поэтому они отталкиваются друг от друга. Но, как мы помним из примера ферроцена, у нас есть и притяжение за счёт дисперсионных (лондоновских) сил. И вот из-за нехилого размера этих половинок молекулы, возникает большое дисперсионное притяжение между кусками. Оно и не даёт разорваться этой центральной связи, поэтому данную молекулу можно (относительно легко) испарить, не сломав её по дороге.
The central one-to-one C – C relationship is very long, and therefore it was very interesting to compare how theoretical methods reproduce reality. And the reality in the first articles, here they are:
- Peter R. Schreiner et. al, Overcome lability of bonds through dispersion forces // Nature (2011), V 477, PP. 308–311
- Andrey A. Fokin et. al, Stable Alkanes Containing Very Long Carbon – Carbon Bonds // JACS (2012), V 134, PP. 13641–13650 ,
Holy shit!
Первая статья — это в Nature, самом крутом журнале, а вторая — в JACS — самом уважаемом чисто химическом журнале!!! Мало кому такое снилось, но эта немецко-украинская научная коллаборация очень крута.
It was presented only crystallographic data. As a result, comparing difficultly comparable things to each other, without making proper corrections for the difference in parameters, they finally concluded that the length of the central C – C bond in gas is 1.655 Å, having missed by 0.02 Å. And this is significantly more than the experimental error.
Fortunately, in the end, they cooperated with specialists on these issues, and eventually got the correct answer (a brief popular summary of this work can be found on N + 1 ).
Do you need a comparison?

After all that I wrote about the correctness of the comparisons, a reasonable question may arise: is it then necessary to compare the results of the calculations and the results of experiments with each other at all?
Need to! Even as necessary!
There is a well-known statement (of which I could not find a reliable author):
But he didn’t agree.
Everybody believes experimental results, except for them.
Translated into Russian, it sounds like: No one believes theoretical calculations, except for the one who made them, but everyone believes the experimental data, except for the one who received them.
But in science it is necessary that everyone believed (well, or the majority), and experiment is the only measure, since it relates what we counted to Reality.
There is a remarkable essay (in the public domain) in the second most important chemical journal: Mata R., Suhm M. // Angew. Chem. Int. Ed., 56 (2017), DOI: 10.1002 / anie.201611308
(by the way, I already cited a link to it, since one picture, by Ricardo Mata, is from this article).
The conclusions of this essay provide recommendations to theorists-simulators and experimenters. I will bring them here (in translation and small processing) as the final word to this post.
- Theorist should:
- give not only successful methods and attempts, but also describe the methods of the file (especially if these methods are popular),
- describe your methodology well and fully
- where it is possible to provide estimates (or descriptions) of errors, and important adopted approximations and simplifications.
- Experimenters, in turn, should:
- to pock theorists with their experimental data, which they could use as benchmarks (standards),
- show the scientific community incomprehensible experimental data, where theory (or additional experiments) would help with the explanation,
- speak at a
foreign territorytheoretical conferences with their own data,personal storyКстати, с вторым автором этой статьи, который является экспериментатором, я как раз и познакомился на теоретическом симпозиуме. - pull things out of their experimental data that are as accessible as possible for comparison with theory,
All the best and correct comparisons! And remember: only the one who does nothing is not mistaken.
PS
As an afterword I would like to give a small list of databases where you can dig up different experimental data for molecules.
Structural Databanks
Crystallographic banks
The easiest way to determine the structure of a molecule in a crystal is because PCA is a routine procedure. Therefore, if you do not know what the molecule looks like, go ahead to the crystallographic data banks (places where almost all the structures of substances ever crammed into a goniometer and illuminated by a beam of short-wave particles are collected). Since there are a lot of such banks, I will give only the most famous ones (a more complete list can be found on the wiki ).
- Inorganic Crystal Structure Database ( ICSD ). This is not exactly about molecules, there you can basically find structures of different salts, metals, ceramics, etc. This base is supported by Karlsruev Technological University, therefore access to it is paid and not cheap. But if anything, its site .
- Cambridge Structural Database ( CSD ). Perhaps the largest crystallographic base in the world. Almost a million structures! These are mainly organic and elemental molecular crystals. And this base is free! For additional the fee, of course, you can get a cool optional, such as searching for the drawn structure of the molecule, but this is already a surplus. Site .
- Crystallography Open Database ( COD ). Well, also some kind of database. I don’t really know what is there, but at least it exists. Site .
- Well, for those who are interested in biology, there is a Protein Data Bank ( PDB ). An open database from where you can download the structures of huge and scary proteins (but in crystals). Site .
Molecular structures in gas
Here things are somewhat worse, because experiments to study the structure of free molecules are much more complex, both for carrying out (at least a high vacuum is needed) and for interpretation.
Therefore, the databases here are much smaller.
- The largest database for free molecules is MOlecular GAsphase DOCumentation (or MOGADOC ). It is based at the University of Ulm and is a very expensive investment. But, if that, the site is here .
- If you want to know the 100% experimental equilibrium structures of molecules, then this is in the NIST Computational Chemistry Comparison and Benchmark DataBase ( CCCBDB ). Almost all purely experimental.-structure can be found there, but there are enough other nishtyakov there. Site .
- The last stronghold is the underdeveloped MolWiki project . But there are especially many structures not to be found, only those that were obtained at the University of Bielefeld, Moscow State University and IHKTU lately (and even then not all). Site .
Where to find the spectral characteristics of molecules?
Taken from xkcd.com
There are significantly more databases here, because removing a spectrum without interpretation is a significantly simpler task than obtaining a structure (no need to build models and prove that they are correct). And besides, the spectra are of tremendous practical importance: they can be used to determine the composition of the samples, whether it is water from a nearby river, or a signal from a molecular cloud (or even from an exoplanet atmosphere, see illustration above).
Yes, by the way, all links in this section will be on free databases.
- NIST Chemistry WebBook . Perhaps the best book in the world. In this database you can find IR, UV / Vis, mass spectra for a heap of molecules. And also, thermochemical parameters and even sometimes kinetic! In general, if a chemist does not know about the existence of this site, then he is not a chemist. Site .
- High-resolution transmission molecular absorption database ( HITRAN ). The project of the Harvard-Smithsonian Center for Astrophysics, from which it is obvious that the spectra given there are used to identify molecules in the interstellar and circumstellar spaces (for example, so ). Site .
- Similar to the previous, is the project The Cologne Database for Molecular Spectroscopy, from the astrophysical part of the University of Cologne. Site .
- Well, as a last example, I will give the ExoMol project . These are not entirely pure experimental spectra, but this is an excellent example of the interaction between theory and experiment: based on highly accurate experimental data and very high-level calculations, the spectra of the simplest molecules under different (including extreme) conditions are predicted. The main focus here is on biomarkers, so when astronomers see the spectra of exoplanets, they can easily identify in them molecules already known to us. Site .
Pps
If there are errors / something is not clear, write in the comments - I will correct / try to explain better.