Overview of Mobile Application Metrics

So, you published your first application in the store. The first downloads have begun, and now is the time to start shooting metrics to analyze them and identify possible weaknesses. Analytics is the most important tool in the world of mobile applications. It allows you to understand the psychology of the user, to understand how he interacts with the mobile application, and as a result will help make your brainchild better and more profitable.
There can be a lot of metrics, and usually their set depends on the specific application. But there are a number of key indicators that need to be monitored regardless of the nature and scale of your project. These include:
- Application installation source : information about how the user found out about your application;
- User retention : how many people launched your application after a different number of days after installation;
- The number of unique users : how many people use your application during the day, week and month, how regularly they do it;
- Session : duration of interaction with the application, which screens of the application the user visited, when and how the session was completed;
- Interaction with the interface : which buttons and in what sequence were pressed, A / B tests, etc .;
- Finances : if your application uses paid content, it is critical to know what proportion of users decides to fork out, how often they do it, what is the average profitability of one user, how much money the project brings to you, whether it is profitable or unprofitable.
Let's take a closer look at each item.
Application Installation Source
A very important metric to understand the effectiveness of an advertising channel. You can simply track the advertising channel, the principle is the same as with the transition to the website: special tags unique to each of the advertising channels are inserted into the link leading to the application store. After installation, the application reads these labels and captures the source. Next, this source will appear in the analytics system that you are using.
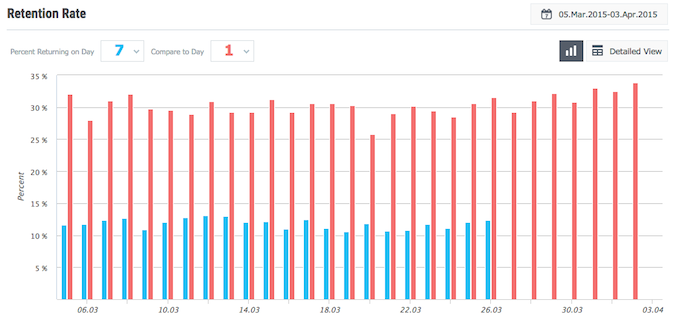
User Retention
A number of metrics are used here. After the user has installed and launched the application, he evaluates whether he likes it. If not, he will immediately remove it or close it and forget it. But if the application was to your liking, then after a while a person will launch it again.
To evaluate attractiveness for users, most often metrics are taken:
- 1-day retention . Metric means the percentage of users (%) who opened your application the day after installation. That is, this is the number of people who are so interested in your product that they quickly returned to it. The low value of this indicator indicates that users are not happy with something in your application. More often than not, a bad “1-day retention” talks about problems with the interface: it can be uncomfortable and / or incomprehensible, this is the first thing to do to correct the situation. After all, if the user did not return the next day, then with a high probability it will not return at all. So increasing the value of this metric is one of the most important tasks after laying out the application.
It is calculated by the formula:
1DR = X 1 / Z, where X 1 - the number of users who launched the application the next day, Z - the total number of installed. - 7-day retention . Percentage of users returning a week after installation. If this indicator is lower than “1-day retention”, then it’s time to sit down and analyze what users may not be happy with after a longer, weekly acquaintance with the application. It may be worth revising the approach to use cases .
It is calculated by the formula:
7DR = X 7 / Z, where X 7 is the number of users who launched the application on the seventh day, Z is the total number of installed. - 28-day retention . The proportion of those who used the application on the 28th day after installation. If even a month later, people return to your product, then this suggests that he “hooked” them. A decrease in the value of this metric compared to the previous one indicates some deep, implicit, strategic shortcomings.
It is calculated by the formula:
28DR = X 28 / Z, where X 28 is the number of users who launched the application on the seventh day, Z is the total number of installed.
All three metrics are removed daily; at each application launch, the current date and installation date are compared. An analysis of the dynamics of changes in each of the metrics will also allow you to understand the reaction of users to certain changes you make to the application. For example, a 1-day retention level usually indicates how users react to the interface of your application. And if this indicator began to decline, then first of all it is necessary to check what is wrong with the interface.
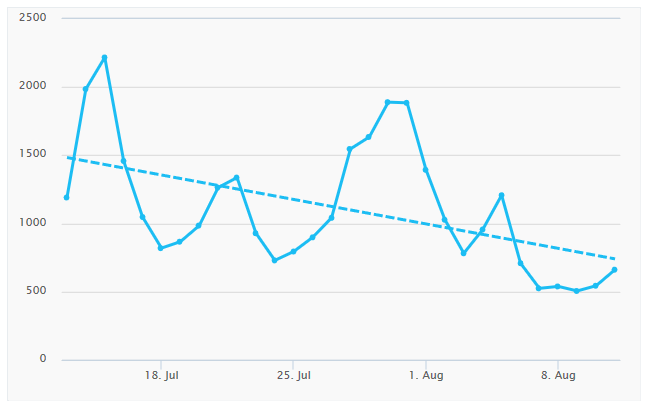
The next important daily metric is the increase in the number of new users.. Moreover, it is recommended to monitor the change in this parameter during advertising campaigns, placement of review articles, conclusion of partnership agreements, etc. In this case, the metric plays the role of the effectiveness of all these body movements. It is advisable to superimpose on the graph the number of new users not only the dates, but also the installation time, which will help to more accurately assess the role of the measures you take to promote and advertise. It is also often useful to evaluate the dynamics depending on the geographical distribution of users, as well as separately for different user segments.
If the growth dynamics is negative, then it is necessary to engage more actively in promotion and advertising. We will tell you more about this in a future publication.
The number of unique users during a certain period
So, you managed to achieve a more or less sustainable audience growth, the project is warmly received by users and is gaining popularity. It's time to think about the degree of user activity: how many people a day launch your application? And a week? Per month? And we are talking about unique users. Three metrics answer these questions:
- DAU (Daily Active Users) : the number of unique users per day.
- WAU (Weekly Active Users) : The number of unique users per week. Do not try to get this metric by adding seven different DAUs - you will inevitably count several times those users who launched the application more than once during the week.
- MAU (Monthly Active Users) : the number of unique users per month. The warning is the same as with DAU - this is not the sum of smaller metrics, but a parameter that is independently measured.
In fact, each of these metrics is calculated from one common database, which collects statistics for all application launches. The uniqueness of users can be determined, for example, by assigned ID or username / password pairs.
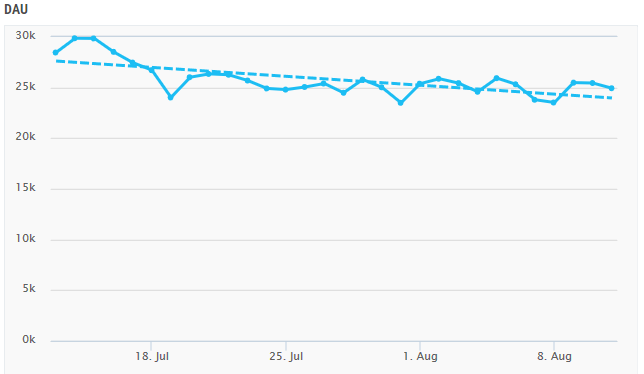
You can also compute the derived metric Sticky Factor = DAU / WAU or DAU / MAU. Its name can be translated as "the degree of stickiness." It characterizes regular use.your application for a week or a month, that is, it allows you to evaluate how much people like your application based on frequency of use. If all users run the program every day, then the DAU will be equal to both WAU and MAU, and their ratio will be 100%. But this does not happen, and therefore Sticky Factor allows you to evaluate how often people access your application for a week or a month. It is logical that a decrease in these indicators is an unpleasant signal that speaks of cooling the audience.
Session
A session is the time that a user spent in a mobile application from the moment of launch to the end of its use. As applied to sessions, usually two metrics are removed:
- The total number of sessions per period .
- Average Session Length (ASL) : The arithmetic average of all session lengths over a time interval. It is calculated by the formula:
ASL = T / N, where T is the total duration of sessions for the period, N is the total number of sessions for the same period.
This metric may indicate how interesting it is for the user to spend time in the application. That is, it is an indirect criterion of quality. In addition, if your application has paid content, but with an increase in the average duration of the session, the likelihood that the user decides to pay also increases. In most projects, paying users spend more time in the application than non-paying.
However, do not chase the high values of this metric, because it strongly depends on the type of your application. For example, for games this indicator is quite critical, and the more it is, the better. And for widget applications or fitness trackers, this figure will be insignificant, since for the most part they work in the background. It is much more important to know which screens the user visited during the session . Thanks to this metric, you can determine the sections of your application that are most interesting to users. And at the same time you will find out which ones you can completely remove and not continue to engage in their development.
Very useful metric - on which screen the user session ends. This indicator is important, for example, if you have authorization in the application. It often scares away users, especially if the application does not allow you to see the content, but first requires a username and password. In this case, the session will most likely end on the registration screen. If you add some content before authorization, then thanks to this metric you will immediately see the result.
Another example: if you have a product order form, consisting of 3-4 screens, then this metric will show at what step most users leave the application. As a solution, reduce the number of steps, optimize their order or design.
Interface Interactions
Trying to raise the values of certain metrics, very often you have to adjust the user interface and change the functionality of the program. You can evaluate the effectiveness of these steps using A / B testing (real-time testing, when a group of users is offered one version of the functionality / content, and the rest of the users are offered a different version). In our case, testing involves rolling out a new version of the application with a changed UI for some control group of users. The rest continue to use the current version. And we register how the control group responds to innovations by taking metrics of interaction with the application interface: for example, which of the two buttons gives a higher conversion to a purchase, in which place is it better to show popupasking to leave feedback about the application, etc. You can also use third-party services for A / B testing, for example, Apptimize , Optimizely , Mixpanel .
With the help of the collected statistics, you can also find out how much certain functions of the application are in demand, how many users interact with the application without connecting to a network, and much more.
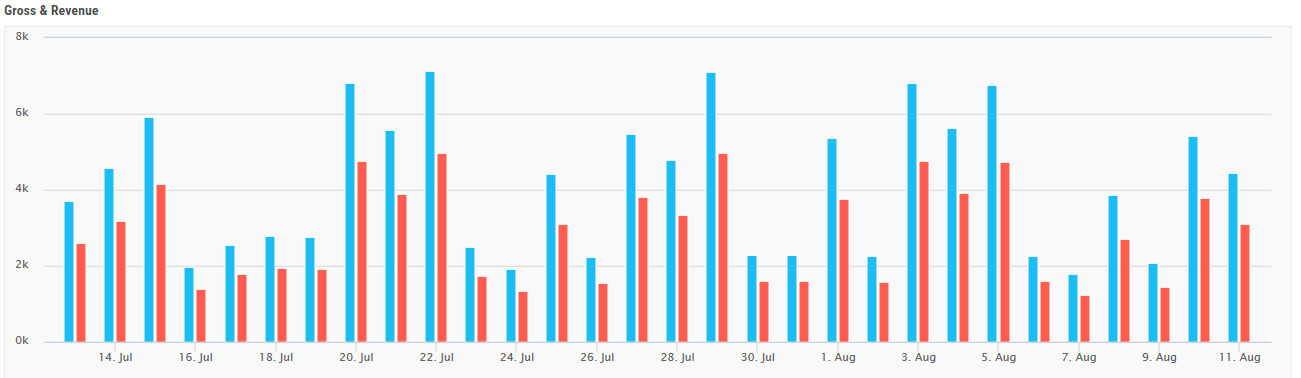
Finance
This is one of the most interesting and important groups of metrics. If you plan to make money using your application, then you need to pay close attention to registering these metrics and monitoring the dynamics of their changes.
The first thing that comes to mind is the total amount of payments for the period, Gross . However, keep in mind that this is gross income, from which you still have to subtract the share of the store through which you distribute the application. But after the deduction, we get the Revenue metric , which reflects the amount credited to your account.
Suppose your application itself is free, but some of the content is available only for money - you distribute it according to the in-app purchases model. To develop the application and increase revenue, we need to knowhow many unique users pay for a given period . For example, how many people bought game tokens, gold shells, more powerful spells, access to advanced analytics, beautiful design, or other paid goodies you offer per month.
The following metric is a derivative of the previous one: what proportion of payers make up the total number of unique users (for the period), Paying Share. Our unattainable ideal is 100%. Although in reality everything is usually much more modest. If this indicator starts to fall, then users are already fed up with the available paid content, and it's time to either diversify it or play with discounts. On the last point, there are many different tactics. For example, you can give discounts on weekends and holidays. You can create a stir by temporarily dropping prices, and as soon as the number of downloads grows substantially, prices can again be returned to the previous level. You can give discounts on coupons, you can offer to complete some simple quest. Another option: "first discount 5,000 downloaded on the night of Ivan Kupala." If your portfolio has other applications with paid content, then you can use package discounts when downloading two or more of your products. In general, there are many options for using discounts.
In addition to the number of payers, we are also interested in the specific number of payments per user, Transactions by User . This metric is calculated by the formula:
TBU = T / PU, where T is the total number of payments (transactions) for a certain period, PU (paying users) is the total number of payers for the same period.
If TBU> 1, then some users have made more than one purchase.
The following important metrics are ARPU and ARPPU:
- ARPU (Average Revenue Per User) : average profit per user per period. It is calculated by the formula:
ARPU = Gross / DAU, or Gross / WAU, or Gross / MAU.
Please note that this metric operates with the ALL audience of your application, that is, it is a kind of assessment of the effectiveness of the entire project. Its value is affected, first of all, by the attractiveness for users of the pricing policy of your application. - ARPPU (Average Revenue Per Paying User) : average profit from one paying user per period. It is calculated by the formula:
ARPPU = Gross / PU, where PU is the total number of unique users who paid for the content in the application for a certain period.
This metric allows you to evaluate the specific profitability of this segment of your audience. And the dynamics of changes in ARPPU gives us a signal about the attitude of payers to the price / quality of paid content. For example, lower prices will lead to a decrease in ARPPU, but it can raise ARPU, as some of the users who were previously not happy with the price level may start buying. And as a result, the effectiveness of the project as a whole will increase. But still, this is not the best scenario, where it is better to achieve simultaneously the growth of both of these metrics. Say, increasing the interest of the audience with the help of new or better content without lowering prices.
Dependence of Paying Share and ARPPU changes: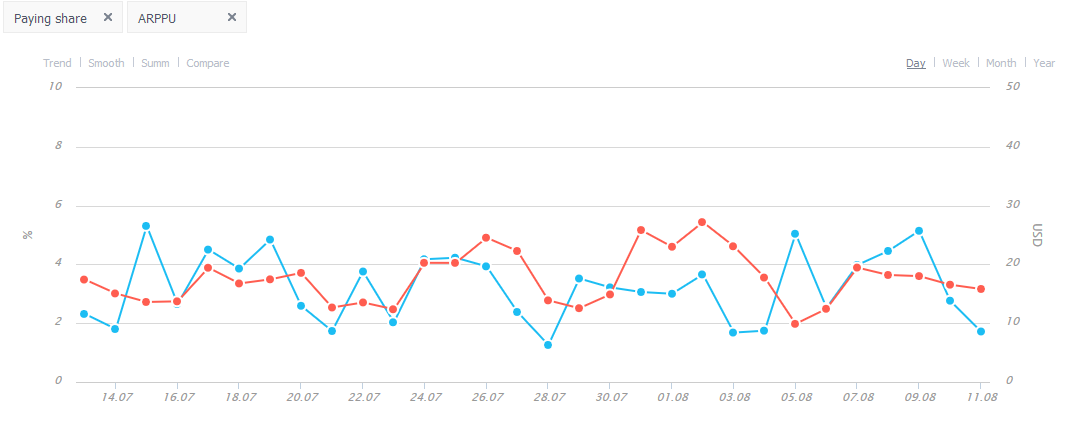
Speaking about the profit received from users, one should not forget how much it costs us to attract them. In the end, the first must be greater than the second, otherwise what is the point of all this? As a metric, the cost of one application installation (CPI, Cost per Install) is used here . It is calculated by the formula:
CPI = A / I, where A is the cost of advertising, promotion and marketing, I is the number of application installations.
This metric can be calculated both for the entire duration of the project, calculating the current cost of attracting the user, and for certain periods, determining the effectiveness of specific advertising campaigns or measures to promote the application.
And we conclude our review with the LTV (Lifetime Value) metric- This is the specific profitability of the user throughout the entire period of use of the application. There are many ways to calculate LTV, but for starters you can use the following formula:
LTV = ARPU * Lifetime, where Lifetime is the average duration of application use from the first launch to the last. For example, if a user first logged into the application on January 1, and the last time on August 15 and did not use it anymore, then Lifetime is 7.5 months for him. Summing up the Lifetime for all users and dividing by their total number, we get the average value of this metric, which will be used in calculating LTV.
Please note that when calculating LTV, the Lifetime multiplier must be a multiple of the period for which the ARPU is calculated. If you took ARPU for a month, then Lifetime will be measured in months, but not in days or weeks. Say, if your application has a monthly ARPU of $ 5 and a Lifetime of 3 months, then LTV = $ 5 * 3 = $ 15.
This metric is one of the cornerstones for evaluating the effectiveness of your project. If LTV is less than CPI, then the project is unprofitable without any “if” and “let's look in a different context”: you spent more on attracting the user than you received from him for all the time that he used your application. Therefore, LTV must be constantly monitored and immediately responded to the downward trend of this metric. Obviously, you can increase LTV using one or both factors, achieving an increase in the average profit per user for the period and / or increase the average duration of use of the application. For example, you can reduce the outflow of users by increasing the attractiveness of the application; reduce attraction costs by choosing more effective channels; increase the value of purchases by raising prices and stimulating the need for paid content.
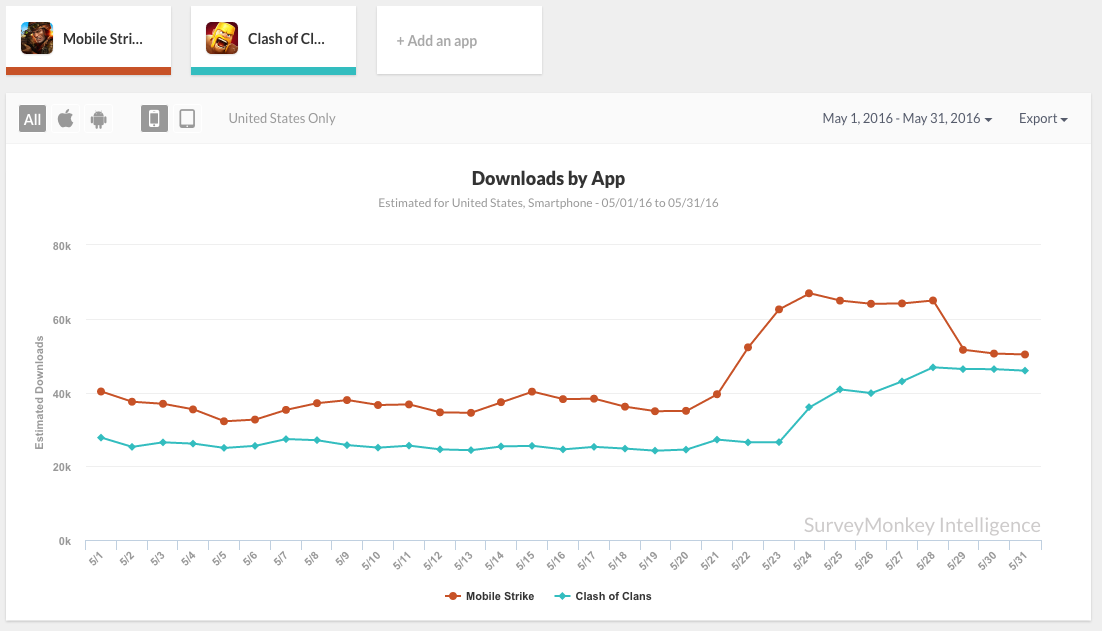
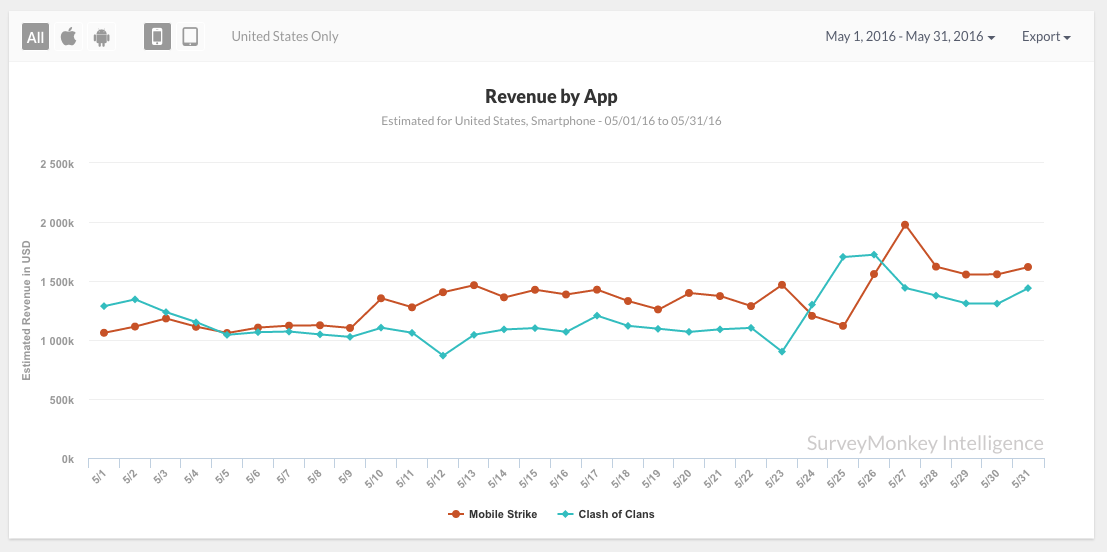
Finally, we want to give an example of metrics for two popular games: Mobile Strike and Clash of Clans. The summary data for versions for Android and iOS in the United States. If you make mobile games, you can focus on their metrics, as on the top products in this class of applications:
- Number of downloads: 30-50 thousand per day
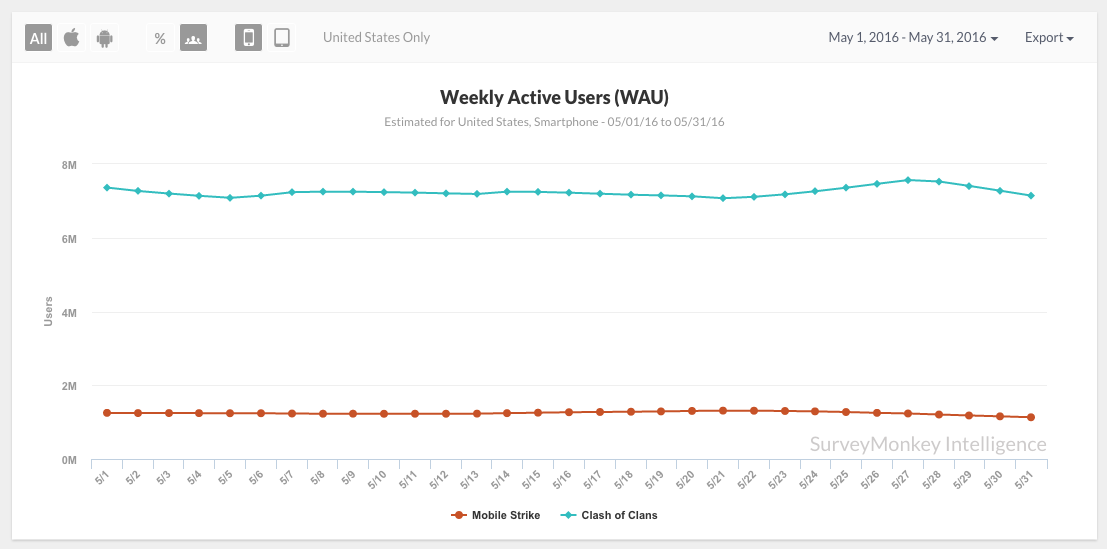
- Weekly Number of Unique Active Users (WAU): 1.2-7 Million
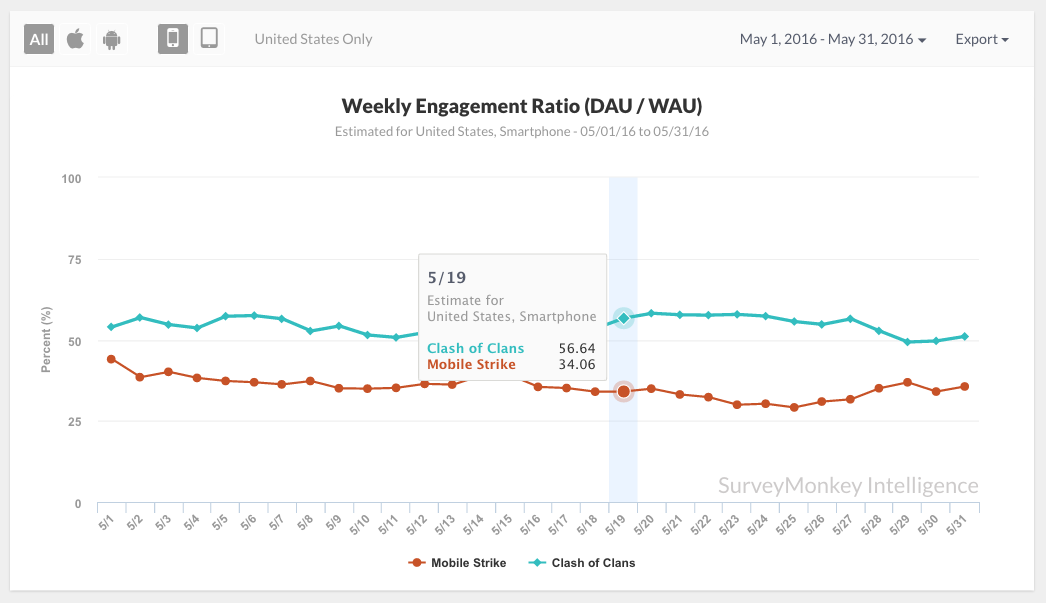
- The ratio of daily and weekly number of active users (DAU / WAU): 30-60%
- Daily profit: 800 thousand - 2 million dollars
More details on screenshots
Number of downloads:
Weekly number of unique active users (WAU):
Ratio of daily and weekly number of active users (DAU / WAU):
Daily profit:
Weekly number of unique active users (WAU):
Ratio of daily and weekly number of active users (DAU / WAU):
Daily profit:
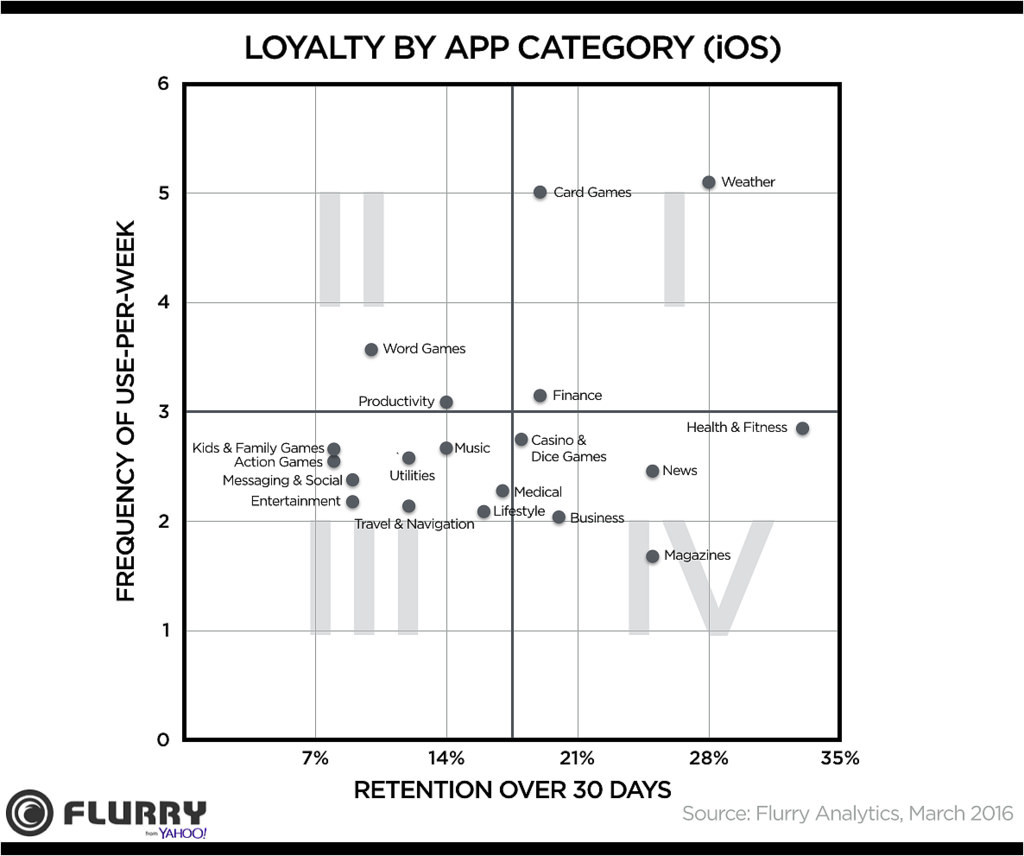
The matrix of two indicators - 30-day retention and frequency of use per week - for different categories of applications according to Flurry analytics system:

About analytics systems
There are a fairly large number of them, but Google Analytics , Flurry and App Annie are the most popular among mobile application developers . For the first time you will have more than enough of their capabilities. All the tools offer developers SDKs for iOS, Android and Windows Phone, which are easily integrated into the finished project. Let's consider in more detail.
Google Analytics

Google Analytics is a very powerful and completely free tool for taking metrics and subsequent analysis. Initially, it was created for web applications and sites of various levels of complexity, therefore it is not very convenient to use with mobile applications, however, it copes with the solution of basic tasks with a bang.
Interface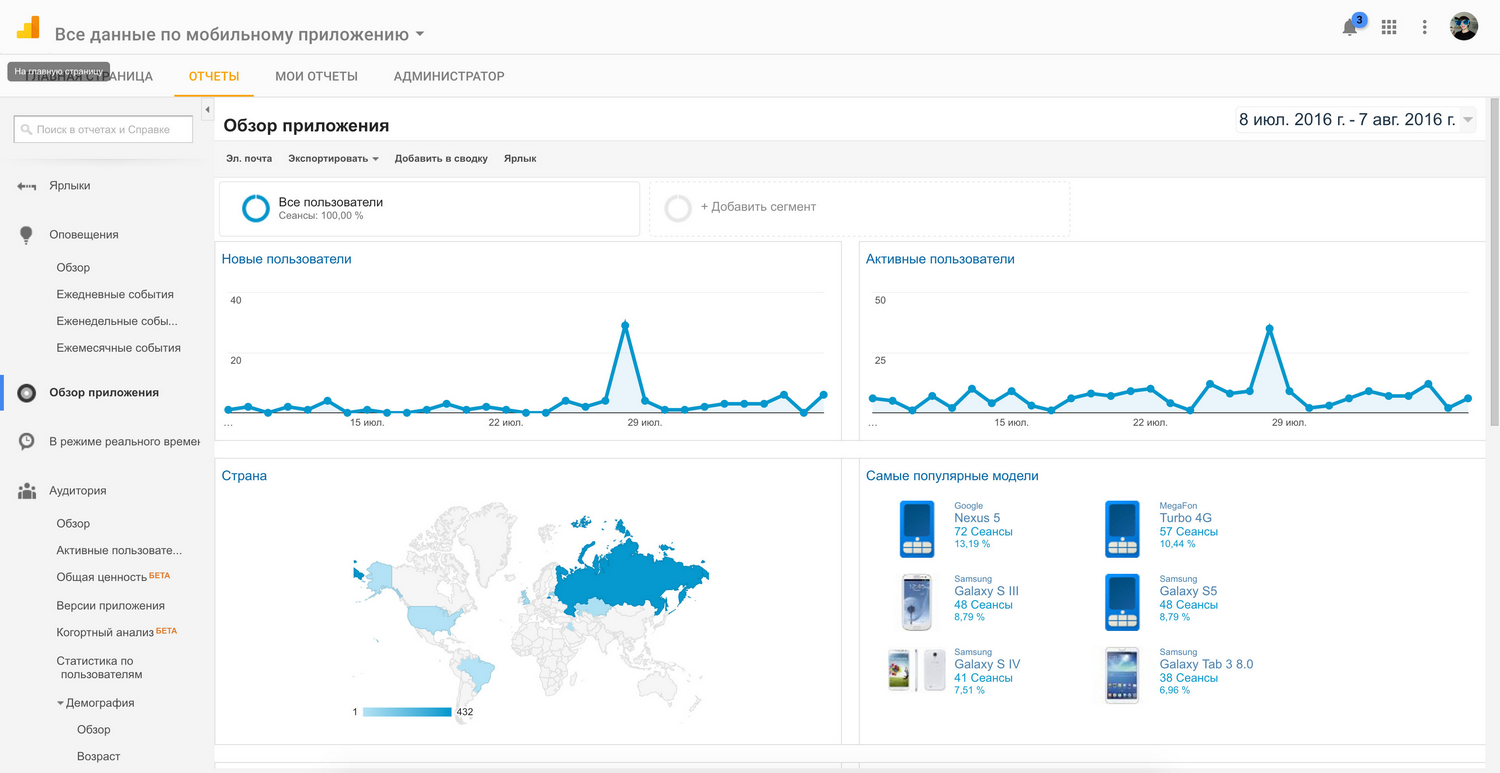
Mobile developers are especially interested in the "Real-time" section. Here you can see the number of users of the mobile application online, as well as the events that you will track.
In general, Google Analytics is most suitable for programmers and indie developers.
Flurry

This tool was originally created for mobile applications, so with them it is more convenient to use. Like Google Analytics, Flurry is free to use. The interface does not look too congested, this is a clear plus compared to GA.
Interface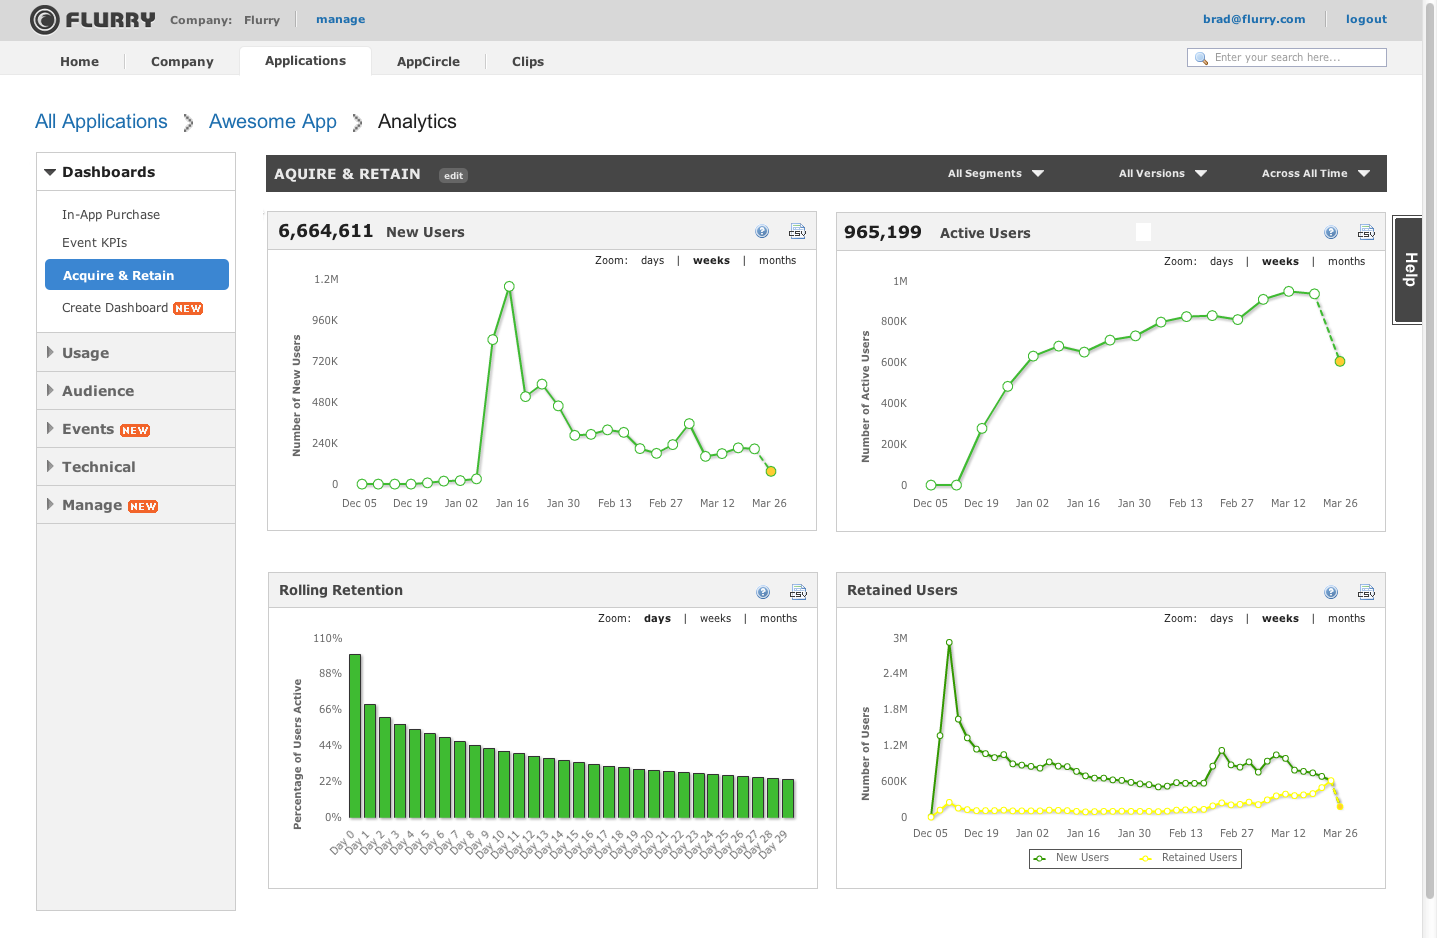
Flurry focuses on tracking user behavior, so most reports out of the box are somehow related to this area.
This tool is more suitable for marketers and analysts.
App Annie

This service has a free basic functionality, which is enough for beginner developers. But if you want to shoot a wider range of metrics, you have to pay . Classic interface: the navigation bar is on the left, and the content is conveniently arranged.
Interface
In general, this service can be equally useful for both developers and marketers with analysts.
Google Analytics and Flurry provide all the necessary basic tools for monitoring mobile applications. The free functionality of App Annie is somewhat limited, but they have two paid programs with much more features - for medium-sized companies and Enterprise.
| Google analytics | Flurry | App annie | |
|---|---|---|---|
| Download Source Analysis | + | for a fee | |
| User analysis | + | + | for a fee |
| Analysis of various platforms | + | for a fee | |
| Conversion map | + | + | for a fee |
| Analysis of the effectiveness of advertising and attraction | + | + | for a fee |
| User Behavior Analysis | + | + | for a fee |
| Financial performance | + | + | for a fee |
| Active users | + | + | for a fee |
| Cohort analysis | + | + | for a fee |
| Ability to create a panel with your own set of reports | + | + | |
| Top developers | + | ||
| Top apps by categories and sites | + | ||
| Revenue Top Applications | for a fee | ||
| Retention of top apps | for a fee | ||
| Using top apps | for a fee | ||
| Top Application Audience | for a fee | ||
| Top Application Marketing | for a fee |
Summary
Mobile app analytics is a very important part of the project life cycle. It is vitally important for individual developers and small studios to keep abreast of their projects, nurture them and immediately respond to negative signals that manifest themselves in worsening metrics when every hour is important at the start and global milestones of the project.
The described analytics systems are only part of the arsenal of tools that facilitate the work of many studios and independent developers. Today, the creation of successful applications requires accelerating the development process, using convenient and functional tools. Based on this, we are developing Scorocode, turning it into a useful, and for some, an indispensable tool for developing mobile applications.
Good luck with your development and high revenue.