About the Importance of User Stories
- Transfer
Hello dear readers.
Today we would like to talk with you about the important aspect of flexible project management, but not about pure Agile, but about project planning and iterations. We will talk about the genre of "User Stories", which is dedicated to a very successful book in the West by Jeff Patton with a foreword by Martin Fowler:
In the article, the text of which is waiting for you under the cut, we translated "User Story Mapping" as "visualization of functionality." The option is taken from a very interesting book by Boris Wolfson " Flexible project and product management ", also published in our publishing house.
So, the author of the article read Patton's work and decided that everyone should do this. How convincing examples he gave is for you to judge.
One of the key goals in project planning is to collect requirements together. But it is often difficult to decide where to start and what to focus on. Functional visualization (story mapping) is a fascinating work where all team members participate in the formation of a requirements list (backlog) - they paste the cards on the wall, and do not write a boring 100-page specification.
This way of visualizing functionality was invented by Jeff Patton , and Shirag Doshi told me about it . I believe that this is a very effective and useful way to fix the requirements at the stage of designing a project.
We draw a functional map
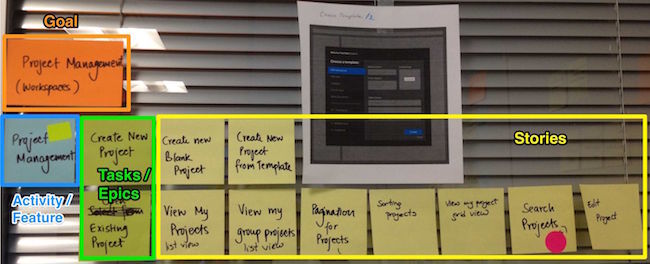
Functional visualization is a top-down way of collecting requirements that are presented in tree form. Before starting the visualization, you need to outline the whole project for yourself. To do this, set goals. To achieve the goal, you need to perform certain actions. And to complete the action, the user must solve the problem. When developing software, specific tasks can be formulated as user stories.
Map structure: Goals - Actions - Tasks - Stories
Let's consider an example of an application for working with an online store, within the framework of which we will single out a specific goal: 'find a product'. To better understand the whole process, we visualize this functionality on the map.
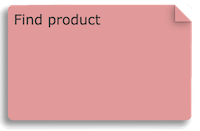
There are several ways to achieve the goal “find a product”, for example, “browse a tree with a product catalog”, “use a text search”, “see a promotional item”. Let us dwell on the second option - “view the tree with the catalog of goods” and visualize such functionality. '
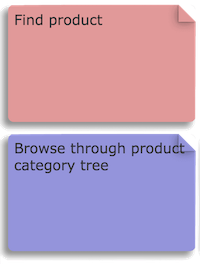
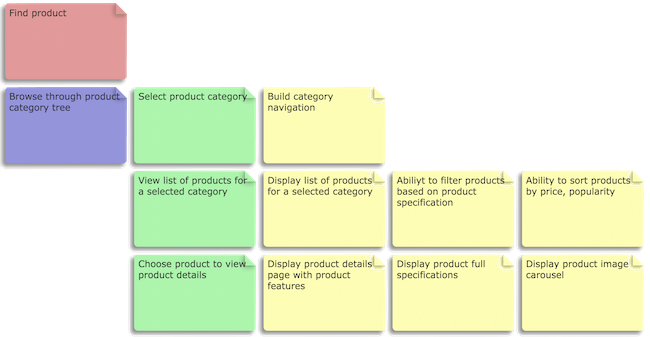
Next, in order to get to the desired product, the user must perform certain tasks,

and now these tasks can be formulated as user stories and proceed to the development of the program.
So we continue to elaborate on each functional branch in detail, starting with goals and building up an integral map. In my experience, a full visualization of functionality can take from three days to two weeks, depending on the size and complexity of the project.
For reference: here is a “branch” from one functional visualization, taken from a real project,
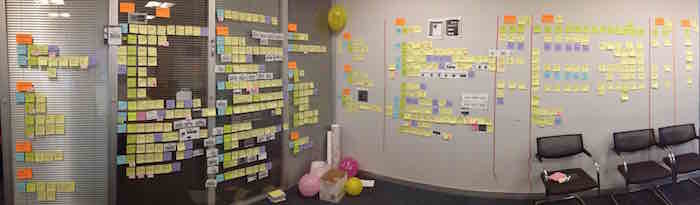
But here is how the whole map looks after five days of work:
So, having sorted out the functional visualization, let's discuss what are the advantages of this approach.
Benefits of functional visualization
Enriching the resulting map with additional information
Sometimes it is necessary to fix a relatively large amount of information on the project map - for example, to mark questions that arose during the work, alternative approaches ... all this also falls into visualization. Here are some practical examples:
On small stickers we put notes, write down assumptions, preliminary conclusions or questions.
Alternative methods of visualizing the functional
When visualizing the functional, it is important to first determine the structure and then refine it as necessary. It is necessary at the very beginning of the work to imagine the project structure and build on it. Sometimes a holistic structure is obtained only after two or three iterations.
One alternative structure is called custom travel. This approach helps to determine the requirements from the point of view of the user - for example, the buyer, seller, administrator, etc. In this case, the visualization takes the form User - Goals - Travel - Actions - Stories .
Another alternative, especially when developing NFR (non-functional requirements) may be this:
NFR - Requirement - History .
A complete map of large projects can contain up to six levels. However, in a typical project, usually 3 levels are enough.
Preparing for functional visualization
So, you are firmly determined to start the next project with functional visualization. Here's what you need for this:
I share my experience.
While doing functional visualization, I often encountered problems and overcame them. Further, some tips on how to avoid common mistakes and successfully deal with visualization.
Conclusion
Visualization of the functional is an effective mechanism for thinking through the requirements for the project, since it is very clear. Such an approach helps to come to a common understanding of the problem, to highlight the existing gaps in the backlog, to catch the interdependencies, more precisely to evaluate the relative sizes of the stages of the project. In the future, such visualization helps to correctly segment the project and adequately plan the time for preparing all releases.
Today we would like to talk with you about the important aspect of flexible project management, but not about pure Agile, but about project planning and iterations. We will talk about the genre of "User Stories", which is dedicated to a very successful book in the West by Jeff Patton with a foreword by Martin Fowler:
In the article, the text of which is waiting for you under the cut, we translated "User Story Mapping" as "visualization of functionality." The option is taken from a very interesting book by Boris Wolfson " Flexible project and product management ", also published in our publishing house.
So, the author of the article read Patton's work and decided that everyone should do this. How convincing examples he gave is for you to judge.
One of the key goals in project planning is to collect requirements together. But it is often difficult to decide where to start and what to focus on. Functional visualization (story mapping) is a fascinating work where all team members participate in the formation of a requirements list (backlog) - they paste the cards on the wall, and do not write a boring 100-page specification.
This way of visualizing functionality was invented by Jeff Patton , and Shirag Doshi told me about it . I believe that this is a very effective and useful way to fix the requirements at the stage of designing a project.
We draw a functional map
Functional visualization is a top-down way of collecting requirements that are presented in tree form. Before starting the visualization, you need to outline the whole project for yourself. To do this, set goals. To achieve the goal, you need to perform certain actions. And to complete the action, the user must solve the problem. When developing software, specific tasks can be formulated as user stories.
Map structure: Goals - Actions - Tasks - Stories
Let's consider an example of an application for working with an online store, within the framework of which we will single out a specific goal: 'find a product'. To better understand the whole process, we visualize this functionality on the map.
There are several ways to achieve the goal “find a product”, for example, “browse a tree with a product catalog”, “use a text search”, “see a promotional item”. Let us dwell on the second option - “view the tree with the catalog of goods” and visualize such functionality. '
Next, in order to get to the desired product, the user must perform certain tasks,
and now these tasks can be formulated as user stories and proceed to the development of the program.
So we continue to elaborate on each functional branch in detail, starting with goals and building up an integral map. In my experience, a full visualization of functionality can take from three days to two weeks, depending on the size and complexity of the project.
For reference: here is a “branch” from one functional visualization, taken from a real project,
But here is how the whole map looks after five days of work:
So, having sorted out the functional visualization, let's discuss what are the advantages of this approach.
Benefits of functional visualization
- The visual representation of backlog (the big picture) allows all those interested to work on the same plane, together to evaluate the volume and complexity of the work. In addition, this work indirectly helps to understand the scope of the project.
- When fixing requirements on paper, interaction improves and a common understanding of the work is formed.
- Since the time to develop a project is usually limited, the visualization of functionality helps you to dive deep into the project and focus on important aspects of the application. If you mark “desired” features as “secondary”, then the whole team saves development time.
- Interestingly, if you paste all the “stories” on the wall, it becomes easier for the team to correlate their sizes.
- Structuring the project in the form of a map helps to prioritize tasks and easily segment the backlog for releases, specifying the minimum viable version of each release. Segmentation can be horizontal or vertical: for example, we select a limited number of features, or we highlight many features, but in each of them we indicate the level of minimum viability.
- The visual map can be converted to backlog using special tools for Agile development, for example, Mingle .
Enriching the resulting map with additional information
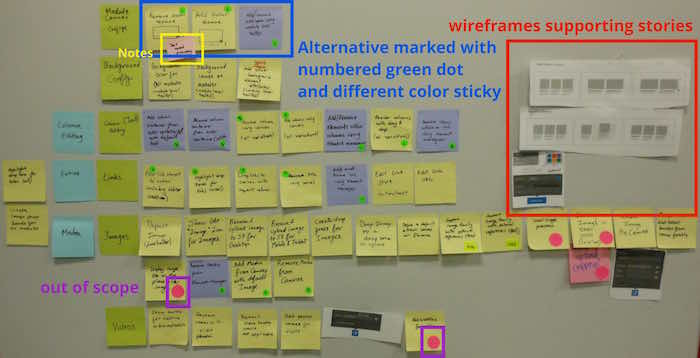
Sometimes it is necessary to fix a relatively large amount of information on the project map - for example, to mark questions that arose during the work, alternative approaches ... all this also falls into visualization. Here are some practical examples:
- Different colors indicate different levels of the map. For example, goals will be orange, features blue, stories green and stories yellow.
- Next to the corresponding area of the map is a wireframe model.
- We organize special notation using special stickers - for example, in the form of dots or stars:
- It is important to flag secondary features so that everyone has a general idea of the project
- It’s important to highlight alternative options so that UX is more saturated and non-core solutions are not too expensive
On small stickers we put notes, write down assumptions, preliminary conclusions or questions.
Alternative methods of visualizing the functional
When visualizing the functional, it is important to first determine the structure and then refine it as necessary. It is necessary at the very beginning of the work to imagine the project structure and build on it. Sometimes a holistic structure is obtained only after two or three iterations.
One alternative structure is called custom travel. This approach helps to determine the requirements from the point of view of the user - for example, the buyer, seller, administrator, etc. In this case, the visualization takes the form User - Goals - Travel - Actions - Stories .
Another alternative, especially when developing NFR (non-functional requirements) may be this:
NFR - Requirement - History .
A complete map of large projects can contain up to six levels. However, in a typical project, usually 3 levels are enough.
Preparing for functional visualization
So, you are firmly determined to start the next project with functional visualization. Here's what you need for this:
- A large conference room with free walls, which will be at your disposal for the entire term of thinking through the project.
- Colorful stickers, one sticker for each level.
- Bold markers to make labels on stickers easy to read from afar.
- Special stickers (dots or asterisks) - to fix additional information on the map.
- A marker board, in case it is inconvenient to glue wall stickers in some places.
- A good camera to take a picture of the whole map.
I share my experience.
While doing functional visualization, I often encountered problems and overcame them. Further, some tips on how to avoid common mistakes and successfully deal with visualization.
- At the stage of functional visualization, we get acquainted with the requirements for the product, and therefore be sure to fix all the possibilities together with the alternatives in order to avoid endless discussions.
- Going into details, we regularly prioritize so as not to waste time on unimportant topics.
- We regularly remove unnecessary stickers so that they do not turn into a huge boundless pile. We leave comfortable aisles along the walls.
- When working with stickers, we make sure that they do not bend or stick together throughout the project - otherwise it will be difficult to see them in photographs.
Conclusion
Visualization of the functional is an effective mechanism for thinking through the requirements for the project, since it is very clear. Such an approach helps to come to a common understanding of the problem, to highlight the existing gaps in the backlog, to catch the interdependencies, more precisely to evaluate the relative sizes of the stages of the project. In the future, such visualization helps to correctly segment the project and adequately plan the time for preparing all releases.
Only registered users can participate in the survey. Please come in.
The relevance of the book
- 74.6% Yes, the book is very necessary 56
- 17.3% Narrow topic, not interested 13
- 1.3% Read in the original, did not like it 1
- 14.6% Please print Boris Wolfson's book 11