How to write TK or communicate with a programmer in a clear language. Simple modeling and algorithmization
- Tutorial
Who this article is for: First of all, for managers, managers and all others who do not belong to the developer class, but nevertheless have to communicate with them and meet with misunderstanding when setting tasks for developing an ERP or online store, ACS, etc.
It may also be useful to the developers themselves as a mini FAQ for communicating with those who did not have the honor of “filling in” at least a couple of lines in their life.
The main motivation for introducing this or a similar FAQ statement of the problem is very simple and expressed clearly and clearly in the form of cash. Good programmers are expensive, and not worked out tasks take a lot of time to refine, fix, etc., which leads to tangible financial losses.

Warning 1:although the article has an applied meaning and touches on rather serious issues, it encounters "sarcasm".
Warning 2: I myself am not a professional programmer, but by the nature of my work when implementing ERP or developing a business environment, elaborating processes, etc. I develop and set tasks for programmers.
Warning 3: I will try to describe the process in a simple and accessible language that is understandable to those who are new to this area.
In one of my articles, I touched on the algorithmization of business processes, in other words, the construction of a model and its description by an algorithm or a logical language.
Take an example from the article:
Suppose we have an online store and we don’t have “similar goods” functionality according to the described scheme, and we want to set a task for our development department. The task is set by the Head of Sales.
The first thing you should start with is to formulate your “Wish list” as precisely as possible:
In the product’s card, for example, let's take an audio player, you should see a block with similar goods, namely goods that belong to the same group of goods, but at a price not lower than the price you’re viewing goods. The same should be displayed in the basket next to the product.
Take and draw on a piece of paper, and it’s better to print a screenshot from the product’s card and draw on it how it should look.
It would seem that everything, but it is better to take and draw a logical diagram.
You can do this on a piece of paper or in Visio included in the Office package.
It’s easy to draw a diagram, you’ll see it yourself now, we’ll draw it: The
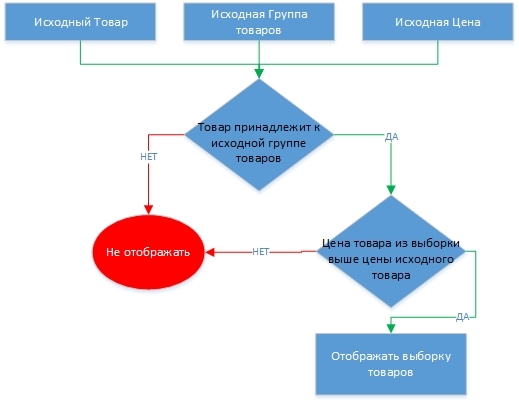
rectangles above are the initial data or the result of a decision.
Rhombuses are a decision to be made, YES or NO, a logical action.
So, we have the Price of the original product, the original group and the original product itself. Further, according to our idea, we make a selection from the product group identical to the original and the price is higher than the original product. And then stop right away, how much the product that we offer as an alternative can be higher than the original? Indeed, if we offer the buyer a player for 5tr and a top model for 50tr, he is unlikely to pay attention to it. But if you offer an option, say, for 6-7, well, up to 10tr, then perhaps the customer will choose the option and more expensive, respectively, will bring the store a big profit.
The first thing that comes to mind is to limit yourself to the threshold of "no more than double." Now, in what order to build a track from the proposals in the product card? There is no point in starting with the most expensive one, it’s more logical if the client starts comparing models, and is not immediately afraid of the high price. But to offer models at a price of 5020r, that is, a little more expensive, is also not there, the number of similar products is limited, say, 5pcs (will no longer fit). From here one more condition is added, "no more than twice, but no less than 10% -20%."
Draw up the model:

Already more interesting.But stop again. And we can show only 5 pieces of goods, but what is their price step? That is, the original player at a price of 5000r and other 5550r., 5505r, etc. That is a lot of goods, but we need to show different and only 5pcs. We think: our maximum bar is doubled, that is, 200%, minimum 20%, that is, we need to break this chain into 5 parts and approximately evenly.
Having thought and estimated sales statistics, the buyer’s movement on goods, etc. we do so, for example, 20% - 60% - 100% - 150% - 200%. Excellent, but there may not be a product with exactly such a price, that is, + 200%, therefore, you need to make sure that we select the closest one that is most suitable for the price, that is + \ -.
It seems that I took everything into account, once again we are thinking through all the nuances ...There is another one, but what if the product from the sample is not available? That it clearly should not be shown, we add this condition.
Drawing a model:

What else could happen? Well, for example, there may be no product at the sample, or it may turn out to be not 5 but say 2 or 3. In this case, we display what is, if the product that does not fit at all, we display the nearest one or a product from a similar group. If we don’t like it, then we can not display the block at all, but this is not a buzz.
Add these conditions:
It seems that all visible options are provided.
Now put everything together. We take our leaflet with the image of the insert in the product card and the basket, add the scheme and formulate the scheme with the text:
Add the “similar products” block to the product card and basket, according to the schematic drawing.
The logic of the work in the diagram and text:
The text will be a training, I think it will not be difficult to write it ourselves.
PS
Add in the comments what nuances I could miss and is this option suitable for you as a developer from the category better than before?
Download the scheme in Visio Yandex disk
It may also be useful to the developers themselves as a mini FAQ for communicating with those who did not have the honor of “filling in” at least a couple of lines in their life.
The main motivation for introducing this or a similar FAQ statement of the problem is very simple and expressed clearly and clearly in the form of cash. Good programmers are expensive, and not worked out tasks take a lot of time to refine, fix, etc., which leads to tangible financial losses.
Warning 1:although the article has an applied meaning and touches on rather serious issues, it encounters "sarcasm".
Warning 2: I myself am not a professional programmer, but by the nature of my work when implementing ERP or developing a business environment, elaborating processes, etc. I develop and set tasks for programmers.
Warning 3: I will try to describe the process in a simple and accessible language that is understandable to those who are new to this area.
In one of my articles, I touched on the algorithmization of business processes, in other words, the construction of a model and its description by an algorithm or a logical language.
Take an example from the article:
Although a little delay and prescribe some rules.
1. Add related products.
If a customer buys, say, an audio player, do not forget to offer him headphones, a case, a memory card, etc.
2. Related products.
At this point, play on the rise. If the player selected by the client costs 5tr. You need to offer him a more expensive option with a lot of features.
This is the minimum of what needs to be done at this stage.
Suppose we have an online store and we don’t have “similar goods” functionality according to the described scheme, and we want to set a task for our development department. The task is set by the Head of Sales.
The first thing you should start with is to formulate your “Wish list” as precisely as possible:
In the product’s card, for example, let's take an audio player, you should see a block with similar goods, namely goods that belong to the same group of goods, but at a price not lower than the price you’re viewing goods. The same should be displayed in the basket next to the product.
Take and draw on a piece of paper, and it’s better to print a screenshot from the product’s card and draw on it how it should look.
It would seem that everything, but it is better to take and draw a logical diagram.
You can do this on a piece of paper or in Visio included in the Office package.
It’s easy to draw a diagram, you’ll see it yourself now, we’ll draw it: The
rectangles above are the initial data or the result of a decision.
Rhombuses are a decision to be made, YES or NO, a logical action.
So, we have the Price of the original product, the original group and the original product itself. Further, according to our idea, we make a selection from the product group identical to the original and the price is higher than the original product. And then stop right away, how much the product that we offer as an alternative can be higher than the original? Indeed, if we offer the buyer a player for 5tr and a top model for 50tr, he is unlikely to pay attention to it. But if you offer an option, say, for 6-7, well, up to 10tr, then perhaps the customer will choose the option and more expensive, respectively, will bring the store a big profit.
The first thing that comes to mind is to limit yourself to the threshold of "no more than double." Now, in what order to build a track from the proposals in the product card? There is no point in starting with the most expensive one, it’s more logical if the client starts comparing models, and is not immediately afraid of the high price. But to offer models at a price of 5020r, that is, a little more expensive, is also not there, the number of similar products is limited, say, 5pcs (will no longer fit). From here one more condition is added, "no more than twice, but no less than 10% -20%."
Draw up the model:
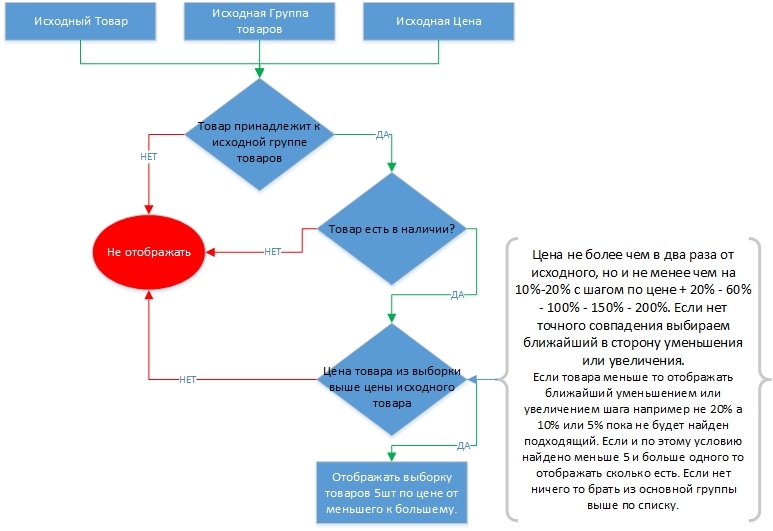
Already more interesting.But stop again. And we can show only 5 pieces of goods, but what is their price step? That is, the original player at a price of 5000r and other 5550r., 5505r, etc. That is a lot of goods, but we need to show different and only 5pcs. We think: our maximum bar is doubled, that is, 200%, minimum 20%, that is, we need to break this chain into 5 parts and approximately evenly.
Having thought and estimated sales statistics, the buyer’s movement on goods, etc. we do so, for example, 20% - 60% - 100% - 150% - 200%. Excellent, but there may not be a product with exactly such a price, that is, + 200%, therefore, you need to make sure that we select the closest one that is most suitable for the price, that is + \ -.
It seems that I took everything into account, once again we are thinking through all the nuances ...There is another one, but what if the product from the sample is not available? That it clearly should not be shown, we add this condition.
Drawing a model:
What else could happen? Well, for example, there may be no product at the sample, or it may turn out to be not 5 but say 2 or 3. In this case, we display what is, if the product that does not fit at all, we display the nearest one or a product from a similar group. If we don’t like it, then we can not display the block at all, but this is not a buzz.
Add these conditions:
It seems that all visible options are provided.
Now put everything together. We take our leaflet with the image of the insert in the product card and the basket, add the scheme and formulate the scheme with the text:
Add the “similar products” block to the product card and basket, according to the schematic drawing.
The logic of the work in the diagram and text:
The text will be a training, I think it will not be difficult to write it ourselves.
PS
Add in the comments what nuances I could miss and is this option suitable for you as a developer from the category better than before?
Download the scheme in Visio Yandex disk