November 21, 2015 at 18:29
Patent landscapes for startups
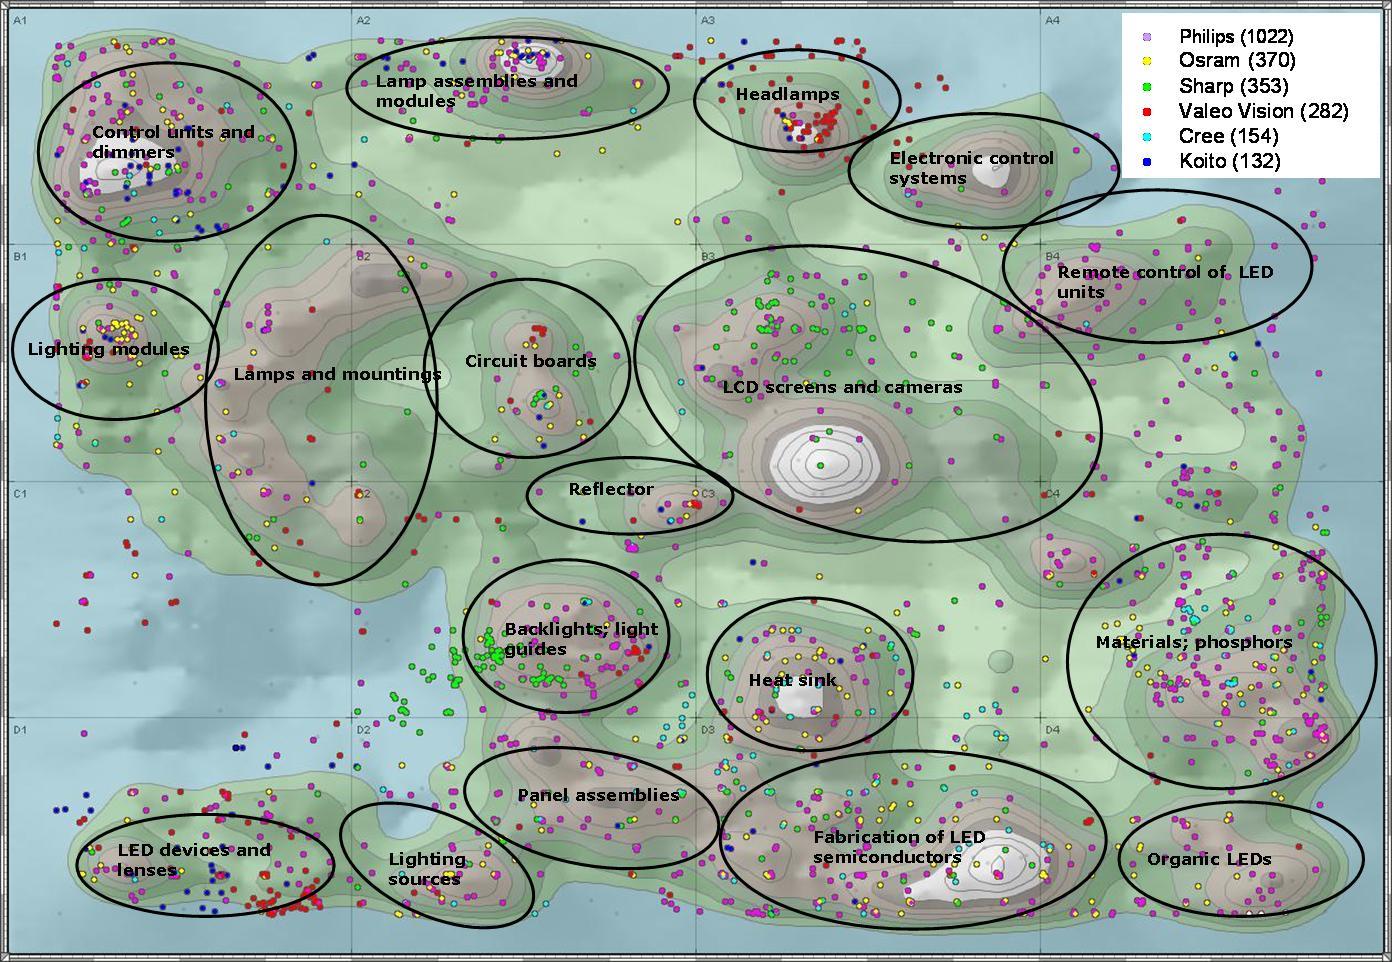
Patent landscapes are very difficult to prepare, unrealistically difficult. Dozens of hours spent searching for information, vast experience in the field of IP, expensive access to numerous data sources and tools, plus good technical and legal training. And the question arises: why is this even necessary? And then despondency ...
After reading the indicated difficulties, you probably were really depressed. However, these difficulties are mainly misunderstood and should not primarily affect the decision to create, and then analyze the patent landscape.
Patent landscape is a report on the state of patent activity in a particular technology in a given country, region or in the world. Typically, a submarine begins with a study of the prior art, i.e. from a search for information published in accessible databases in the world about tools for the same purpose as the solution or technology in question. The search results are then analyzed in order to provide answers to a number of questions specific to submarines, for example, who does what, who patents where, or when identifying trends in innovations, various solutions to a technical problem, searching for joint developments, etc. The main distinguishing feature of submarines is the visualization of results in order to better understand them, as well as visualize conclusions and recommendations based on the findings of the search and analysis.
An investor should understand the essence of your technical solution, you need information about it “in the palm of your hand”. What to invest in. At the very least, the information should be enough to understand what questions you need to ask as experts, to find development paths, suggest or help improve the business model. An investor does not always have a higher technical education, and even if he does, it is sometimes quite difficult to understand in detail the essence of a technical solution and evaluate its potential when working with technical documentation. It is long and hard. A person needs analytics and graphics.
Interestingly, the reality at present in IP is that the press makes a lot of hype about patents and lawsuits, about patent wars and trolls. They constantly write about fabulous amounts, but so far no one has calculated the real costs due to the “inaction error”, in which startups simply do not have enough good information to quickly make a decision in IP and identify opportunities. Having the right information is easier to ask the right questions in a timely manner, or to miscalculate the market where it is moving.
The purpose of research may be to discuss company policy, strategic research planning, or technology transfer.
What can be understood and undertaken by analyzing the patent landscape?
1. To identify the leading countries in which they are engaged in research in the analyzed area.
For example, you are developing an exoskeleton in Russia. As a result of the research, you collect a lot of useful data about the effectiveness of using exoskeletons for medical purposes for the rehabilitation of people with diseases of the musculoskeletal system and impaired locomotor functions, constantly improving your device. And you want to understand, in which countries are the developments concentrated? Maybe in the magazines of these countries it is worth trying to publish or establish cooperation with experts, or maybe find investors.
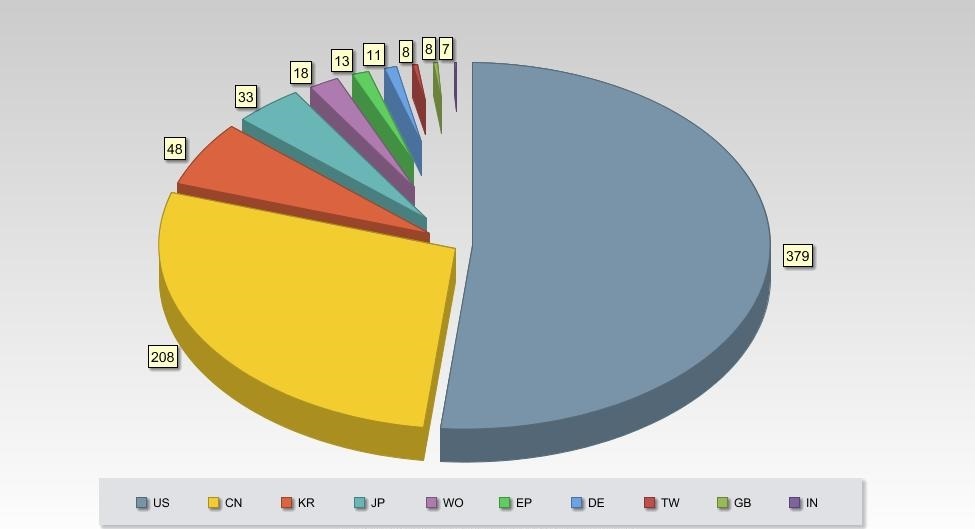
Markets of found countries are perceived by companies as priority ones. Inventive activity in these countries reflects the market strategy of companies seeking to monopolize their IP in these countries. The degree of interest of companies in the market of each individual country is proportional to the number of documents published in that country.
2. Identify companies that have key technologies in their area of interest and their relative strengths in IP.
Suppose that you are developing biometric technologies that are actively used in areas related to the security of various objects, with access to information and material objects, as well as in tasks of unique identification of a person. Moreover, the main area of activity is cooperative biometric methods (requiring the interaction of an identification system and a person, for example, recognition by the iris of the eye, by fingerprint, etc.).
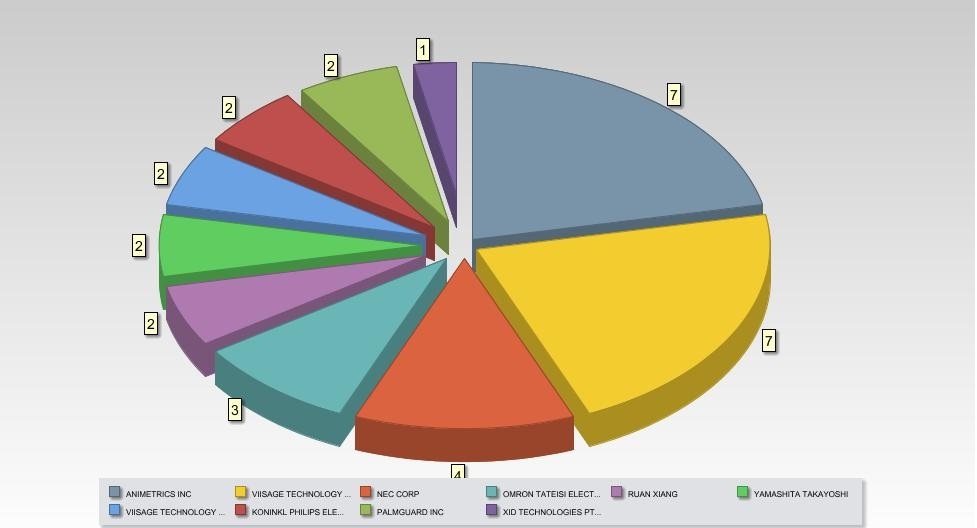
It should be borne in mind that not all patent sources in this field are reflected in these diagrams, and a graphical analysis is performed on a pre-selected pool of patents, which was prepared according to the generated set of terms and regular expressions in a particular area of interest.
The pie chart in the figure is divided into sectors of different colors depending on the applicant / patent holder. The size of the sector is determined by the number of applications for patents and patents in which these applicants / patent holders are present. This diagram allows us to conclude which companies or organizations are interested in and most intensively develop the technology being analyzed.
3. Identify the inventors who are most active in the direction.
Imagine that you are developing a product that is a web alternative to standard application packages for working with documents without the need for installation on a personal computer. Users are given the opportunity to work through the web client, as well as through mobile applications for the iOS and Android platforms. And you want to know the inventors who work quite productively in this area. Obviously, you won’t be able to find everyone, but you can get some statistics. This information is taken from both patent and non-patent sources. Who knows, you might find yourself among them.
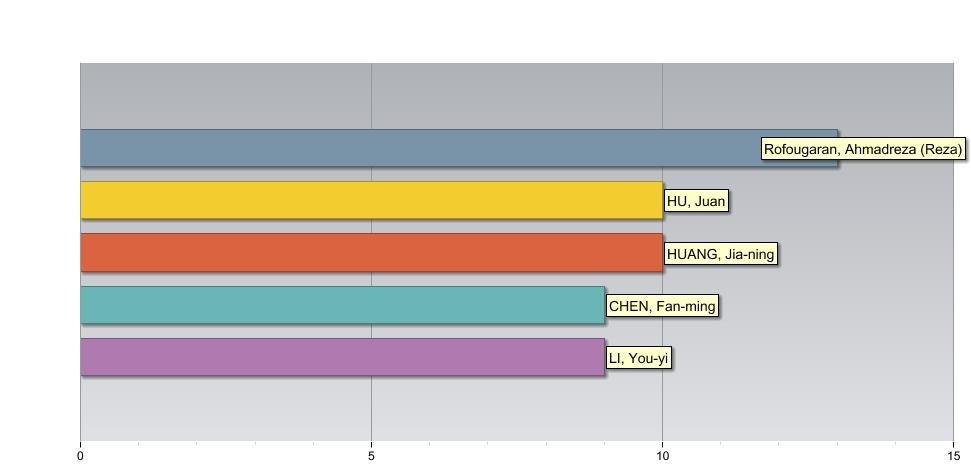
The diagram in the figure includes horizontal columns of different colors, depending on the inventor. The size of the column is determined by the number of applications for patents, patents and publications in which these inventors are present.
4. To detect white areas that are not sufficiently covered by patents, in which there is an opportunity to develop in terms of IP.
Imagine again that you are developing a software product that is designed for multi-point design and analysis of aircraft, taking into account design parameters and structural limitations in a wide range of flight conditions and the geometric complexity of aerodynamic configurations, and the aerodynamic design technology based on it.
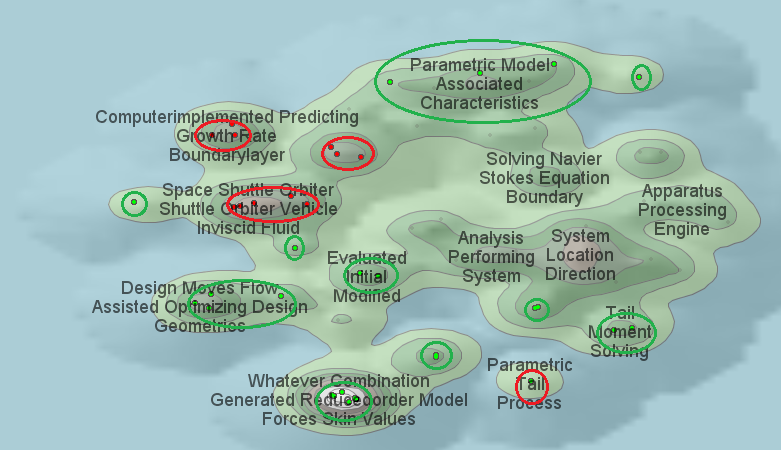
The map allows you to see how close to each other the patent documents of various patent holders are located and how they are distributed in the areas of technology development.
The map shows the patent documents of 2 companies, occupying the first and second places in the list of leading patent holders. It is worth noting that Airbus is developing the largest number of technology development areas.
In fact, I showed only a small part of the possibilities. You can also find the top leading magazines, IPC indices, licensors, etc.
I hope that you are inspired and try to prepare the landscape yourself.
In preparing this article, the Thomson Innovation tool was used, which is a terrific assistant in preparing the landscape. But there are many tools that offer the same features. True, for analogs everything works quite crookedly or analytics is not so beautiful and useful.
It must be remembered that the key to creating a patent landscape is precisely the stage of data selection. Good analytics comes from good data. In this regard, some patent information visualization information systems are tied to specific databases of patents and patent applications, automating the collection of necessary data.