Combine analytics, metrics, direct and CRM in 10 minutes
Many companies use several external and internal IT systems or services, and their number is growing all the time: web analytics, online advertising, sales and task accounting systems, 1C and many others. The manager needs to understand at least how much money is spent on what, and what is the effectiveness of these costs. In this article, you will learn how we reduced the initial loading and mixing of data from these systems into QuBeQu from a few hours of a specialist to pressing a few buttons.
But why did it even take several hours? The fact is that QuBeQu is a universal system for analyzing and combining data, and allows you to simply enter data into Excel or Google Spreadsheets, or connect other data sources: databases, files, or third-party systems. But as a system “in which everything is possible”, it turns out to be too flexible and universal - you can do everything, but you need to know what to do. Even for an experienced user, setting up reports, dashboards and graphs according to Google Analytics, AmoCRM or any other system took several hours and required reliable knowledge of all QuBeQu sections: you had to create and configure a connector, come up with formulas for calculated indicators, build reports and graphs, collect them into dashboards and adjust the settings.
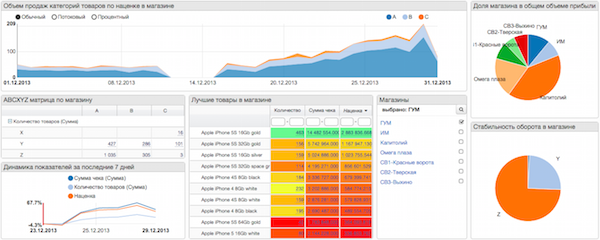
The modules allow you to get convenient and beautiful dashboards in a few minutes, just by setting the connection parameters. How it works? The module is a packaged system configuration, which our analyst designed and prepared. This configuration stores the connector setup, all indicators, reports, charts and dashboards. Before deploying the module, we ask you to set the parameters for connecting to an external system (CRM / analytics, etc.) and immediately check their correctness. Then the background process of module deployment starts: first all the module objects are unpacked: connector, indicators, reports, etc. After that, the specified connection parameters are inserted into the connector and data loading starts. After downloading, the data is attached to the settings of reports and parameters, and the module is ready to work!
 As a result, you can simply download the modules to the systems that you use, and immediately get a thoughtful and convenient standard configuration. At the same time, the data from these systems is not initially connected with each other, just in one place you can watch dashboards for all the data important to you. But this is where QuBeQu's flexibility comes in handy: all of these dashboards, reports, and metrics can be easily tied together. The simplest thing is to create your own dashboard by dragging the most interesting reports from ready-made ones there. Or, say, to connect data from different systems with calculated indicators - for example, if a sales plan is entered directly into the system, and the fact is loaded from CRM, it is easy to make a calculated indicator “percentage of plan fulfillment”. In addition, when the basic data structure is already configured, it is easy to add the loading of those fields from the connector,
Now we have modules ready for Google Analytics & AdWords, Yandex Metric and Direct, for AmoCRM. Instead of 1C, MySklad and Bitrix24 modules, we are still manually configuring the connector and gaining experience. We are also thinking about automatic data linking between modules, and other improvements. Technically, a module can be assembled from any configuration of the system, so if you have ideas for modules, we will be happy to hear!
But why did it even take several hours? The fact is that QuBeQu is a universal system for analyzing and combining data, and allows you to simply enter data into Excel or Google Spreadsheets, or connect other data sources: databases, files, or third-party systems. But as a system “in which everything is possible”, it turns out to be too flexible and universal - you can do everything, but you need to know what to do. Even for an experienced user, setting up reports, dashboards and graphs according to Google Analytics, AmoCRM or any other system took several hours and required reliable knowledge of all QuBeQu sections: you had to create and configure a connector, come up with formulas for calculated indicators, build reports and graphs, collect them into dashboards and adjust the settings.
The modules allow you to get convenient and beautiful dashboards in a few minutes, just by setting the connection parameters. How it works? The module is a packaged system configuration, which our analyst designed and prepared. This configuration stores the connector setup, all indicators, reports, charts and dashboards. Before deploying the module, we ask you to set the parameters for connecting to an external system (CRM / analytics, etc.) and immediately check their correctness. Then the background process of module deployment starts: first all the module objects are unpacked: connector, indicators, reports, etc. After that, the specified connection parameters are inserted into the connector and data loading starts. After downloading, the data is attached to the settings of reports and parameters, and the module is ready to work!
As a result, you can simply download the modules to the systems that you use, and immediately get a thoughtful and convenient standard configuration. At the same time, the data from these systems is not initially connected with each other, just in one place you can watch dashboards for all the data important to you. But this is where QuBeQu's flexibility comes in handy: all of these dashboards, reports, and metrics can be easily tied together. The simplest thing is to create your own dashboard by dragging the most interesting reports from ready-made ones there. Or, say, to connect data from different systems with calculated indicators - for example, if a sales plan is entered directly into the system, and the fact is loaded from CRM, it is easy to make a calculated indicator “percentage of plan fulfillment”. In addition, when the basic data structure is already configured, it is easy to add the loading of those fields from the connector,Now we have modules ready for Google Analytics & AdWords, Yandex Metric and Direct, for AmoCRM. Instead of 1C, MySklad and Bitrix24 modules, we are still manually configuring the connector and gaining experience. We are also thinking about automatic data linking between modules, and other improvements. Technically, a module can be assembled from any configuration of the system, so if you have ideas for modules, we will be happy to hear!