The choice of a procurement strategy and its implementation
- Tutorial
One of the main tasks of the company is to create and implement an effective strategy for working with the purchase of goods. The supply issue is one of the most painful issues for any business. Practice shows that this issue is also one of the least developed in most companies. At the same time, studies have shown that $ 1 invested in improving supply brings no less effect than $ 3 invested in sales development.
There are two main concepts that can be implemented when forming a procurement strategy.
1. That the size of the order is calculated through a business case, which takes into account the costs of the order itself, the cost of its storage, discounts for a batch, etc. This scheme is more typical for companies involved in the production and repair. Work on this scenario means that you may have short-term surplus goods, but it is economically feasible. The strategy uses the concept of “effectively invested funds” and is designed for a long implementation cycle.
2. That the product should be exactly where it is needed, exactly when it is needed, and its quantity should be exactly as much as is really necessary - no more, no less. The correct implementation of this concept means that the company effectively invests its funds in inventory, and this avoids extreme situations associated with both a shortage of goods (and missed sales) and an excess of goods (dead goods, which can only be sold at a discount) . This approach is more typical for trading enterprises. Work on this scenario means that you spend money exactly in the amount in which they should be spent - no more, no less. Designed to cover the current needs of the company in goods.
Below we consider the implementation of each of the strategies
Strategy 1: Replenishment according to the principle of economically sound order size
Specialists in inventory management, of course, have a well-known graph of the dependence of costs on the volume of the ordered consignment. On the presented interpretation (Fig.):
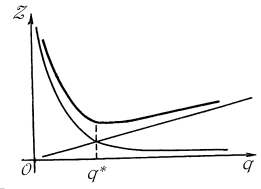
Q - order size; z - unit costs; line chart - unit costs for order storage; hyperbolic schedule - unit costs of placing an order; optimal schedule - total unit costs; q * is the point at which storage costs are equal to the costs of placing an order.
Obviously, with a certain order size, optimal conditions arise for the purchase. The optimum is clearly visible on the chart. This optimum is EOQ (economical order quantity).
Methods for calculating the economical order size (EOQ or Wilson model / Wilson /) are not applied in practice, although in the scientific literature on supply chain and inventory management these methods occupy significant volumes and are completely uncontested. The reasons for the neglect of business towards EOQ are obvious and “lie on the surface”. Firstly, the high complexity of the calculations, and, secondly, the low accuracy of the results.
In the EOQ formula and other analogues, it is proposed to directly determine the required order quantity at the lowest cost (Fig. 1). The correlation between costs and optimal size, of course, exists, but it is not so direct. At the same time, the EOQ system error is extremely large.
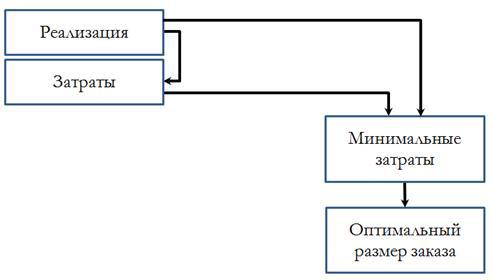
Fig. 1. The scheme of the calculation algorithm EOQ.
To improve the quality of calculations, it was proposed to use not a costly minimum, but a maximum of annual profitability (Fig. 2). For costs, margins and sales, a function is built of the dependence of profitability on the size of the order. On the function graph, the optimum point is determined. It is believed that this point corresponds to the most favorable order volume.
Using this method can significantly increase the accuracy of calculating the economically sound order size. But the complexity of calculations by the new methodology has increased. After all, now it is required to take into account the trade margin and all costs, and not just the costs of purchase and storage.
If we consider the optimal order size for each item to be ordered, then the labor involved in preparing orders will be a tremendous amount. An enterprise with a range of 10 thousand items and replenishing stocks every month would have to make 10 thousand calculations of the dependence of costs or profitability on the size of the order every month. Naturally, no one can afford such a luxury.
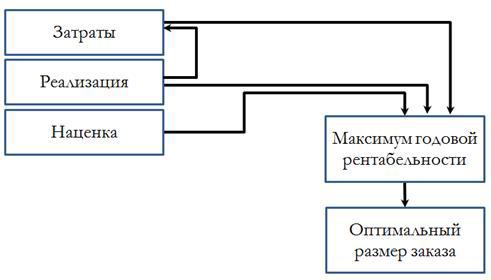
Fig. 2. The scheme of the algorithm for calculating the optimal order for profitability.
Solution. You can get rid of the high complexity of calculations if you use a two-stage technique. Then the complexity of the calculations will decrease hundreds of times (to an acceptable level).
At the first stage, the calculation is made not of the optimal order of a commodity item, but of the optimal lot size (Fig. 3). As a rule, one supplier supplies prefabricated lots - in one order several items of goods are completed at once. One lot consists of 5-10, and sometimes hundreds of items of goods. Therefore, if you make an economic justification for the size of the consignment of goods, and not each position, the number of calculations is reduced by the corresponding number of times.
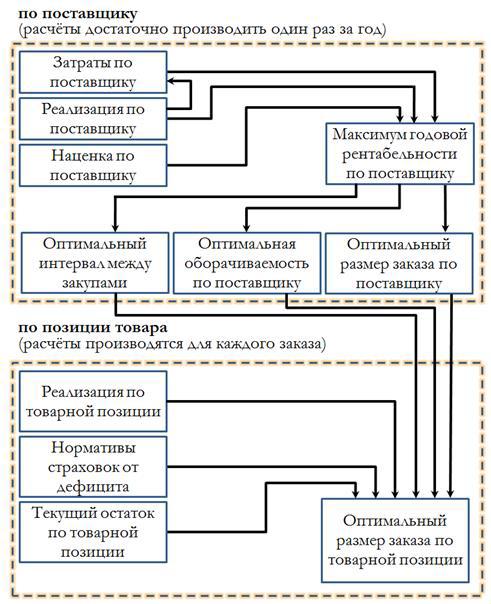
For costs, implementation and margin, a schedule is developed for the dependence of profitability on the size of the order. At the point of maximum profitability, the optimal order size is determined. And according to the optimal size of the order, you can find the appropriate turnover and (or) the best from the economic point of view interval between purchases.
If the demand for the goods of the analyzed supplier is subject to strong seasonal fluctuations, then it would be reasonable to use not a single end-to-end indicator for the whole year, but create a schedule in which, depending on the expected seasonal change in demand, the requirements for the size of the order (turnover) are adjusted during the year.
Having, after completing the work of the first stage, the standards of turnover, order size and (or) the interval between purchases, it will not be difficult for a specialist to calculate the necessary order volume for a specific position. It remains only to find out the expected implementation and current balances, as well as the size of the safety stock.
The methodology for finding order size by EOQ has too much error and, in addition, requires enormous labor costs. The methodology of finding the optimal order size by profitability improves the quality of settlements, but does not reduce their complexity. The methodology in which the process is divided into two stages (first, once a year, the optimal turnover is determined by profitability, the size of the collective order to the supplier or the interval between purchases, and then the calculation of the order size of the commodity item for each delivered batch) reduces the second problem to an acceptable level.
Strategy 2: Just In Time replenishment.
To implement this concept, managers responsible for procurement need to make daily calculations - for each outlet, to evaluate sales in future periods. Given the time of delivery of the goods, and based on the forecast of sales, the manager, starting from the current state of the balances, must evaluate how much current stocks are enough, and is it time to order the goods, so that by the time he arrives at the store, not only the old the party has already ended, but the overstock of the warehouse did not form.
Daily calculations need to be made, since the current demand and the delivery time of the goods, and the quantity of goods in transit can fluctuate - all these components must be taken into account, as well as the time factor.
One of the important components of the order is Safety Stock. Safety stock is an additional stock of goods formed in case of unforeseen circumstances. Whether it is a sudden increase in demand, a delay in a product’s journey, or a production problem, an insurance stock is needed so that the company can operate for some time (chosen by the operator) without interruption.
To understand the essence of insurance stock, we can offer an analogy: if your car's consumption is 10 l / 100 km, then for a trip of 200 km you will never fill exactly 20 l, but you will always refuel a little more for unforeseen circumstances - this is the insurance stock.
Safety stock is calculated either in a fixed volume for each outlet, or depending on the deadlines for delays in delivery, or depends on other factors (variability of demand). Sometimes, such a concept as “minimum stock balance” is used as insurance stock.
The second important component is time. Time is involved in generating sales forecasts and order periods. The universal concept is “logistic shoulder”, i.e. time for which the ordered goods will be delivered to the store. The
final formula for the order size is quite simple:
Order size (RP) = TO + TP - SZ - PP , where
THAT is the current balance. The size of the goods that you can dispose of. If you work with the possibility of reserving goods, then you will have to exclude reserves from the current balance;
TP - goods in transit. It is important to consider only the goods that arrive in the store during the time of delivery of the goods (logistic leverage);
SZ - insurance stock;
PP - sales forecast. It is calculated as the “Forecast of daily sales” multiplied by the number of delivery days (logistic leverage). It is important to consider that if the product has a pronounced seasonality, then daily forecasts should be adjusted for seasonal factors;
It is not difficult to use the formula: if the received “Order Size” is less than zero, then this means a shortage of goods in the future period, and РЗ * (- 1) = the quantity of goods that the supplier needs to order.
Thus, the manager can easily track the need for the delivery of goods exactly at the moment when it really became necessary.
When using this approach, the main difficulties arise due to the large amount of data and the need for a large amount of calculations. Calculations must be made daily in order to take into account fluctuations in demand, for each of the goods at each of the outlets, the volume of goods in transit, reserves and the calculated insurance stock. If you have an assortment of 5,000 SKUs and 5 stores, then you need to carry out (365 x 5 x 5000) about 9,000,000 calculations a year.
There are also problems associated with the correct forecasting of sales in the future, since the methods associated with the "manual" assessment usually have a large inherent error, which can offset all the advantages of other calculations. And professional tools are either expensive, or their daily use may be too complicated for managers.
Most companies use Excel to do this kind of calculation. We do not recommend doing this, since a large amount of calculations and the need for human participation in the formation of data for filling in excel will not sufficiently reduce the influence of the human factor on the calculation. And the consequence of working with excel is the ability to grow only through an increase in the number of managers.
Thus, we can find the answer to the question "how much goods and where to put?".
We recommend using highly automated solutions that are light enough for everyday use, aimed at solving a specific procurement problem and drastically reducing the human factor. One such system is Mycroft Assistant, http://mycroftbs.ru .
The second problem facing the company, which decided to correctly set the supply strategy, is the limited resources.
What should companies do when the demand is $ 10,000,000, and in fact there is only $ 3,000,000? What goods need to be purchased in the first place, and to which outlets should they be transported?
To find the answer to these questions, it is necessary to introduce a gradation of goods by the degree of their influence on the company’s activities. A more important product is a product that is most often taken, which brings more profit, and which should be in the assortment of the company. The most popular method is the clustering of goods by ABC groups, but it does not answer the question "what should I do if I don’t have enough money for all goods of group A?"
To solve these problems, there are several "cross-cutting" indicators that can be easily calculated for all products. These are indicators: turnover of goods and liquidity of goods.
The turnover of goods can be calculated as the ratio of the speed of sales of goods to the average stock for a certain period. That is, this is the period of time for which the average stock of goods in stock is sold, and, therefore, the time to return the invested money.
Turnover shows how many days are needed to sell the average inventory. It is defined as the ratio of the product of the average inventory and the number of days in a month to the turnover for this period.
In = (SrSt * Period) / ObProd , where
SrSt - Average inventory for the selected period,
ObProd - Sales for the selected period.
Period - the number of days in the analysis period
For example, the average stock of goods amounted to 100 pieces, and sales - 300 pieces. So, the turnover will be: 100 * 31/300 = 10.3 (days), i.e. It takes about 10 days to sell the average stock of goods.
Usually, the higher the turnover rate of the product (the lower the rate in days), the better for the company. This means that the goods are not stored in warehouses, and the incoming batch is quickly sold. Ideally, analyze the indicator in dynamics relative to previous periods. Thus, the more circulating the goods, the more preferable it is for purchasing.
On the other hand, the liquidity indicator approaches this issue, its logic is about the same - the faster the product leaves, the higher the indicator. And the conclusions from it are exactly the same: the more liquid the product, the more preferable it is to purchase.
To calculate the liquidity of stocks, it is proposed to consider the so-called “product exit” - the ratio of the amount of goods received to its sales - Usability Index. The index is considered for a certain period, by default - 1 year, but different companies can consider it differently.
In = (ObProd - ObPost) / ObProd , where
ObProd is the Sales volume for the selected period,
ObPost is the Revenue volume for the selected period.
The interpretation of the coefficient is proposed as follows:

A product is allocated separately, the remainder of which is in stock, but its sales are zero for the selected period — such a product is considered a “dead balance".
Thus, owning the set indicators, you can highlight the most significant products: Actively used (by liquidity), with a high turnover rate, as well as generally recognized indicators - profit and share in the company's turnover. Competent organization of procurement is the investment of working capital precisely these goods in the first place.
The difficulties associated with the use of presets are associated with the fact that each of the indicators must be calculated individually for each of the goods for each of the outlets at each formation of the purchase order. And even better - every day, in order to be able to control the current state of stocks in the company and to be able to respond in advance to changes in the status of the goods (so that it is possible to sell the goods at a discount through any marketing tools before they become “ illiquid ”). Thus, if you have an assortment of 5000 SKUs and 5 stores, then per year you need to carry out (365 x 5 x 5000 x 2) about 18 million calculation of indicators per year.
We recommend the use of highly automated solutions aimed at solving a specific procurement problem, which will be able to automatically monitor the current state of stocks and effectively form an order to the supplier based on current estimates. One such system is Mycroft Assistant, http://mycroftbs.ru .
Mycroft Assistant is an inventory management system that can help small and medium-sized businesses avoid overstocking and shortage of goods in stock, reduce costs and increase company profitability.
By analyzing the sales history and current balances, Mycroft Assistant generates a forecast and makes recommendations on what products should be purchased and what warehouse to bring them to. And also forms a plan of sales and purchases in future periods. The system replaces the “manual” work and work with excel, and allows the company to develop and work efficiently without attracting additional staff.
The system gives you recommendations on what you need to do in order to avoid an excess or shortage of goods at each of the outlets - where and how much goods need to be transported so that the company is ready to provide a level of service to its customers.
To draw up a sales and purchase plan, in fact, just click the button “Calculate plans” - the system will independently analyze the sales history, current balances, take into account factors affecting the movement of goods. As a result of the calculation, you will get a ready-made layout for quantitative and financial indicators.
With co-authorship with Vladimir Chemeris
There are two main concepts that can be implemented when forming a procurement strategy.
1. That the size of the order is calculated through a business case, which takes into account the costs of the order itself, the cost of its storage, discounts for a batch, etc. This scheme is more typical for companies involved in the production and repair. Work on this scenario means that you may have short-term surplus goods, but it is economically feasible. The strategy uses the concept of “effectively invested funds” and is designed for a long implementation cycle.
2. That the product should be exactly where it is needed, exactly when it is needed, and its quantity should be exactly as much as is really necessary - no more, no less. The correct implementation of this concept means that the company effectively invests its funds in inventory, and this avoids extreme situations associated with both a shortage of goods (and missed sales) and an excess of goods (dead goods, which can only be sold at a discount) . This approach is more typical for trading enterprises. Work on this scenario means that you spend money exactly in the amount in which they should be spent - no more, no less. Designed to cover the current needs of the company in goods.
Below we consider the implementation of each of the strategies
Strategy 1: Replenishment according to the principle of economically sound order size
Specialists in inventory management, of course, have a well-known graph of the dependence of costs on the volume of the ordered consignment. On the presented interpretation (Fig.):
Q - order size; z - unit costs; line chart - unit costs for order storage; hyperbolic schedule - unit costs of placing an order; optimal schedule - total unit costs; q * is the point at which storage costs are equal to the costs of placing an order.
Obviously, with a certain order size, optimal conditions arise for the purchase. The optimum is clearly visible on the chart. This optimum is EOQ (economical order quantity).
Methods for calculating the economical order size (EOQ or Wilson model / Wilson /) are not applied in practice, although in the scientific literature on supply chain and inventory management these methods occupy significant volumes and are completely uncontested. The reasons for the neglect of business towards EOQ are obvious and “lie on the surface”. Firstly, the high complexity of the calculations, and, secondly, the low accuracy of the results.
In the EOQ formula and other analogues, it is proposed to directly determine the required order quantity at the lowest cost (Fig. 1). The correlation between costs and optimal size, of course, exists, but it is not so direct. At the same time, the EOQ system error is extremely large.
Fig. 1. The scheme of the calculation algorithm EOQ.
To improve the quality of calculations, it was proposed to use not a costly minimum, but a maximum of annual profitability (Fig. 2). For costs, margins and sales, a function is built of the dependence of profitability on the size of the order. On the function graph, the optimum point is determined. It is believed that this point corresponds to the most favorable order volume.
Using this method can significantly increase the accuracy of calculating the economically sound order size. But the complexity of calculations by the new methodology has increased. After all, now it is required to take into account the trade margin and all costs, and not just the costs of purchase and storage.
If we consider the optimal order size for each item to be ordered, then the labor involved in preparing orders will be a tremendous amount. An enterprise with a range of 10 thousand items and replenishing stocks every month would have to make 10 thousand calculations of the dependence of costs or profitability on the size of the order every month. Naturally, no one can afford such a luxury.
Fig. 2. The scheme of the algorithm for calculating the optimal order for profitability.
Solution. You can get rid of the high complexity of calculations if you use a two-stage technique. Then the complexity of the calculations will decrease hundreds of times (to an acceptable level).
At the first stage, the calculation is made not of the optimal order of a commodity item, but of the optimal lot size (Fig. 3). As a rule, one supplier supplies prefabricated lots - in one order several items of goods are completed at once. One lot consists of 5-10, and sometimes hundreds of items of goods. Therefore, if you make an economic justification for the size of the consignment of goods, and not each position, the number of calculations is reduced by the corresponding number of times.
For costs, implementation and margin, a schedule is developed for the dependence of profitability on the size of the order. At the point of maximum profitability, the optimal order size is determined. And according to the optimal size of the order, you can find the appropriate turnover and (or) the best from the economic point of view interval between purchases.
If the demand for the goods of the analyzed supplier is subject to strong seasonal fluctuations, then it would be reasonable to use not a single end-to-end indicator for the whole year, but create a schedule in which, depending on the expected seasonal change in demand, the requirements for the size of the order (turnover) are adjusted during the year.
Having, after completing the work of the first stage, the standards of turnover, order size and (or) the interval between purchases, it will not be difficult for a specialist to calculate the necessary order volume for a specific position. It remains only to find out the expected implementation and current balances, as well as the size of the safety stock.
The methodology for finding order size by EOQ has too much error and, in addition, requires enormous labor costs. The methodology of finding the optimal order size by profitability improves the quality of settlements, but does not reduce their complexity. The methodology in which the process is divided into two stages (first, once a year, the optimal turnover is determined by profitability, the size of the collective order to the supplier or the interval between purchases, and then the calculation of the order size of the commodity item for each delivered batch) reduces the second problem to an acceptable level.
Strategy 2: Just In Time replenishment.
To implement this concept, managers responsible for procurement need to make daily calculations - for each outlet, to evaluate sales in future periods. Given the time of delivery of the goods, and based on the forecast of sales, the manager, starting from the current state of the balances, must evaluate how much current stocks are enough, and is it time to order the goods, so that by the time he arrives at the store, not only the old the party has already ended, but the overstock of the warehouse did not form.
Daily calculations need to be made, since the current demand and the delivery time of the goods, and the quantity of goods in transit can fluctuate - all these components must be taken into account, as well as the time factor.
One of the important components of the order is Safety Stock. Safety stock is an additional stock of goods formed in case of unforeseen circumstances. Whether it is a sudden increase in demand, a delay in a product’s journey, or a production problem, an insurance stock is needed so that the company can operate for some time (chosen by the operator) without interruption.
To understand the essence of insurance stock, we can offer an analogy: if your car's consumption is 10 l / 100 km, then for a trip of 200 km you will never fill exactly 20 l, but you will always refuel a little more for unforeseen circumstances - this is the insurance stock.
Safety stock is calculated either in a fixed volume for each outlet, or depending on the deadlines for delays in delivery, or depends on other factors (variability of demand). Sometimes, such a concept as “minimum stock balance” is used as insurance stock.
The second important component is time. Time is involved in generating sales forecasts and order periods. The universal concept is “logistic shoulder”, i.e. time for which the ordered goods will be delivered to the store. The
final formula for the order size is quite simple:
Order size (RP) = TO + TP - SZ - PP , where
THAT is the current balance. The size of the goods that you can dispose of. If you work with the possibility of reserving goods, then you will have to exclude reserves from the current balance;
TP - goods in transit. It is important to consider only the goods that arrive in the store during the time of delivery of the goods (logistic leverage);
SZ - insurance stock;
PP - sales forecast. It is calculated as the “Forecast of daily sales” multiplied by the number of delivery days (logistic leverage). It is important to consider that if the product has a pronounced seasonality, then daily forecasts should be adjusted for seasonal factors;
It is not difficult to use the formula: if the received “Order Size” is less than zero, then this means a shortage of goods in the future period, and РЗ * (- 1) = the quantity of goods that the supplier needs to order.
Thus, the manager can easily track the need for the delivery of goods exactly at the moment when it really became necessary.
When using this approach, the main difficulties arise due to the large amount of data and the need for a large amount of calculations. Calculations must be made daily in order to take into account fluctuations in demand, for each of the goods at each of the outlets, the volume of goods in transit, reserves and the calculated insurance stock. If you have an assortment of 5,000 SKUs and 5 stores, then you need to carry out (365 x 5 x 5000) about 9,000,000 calculations a year.
There are also problems associated with the correct forecasting of sales in the future, since the methods associated with the "manual" assessment usually have a large inherent error, which can offset all the advantages of other calculations. And professional tools are either expensive, or their daily use may be too complicated for managers.
Most companies use Excel to do this kind of calculation. We do not recommend doing this, since a large amount of calculations and the need for human participation in the formation of data for filling in excel will not sufficiently reduce the influence of the human factor on the calculation. And the consequence of working with excel is the ability to grow only through an increase in the number of managers.
Thus, we can find the answer to the question "how much goods and where to put?".
We recommend using highly automated solutions that are light enough for everyday use, aimed at solving a specific procurement problem and drastically reducing the human factor. One such system is Mycroft Assistant, http://mycroftbs.ru .
The second problem facing the company, which decided to correctly set the supply strategy, is the limited resources.
What should companies do when the demand is $ 10,000,000, and in fact there is only $ 3,000,000? What goods need to be purchased in the first place, and to which outlets should they be transported?
To find the answer to these questions, it is necessary to introduce a gradation of goods by the degree of their influence on the company’s activities. A more important product is a product that is most often taken, which brings more profit, and which should be in the assortment of the company. The most popular method is the clustering of goods by ABC groups, but it does not answer the question "what should I do if I don’t have enough money for all goods of group A?"
To solve these problems, there are several "cross-cutting" indicators that can be easily calculated for all products. These are indicators: turnover of goods and liquidity of goods.
The turnover of goods can be calculated as the ratio of the speed of sales of goods to the average stock for a certain period. That is, this is the period of time for which the average stock of goods in stock is sold, and, therefore, the time to return the invested money.
Turnover shows how many days are needed to sell the average inventory. It is defined as the ratio of the product of the average inventory and the number of days in a month to the turnover for this period.
In = (SrSt * Period) / ObProd , where
SrSt - Average inventory for the selected period,
ObProd - Sales for the selected period.
Period - the number of days in the analysis period
For example, the average stock of goods amounted to 100 pieces, and sales - 300 pieces. So, the turnover will be: 100 * 31/300 = 10.3 (days), i.e. It takes about 10 days to sell the average stock of goods.
Usually, the higher the turnover rate of the product (the lower the rate in days), the better for the company. This means that the goods are not stored in warehouses, and the incoming batch is quickly sold. Ideally, analyze the indicator in dynamics relative to previous periods. Thus, the more circulating the goods, the more preferable it is for purchasing.
On the other hand, the liquidity indicator approaches this issue, its logic is about the same - the faster the product leaves, the higher the indicator. And the conclusions from it are exactly the same: the more liquid the product, the more preferable it is to purchase.
To calculate the liquidity of stocks, it is proposed to consider the so-called “product exit” - the ratio of the amount of goods received to its sales - Usability Index. The index is considered for a certain period, by default - 1 year, but different companies can consider it differently.
In = (ObProd - ObPost) / ObProd , where
ObProd is the Sales volume for the selected period,
ObPost is the Revenue volume for the selected period.
The interpretation of the coefficient is proposed as follows:
A product is allocated separately, the remainder of which is in stock, but its sales are zero for the selected period — such a product is considered a “dead balance".
Thus, owning the set indicators, you can highlight the most significant products: Actively used (by liquidity), with a high turnover rate, as well as generally recognized indicators - profit and share in the company's turnover. Competent organization of procurement is the investment of working capital precisely these goods in the first place.
The difficulties associated with the use of presets are associated with the fact that each of the indicators must be calculated individually for each of the goods for each of the outlets at each formation of the purchase order. And even better - every day, in order to be able to control the current state of stocks in the company and to be able to respond in advance to changes in the status of the goods (so that it is possible to sell the goods at a discount through any marketing tools before they become “ illiquid ”). Thus, if you have an assortment of 5000 SKUs and 5 stores, then per year you need to carry out (365 x 5 x 5000 x 2) about 18 million calculation of indicators per year.
We recommend the use of highly automated solutions aimed at solving a specific procurement problem, which will be able to automatically monitor the current state of stocks and effectively form an order to the supplier based on current estimates. One such system is Mycroft Assistant, http://mycroftbs.ru .
Mycroft Assistant is an inventory management system that can help small and medium-sized businesses avoid overstocking and shortage of goods in stock, reduce costs and increase company profitability.
By analyzing the sales history and current balances, Mycroft Assistant generates a forecast and makes recommendations on what products should be purchased and what warehouse to bring them to. And also forms a plan of sales and purchases in future periods. The system replaces the “manual” work and work with excel, and allows the company to develop and work efficiently without attracting additional staff.
The system gives you recommendations on what you need to do in order to avoid an excess or shortage of goods at each of the outlets - where and how much goods need to be transported so that the company is ready to provide a level of service to its customers.
To draw up a sales and purchase plan, in fact, just click the button “Calculate plans” - the system will independently analyze the sales history, current balances, take into account factors affecting the movement of goods. As a result of the calculation, you will get a ready-made layout for quantitative and financial indicators.
With co-authorship with Vladimir Chemeris