How we shot ourselves in the foot and tried to figure out exactly what
Past posts in the corporate blog did not contain a single console command, and we decided to catch up.
In our company there is a metric created to prevent large fakapov on a shared hosting. Each virtual hosting server hosts a test site on WordPress, which is periodically accessed.

This is how a test site looks on each shared hosting server.
Measured the speed and success of the response site. Any company employee can look at the general statistics and see how well the company is doing. Can see the percentage of successful responses of the test site for the entire hosting or for a specific server. It is not necessary to be an employee of the company - in the control panel, customers also see statistics on the server where their account is located.
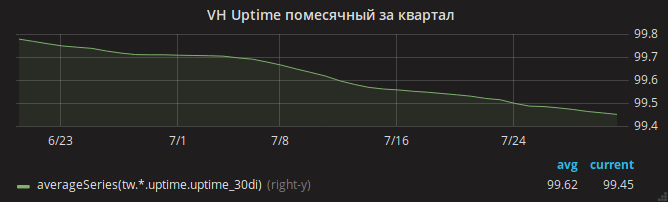
We called this metric uptime (the percentage of successful responses from the test site to all requests to the test site). Not a very good name, it is easy to confuse with the uptime-who-total-time-after-last-restart-server .
The summer has passed, and the uptime schedule has slowly gone down.
Administrators immediately identified the cause - a shortage of RAM. In the logs it was easy to see cases of OOM, when the server ran out of memory and the kernel killed nginx.
The head of the department, Andrei, breaks down one task into several tasks with a master's hand and parallelizes them to different administrators. One is going to analyze the Apache settings - perhaps the settings are not optimal and with a large attendance Apache uses all the memory? Another analyzes the mysqld memory consumption - suddenly there are any outdated settings since the time when shared hosting used the Gentoo OS? The third is looking at the recent changes to the nginx settings.
One by one, administrators are returned with results. Everyone managed to reduce memory consumption in the area allocated to him. In the case of nginx, for example, enabled, but not used mod_security was detected. OOM, meanwhile, is also common.
Finally, it is possible to notice that the memory consumption by the kernel (in particular, SUnreclaim) is terribly large on some servers. This parameter is not visible in the ps or htop output, so we did not notice it immediately! An example of a server with a hellish SUnreclaim:
root@vh28.timeweb.ru:~# grep SU /proc/meminfo
SUnreclaim:     25842956 kB
24 gigabytes of RAM is given to the kernel, and the kernel spends them unknown on what!
The administrator (let's call him Gabriel) rushes into battle. Reassembles the kernel with KMEMLEAK options for searching for leaks.
Для включения KMEMLEAK достаточно указать опции, указанные ниже, и загрузить ядро с параметром kmemleak=on.
CONFIG_HAVE_DEBUG_KMEMLEAK=y
CONFIG_DEBUG_KMEMLEAK=y
CONFIG_DEBUG_KMEMLEAK_DEFAULT_OFF=y
CONFIG_DEBUG_KMEMLEAK_EARLY_LOG_SIZE=10000
KMEMLEAK writes (c /sys/kernel/debug/kmemleak) the following lines:
unreferenced object 0xffff88013a028228 (size 8):
  comm "apache2", pid 23254, jiffies 4346187846 (age 1436.284s)
  hex dump (first 8 bytes):
    00 00 00 00 00 00 00 00                          ........
  backtrace:
    [<ffffffff818570c8>] kmemleak_alloc+0x28/0x50
    [<ffffffff811d450a>] kmem_cache_alloc_trace+0xca/0x1d0
    [<ffffffff8136dcc3>] apparmor_file_alloc_security+0x23/0x40
    [<ffffffff81332d63>] security_file_alloc+0x33/0x50
    [<ffffffff811f8013>] get_empty_filp+0x93/0x1c0
    [<ffffffff811f815b>] alloc_file+0x1b/0xa0
    [<ffffffff81728361>] sock_alloc_file+0x91/0x120
    [<ffffffff8172b52e>] SyS_socket+0x7e/0xc0
    [<ffffffff81003854>] do_syscall_64+0x54/0xc0
    [<ffffffff818618ab>] return_from_SYSCALL_64+0x0/0x6a
    [<ffffffffffffffff>] 0xffffffffffffffff
unreferenced object 0xffff880d67030280 (size 624):
  comm "hrrb", pid 23713, jiffies 4346190262 (age 1426.620s)
  hex dump (first 32 bytes):
    01 00 00 00 03 00 ff ff 00 00 00 00 00 00 00 00  ................
    00 e7 1a 06 10 88 ff ff 00 81 76 6e 00 88 ff ff  ..........vn....
  backtrace:
    [<ffffffff818570c8>] kmemleak_alloc+0x28/0x50
    [<ffffffff811d4337>] kmem_cache_alloc+0xc7/0x1d0
    [<ffffffff8172a25d>] sock_alloc_inode+0x1d/0xc0
    [<ffffffff8121082d>] alloc_inode+0x1d/0x90
    [<ffffffff81212b01>] new_inode_pseudo+0x11/0x60
    [<ffffffff8172952a>] sock_alloc+0x1a/0x80
    [<ffffffff81729aef>] __sock_create+0x7f/0x220
    [<ffffffff8172b502>] SyS_socket+0x52/0xc0
    [<ffffffff81003854>] do_syscall_64+0x54/0xc0
    [<ffffffff818618ab>] return_from_SYSCALL_64+0x0/0x6a
    [<ffffffffffffffff>] 0xffffffffffffffff
Gabriel did not reveal to us all his secrets and did not tell how he found out from the above lines the exact cause of the memory leak. Most likely, he used the command addr2line /usr/lib/debug/lib/modules/`uname -r`/vmlinux ffffffff81722361to search for the exact string. Or simply opened the file net/socket.cand looked at it while the file became uncomfortable.
The problem turned out to be in a patch for a file net/socket.cthat was added to our repository many years ago. Its purpose is to prevent clients from using the bind () system call, this is a simple protection against the launch of proxy servers by clients. The patch fulfilled its purpose, but did not clear the memory after itself.
Perhaps there were new trendy malware on PHP that tried to run a proxy server in a loop - which led to hundreds of thousands of blocked bind () calls and lost gigabytes of RAM.
Then it was easy - Gabriel corrected the patch and rebuilt the core. Added monitoring of SUnreclaim values on all servers under Linux OS. Engineers warned customers and rebooted hosting into a new kernel.
OOM disappeared.
But the problem with the availability of sites remained
On all servers, the test site stopped responding several times a day.
Here the author would begin to tear hair on different parts of the body. But Gabriel remained calm and turned on the recording of traffic on some hosting servers.
In the traffic dump, it was clear that most often the request to the test site drops after a sudden packet is received TCP RST. In other words, the request reached the server, but the connection was eventually broken off by nginx.
Further more interesting! The strace utility launched by Gabriel shows that the nginx daemon does not send this packet. How can this be, because only nginx listens to port 80?
The reason was a combination of several factors:
- in the nginx settings there is an option
reuseport(including the socket optionSO_REUSEPORT) that allows different processes to accept connections at the same address and port - at (at the time, the most recent) version of nginx 1.13.0, there is a bug that, when running the nginx configuration test through
nginx -tand using the option,SO_REUSEPORTthis nginx test process really started listening to port 80 and intercepting requests from real clients. And at the completion of the configuration test process, clients receivedConnection reset by peer - finally, in monitoring zabbiks, monitoring of the correctness of the nginx configuration on all servers with nginx installed was configured: the command
nginx -twas invoked on them once a minute.
Only after updating nginx could you breathe out calmly. Graph uptime sites went up.
What is the moral of this story? Stay optimistic and avoid using self-assembled cores.