4 tools on the shelves. Project Management with WBS, Gantt Chart, CPM and Time-Cost
I will not reveal the secret if I say that well-organized project management is the key to project success. Each of the project or team managers has chosen, on an intuitive level or practical experience, for themselves a set of tools that help in building processes and relationships in the team.
Over time, project management tools have gone from a pencil and a sheet of paper (sometimes they come back in the form of a kanban board in an office) to software for managing projects and spreadsheets (both offline and online, from a simple project plan using the Gantt chart and Kanban boards ending with complex systems), designed to facilitate management, which are so easy to choose ... and fly, because it is not clear why and in what advantages.
Therefore, one way or another, the choice of tools should not start with software (by the way, here wasa large list of 43 project management systems ). I take it upon myself to dare to translate a good guide on the four project management tools from TakingITGlobal, which are the basis for many systems.
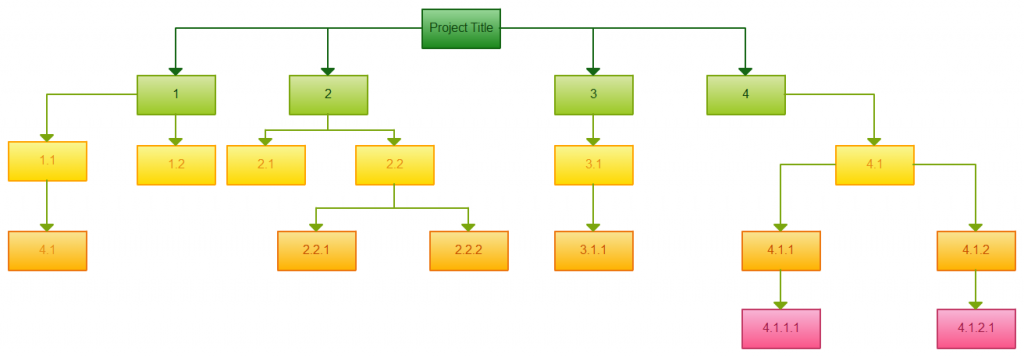
To simplify the management of a complex project, it is advisable to divide it into components in a hierarchical structure , the so-called ISP, or WBS (the work breakdown structure). Such a hierarchical structure of the project can be represented in the form of a block diagram:
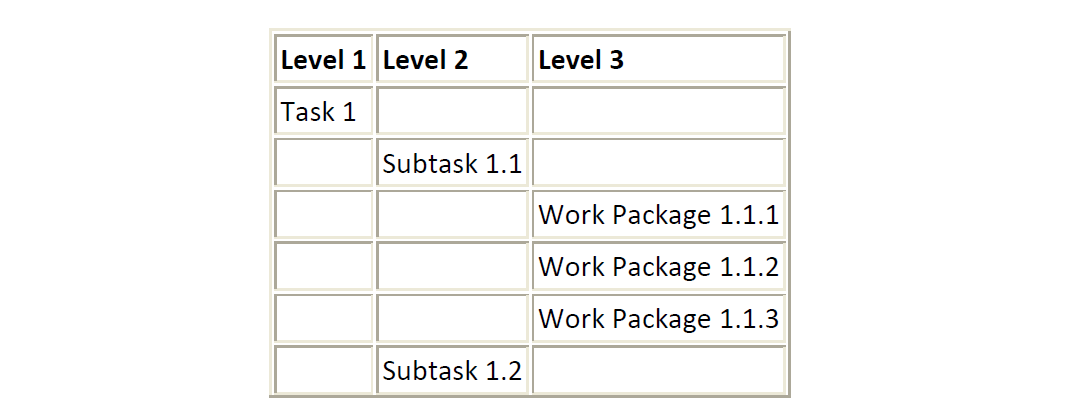
Each organization uses its own terminology to classify COI components according to their hierarchy level. For example, some organizations divide tasks, subtasks, and work lists into different levels .
Others use phases, data, and activities.
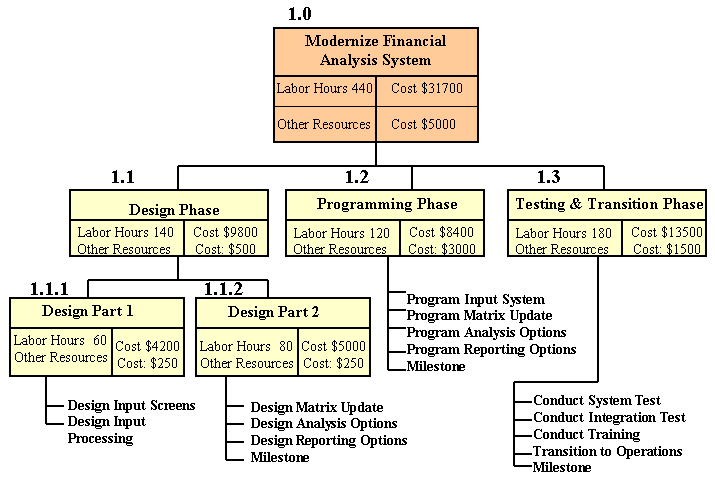
COI can be formed around the phases and results of a project throughout its entire life cycle. Higher levels of the structure are usually the responsibility of working groups. Whereas the tasks of the lower level are carried out individually. Thus, in COI as a structure based on results, it is not at all necessary to create specific tasks.
Partitioning a project accelerates resource allocation and establishes the responsibilities of each team member. The better you detail your COI, the more accurate your actions will be. On the one hand, you should not overly detailed structure so as not to become a victim of micro-management. But on the other hand, do not make the elements too large to maintain their controllability. The optimal value of the elements is from several days to several months.
ISP is the basis of project planning. However, it is done when you clearly know the relationship of your tasks and the time required to solve them. COI is created specifically to highlight tasks in CPM or PERT approaches .
In the era of scientific management, Henry Gant created a tool that shows project progress in a special chart. Initially, the diagram was created to track the process of building ships. Today, this tool is a horizontal bar chart for project management.
The horizontal axis in the Gantt chart is a time scale that can be expressed in absolute value or the value of time tied to the beginning of the project. The timing depends on the type of project: usually weeks or months are used. The columns in the diagram show the start and end times of an individual task in the project.

For large projects, tasks can be divided into subtasks, which have their own additional Gantt charts for easier reading.
The initial version of the Gantt chart (it will be Gantt chart templates , or the projects you created) often requires the introduction of additional elements so that it is multifunctional and effective not only for building projects, but also for managing them.
The strength of the Gantt chart is the ability to visually display the status of each task, create a project plan with a chart template, track processes based on priority planning. Usually, Gantt charts are built in special software for project management, for example, Gantt chart - GanttPRO, Smartsheet or Wrike.
In 1957, the American company DuPont developed a method that was intended to solve the problem of closing the company's chemical plants for repair and subsequent start when the repair is completed. Realizing the complexity of this project, the company decided to use the Critical Path Method to solve such a problem.
This gives the following advantages:
The critical path models the activities and events of a project into an interconnected network. Activities are displayed as “nodes”, and events (the beginning and end of activity) look like arches and lines between nodes.
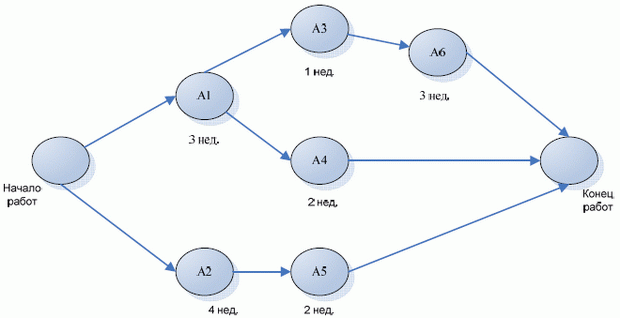
Stages of charting:
To create a COI, you should start with a list of all the tasks of the project. It can be used as a basis for creating sequences and estimating the project execution time in the next stages.
The performance of some tasks is directly related to the completion of others. Determine which tasks should be performed first so that other tasks do not move.
When tasks and their sequence are defined, a critical path can be built. Initially, it was created as a nodal activity, but now some project managers prefer to show it in the form of arches.
The time required to complete each task can be estimated based on past experience or expert ratings. At the same time, the critical path is an assessment model that does not take into account different options for the endings of tasks.
This is the longest task chain in your system. Its importance lies in the fact that tasks located along this path cannot be delayed or expired without transferring project deadlines. This type of analysis is very important for assessing the duration of the project as a whole.
Standby time is the time between the closest and last start time, or between the closest and last end time of a project. Standby time is the time for which the near start and finish time can be delayed without moving the deadlines of the entire project.

As the project progresses, it becomes clear the current project completion time or the chart should be updated to include this information. A new critical path may appear with new deadlines and structural changes.
Designed for complex, but rather routine projects with the possibility of minimal change in time to complete tasks. For more chaotic projects, the critical path loses its usefulness. An alternative is the PERT model , which allows you to change the duration of each activity.
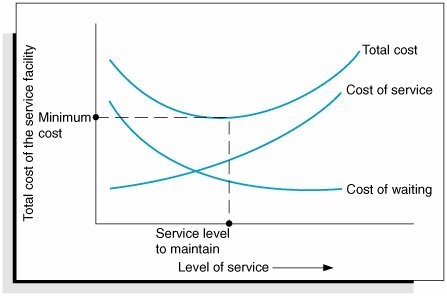
There is a correlation between the project completion time and its cost. Cap For some types of costs, this relationship is direct. In other types of costs, costs vary due to others. For these two types of costs, there is an optimal time step at the minimum cost. Understanding the time-cost relationship, it becomes easier to calculate the cost of the deferrals in the project.
Project costs are classified as direct and indirect.
Reducing or completely breaking the project schedule is used to speed up the project to complete its progress at an earlier date. The time required to complete the project is determined critically, therefore, in order to reduce the time of the entire project, you must first focus on the tasks of the critical path.
The process of determining the optimal project time consists of calculating the normal (average) execution time of each task on the critical path and the extreme time. Extreme time is the shortest time required to complete a task. Direct costs are also calculated for tasks performed in normal and extreme times. The coefficient shows the costs per unit time of each specific task. It shows how much the acceleration of each task will cost:
Cost = (Extreme costs - Optimal costs) / (Optimal time - Extreme time)
Those tasks that have the lowest cost per unit of time should be reduced first. Thus, you should go along the path and calculate the overall ratio of project costs to project time. Indirect, direct and total costs can be calculated for different project durations.
The optimal project cost is the point that will be located at the very bottom of the total cost curve.
Attention should be paid to the critical path after the duration of the tasks is reduced. If a new path appears, you should consider new time cuts.
To minimize costs, tasks that do not lie on a critical path can be expanded without increasing the duration of their implementation.
The time-cost model can be described based on the following assumptions:
In case these assumptions cannot be realized, the model should be adapted. For example, in the schedule of tasks it should be taken into account that it is worth leveling the load on limited resources, such as specialized equipment.
There are other points of view regarding project costs. For example, if a project is part of a new product development, time to market can be very important. And it may be beneficial to accelerate the pace of the project to the point where costs will be much higher than the minimum.
In contract work, additional payment may be considered as remuneration for early completion of work or penalties for backlog. Such rewards and penalties can be attributed to indirect costs.
Since the critical path is extremely important in reducing project lead times, planning techniques such as the critical path or PERT can be used before shortening the project schedule.
Over time, project management tools have gone from a pencil and a sheet of paper (sometimes they come back in the form of a kanban board in an office) to software for managing projects and spreadsheets (both offline and online, from a simple project plan using the Gantt chart and Kanban boards ending with complex systems), designed to facilitate management, which are so easy to choose ... and fly, because it is not clear why and in what advantages.

Therefore, one way or another, the choice of tools should not start with software (by the way, here wasa large list of 43 project management systems ). I take it upon myself to dare to translate a good guide on the four project management tools from TakingITGlobal, which are the basis for many systems.
Work Breakdown Structure
To simplify the management of a complex project, it is advisable to divide it into components in a hierarchical structure , the so-called ISP, or WBS (the work breakdown structure). Such a hierarchical structure of the project can be represented in the form of a block diagram:

Project Hierarchical Structure Plan

Terminology for different levels
Each organization uses its own terminology to classify COI components according to their hierarchy level. For example, some organizations divide tasks, subtasks, and work lists into different levels .
Others use phases, data, and activities.

The hierarchy structure according to the results and phases of work
COI can be formed around the phases and results of a project throughout its entire life cycle. Higher levels of the structure are usually the responsibility of working groups. Whereas the tasks of the lower level are carried out individually. Thus, in COI as a structure based on results, it is not at all necessary to create specific tasks.
Detail level
Partitioning a project accelerates resource allocation and establishes the responsibilities of each team member. The better you detail your COI, the more accurate your actions will be. On the one hand, you should not overly detailed structure so as not to become a victim of micro-management. But on the other hand, do not make the elements too large to maintain their controllability. The optimal value of the elements is from several days to several months.
Role assignment in project planning
ISP is the basis of project planning. However, it is done when you clearly know the relationship of your tasks and the time required to solve them. COI is created specifically to highlight tasks in CPM or PERT approaches .
Gantt Charts
Gantt Charts
Nowadays, they are the standard in project management, the principles of which are used both in theory and in practice.In the era of scientific management, Henry Gant created a tool that shows project progress in a special chart. Initially, the diagram was created to track the process of building ships. Today, this tool is a horizontal bar chart for project management.

The horizontal axis in the Gantt chart is a time scale that can be expressed in absolute value or the value of time tied to the beginning of the project. The timing depends on the type of project: usually weeks or months are used. The columns in the diagram show the start and end times of an individual task in the project.

For large projects, tasks can be divided into subtasks, which have their own additional Gantt charts for easier reading.
How can I improve the Gantt chart?
The initial version of the Gantt chart (it will be Gantt chart templates , or the projects you created) often requires the introduction of additional elements so that it is multifunctional and effective not only for building projects, but also for managing them.
- A vertical marker can be used to mark a specific point in the time axis.
- The progress of each task can be shown as a column showing the progress of the task in real time.
- Dependencies can be displayed as lines or colored pointers.
- Necessary resources can be specified for each task separately.
- Work steps may be displayed.
The strength of the Gantt chart is the ability to visually display the status of each task, create a project plan with a chart template, track processes based on priority planning. Usually, Gantt charts are built in special software for project management, for example, Gantt chart - GanttPRO, Smartsheet or Wrike.
CPM (Critical Path Method)
Critical path
In 1957, the American company DuPont developed a method that was intended to solve the problem of closing the company's chemical plants for repair and subsequent start when the repair is completed. Realizing the complexity of this project, the company decided to use the Critical Path Method to solve such a problem.
This gives the following advantages:
- Gives a graphical display of the project
- Predicts the time required to complete a task
- Shows which tasks are critical for a project and which are not.
The critical path models the activities and events of a project into an interconnected network. Activities are displayed as “nodes”, and events (the beginning and end of activity) look like arches and lines between nodes.

Critical path diagrams
Stages of charting:
- Identify individual tasks.
- Define the sequence of these tasks.
- Draw a diagram in the form of a network of interconnected tasks.
- Estimate the time of each activity.
- Highlight the critical path (the largest chain of actions on your network)
- Update the chart as the project progresses.
Define individual tasks
To create a COI, you should start with a list of all the tasks of the project. It can be used as a basis for creating sequences and estimating the project execution time in the next stages.
Defining a task sequence
The performance of some tasks is directly related to the completion of others. Determine which tasks should be performed first so that other tasks do not move.
Draw a diagram as a network of interconnected tasks
When tasks and their sequence are defined, a critical path can be built. Initially, it was created as a nodal activity, but now some project managers prefer to show it in the form of arches.
Estimate the time of each activity.
The time required to complete each task can be estimated based on past experience or expert ratings. At the same time, the critical path is an assessment model that does not take into account different options for the endings of tasks.
Critical Path Identification
This is the longest task chain in your system. Its importance lies in the fact that tasks located along this path cannot be delayed or expired without transferring project deadlines. This type of analysis is very important for assessing the duration of the project as a whole.
The critical path can be determined by 4 key parameters of each activity:
- The nearest start time (BS) is the moment when all previous tasks are completed.
- Nearest End Time (BO) - The closest start time plus the time needed to complete the task.
- Last time for completion (PO) - The final moment when all activities are completed without postponing tasks.
- Last Start Time (MON) - The last end time minus the time required to complete the task.
Standby time is the time between the closest and last start time, or between the closest and last end time of a project. Standby time is the time for which the near start and finish time can be delayed without moving the deadlines of the entire project.
The critical path is a chain through the entire network of project tasks, in which none of the tasks has a backup time when BS = PN and BO = software for all tasks on the path. A break automatically leads to a project shift. To summarize, in order to reduce the duration of the project, you need to reduce the time for tasks on the critical path.

Critical Path Update
As the project progresses, it becomes clear the current project completion time or the chart should be updated to include this information. A new critical path may appear with new deadlines and structural changes.
Critical Path Limitations
Designed for complex, but rather routine projects with the possibility of minimal change in time to complete tasks. For more chaotic projects, the critical path loses its usefulness. An alternative is the PERT model , which allows you to change the duration of each activity.
Time-Costs
There is a correlation between the project completion time and its cost. Cap For some types of costs, this relationship is direct. In other types of costs, costs vary due to others. For these two types of costs, there is an optimal time step at the minimum cost. Understanding the time-cost relationship, it becomes easier to calculate the cost of the deferrals in the project.
Cost Types
Project costs are classified as direct and indirect.
- Direct costs are all that are directly related to the work of the project, such as salaries, business trips, materials and equipment. If these resources are required more and more in order to reduce the project completion time, then direct costs are rising.
- Непрямые затраты — это накладные расходы, не связанные напрямую с задачами проекта, такие как аренда офиса, административные персонал, налоги. Такие расходы обычно не меняются значительно в течение времени проекта. Обычно такие затраты возрастают из-за увеличения длительности проекта.
Сжатие графика выполнения проекта
Reducing or completely breaking the project schedule is used to speed up the project to complete its progress at an earlier date. The time required to complete the project is determined critically, therefore, in order to reduce the time of the entire project, you must first focus on the tasks of the critical path.
The process of determining the optimal project time consists of calculating the normal (average) execution time of each task on the critical path and the extreme time. Extreme time is the shortest time required to complete a task. Direct costs are also calculated for tasks performed in normal and extreme times. The coefficient shows the costs per unit time of each specific task. It shows how much the acceleration of each task will cost:
Cost = (Extreme costs - Optimal costs) / (Optimal time - Extreme time)
Those tasks that have the lowest cost per unit of time should be reduced first. Thus, you should go along the path and calculate the overall ratio of project costs to project time. Indirect, direct and total costs can be calculated for different project durations.
The optimal project cost is the point that will be located at the very bottom of the total cost curve.
Project Costs in Relation to Duration
Attention should be paid to the critical path after the duration of the tasks is reduced. If a new path appears, you should consider new time cuts.

To minimize costs, tasks that do not lie on a critical path can be expanded without increasing the duration of their implementation.
Assumptions in the Time-Cost Model
The time-cost model can be described based on the following assumptions:
- Optimal task costs are lower than extreme costs.
- There is a linear relationship between the time of a task and its cost.
- Resources are available to reduce task duration.
In case these assumptions cannot be realized, the model should be adapted. For example, in the schedule of tasks it should be taken into account that it is worth leveling the load on limited resources, such as specialized equipment.
Additional judgments
There are other points of view regarding project costs. For example, if a project is part of a new product development, time to market can be very important. And it may be beneficial to accelerate the pace of the project to the point where costs will be much higher than the minimum.
In contract work, additional payment may be considered as remuneration for early completion of work or penalties for backlog. Such rewards and penalties can be attributed to indirect costs.
Since the critical path is extremely important in reducing project lead times, planning techniques such as the critical path or PERT can be used before shortening the project schedule.
