Over 80 Linux system monitoring tools
Below is a list of monitoring tools. There are at least 80 ways in which your machine will be in control.

1. the first tool - top The
console command top is a convenient system monitor, easy to use, with which a list of processes running in the system and information about these processes is displayed. This command sorts them in real time by the load on the processor; the tool is preinstalled on many UNIX systems.
2. htop
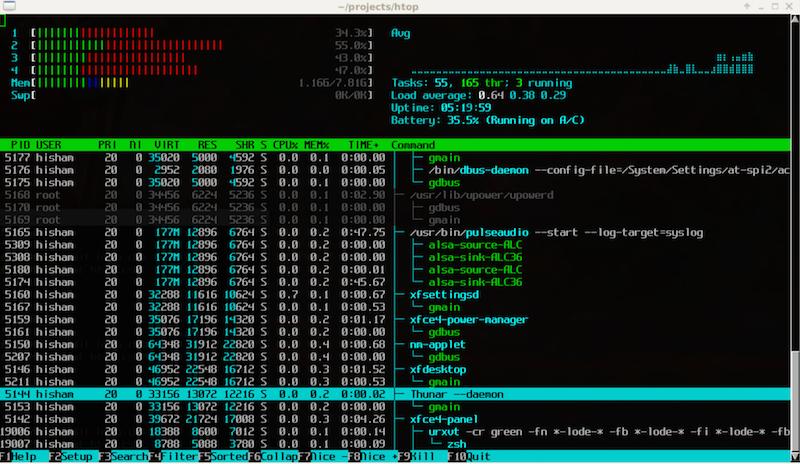
htop - the system monitor, as an alternative to the top command, shows a dynamic list of all (unlike top) system processes, continuous operation time, CPU and memory usage.
3. atop
atop - an interactive monitor, similar to top, displays new changes about active processes in the system. A good tool for tracking bottlenecks, monitoring the load of the central processing unit, RAM, computer network. Due to the fact that it works continuously, it can load the server. It combines the capabilities of top, netstat, iostat, accounting and others. Saves data to a file of its own binary format (writes the state of the system to a compressed file).
4. apachetop
apachetop - a console utility that monitors real-time traffic, splits apache logs and displays output on the screen, in a word shows a detailed picture of the use of your sites.
5. ftptop
ftptop utility provides basic information about all current ftp connections to the server, information about the total number of sessions, the number of downloads and downloads, who the client is. Allows you to see users connected to the ftp server.
6. mytop
An interesting, convenient, and useful utility called mytop. Similar to top for Unix systems, mytop scans all calls to the MySQL server in real time.
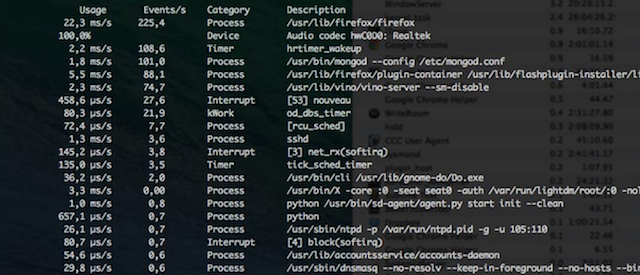
7. powertop
powertop is a utility that allows you to detect components in the system that consume more power than you need on your laptop, and shows the total power consumption (in W), information is read from various sources of the kernel. This will allow you to manage / experiment with power management settings, effectively configure the energy consumption for your machine.
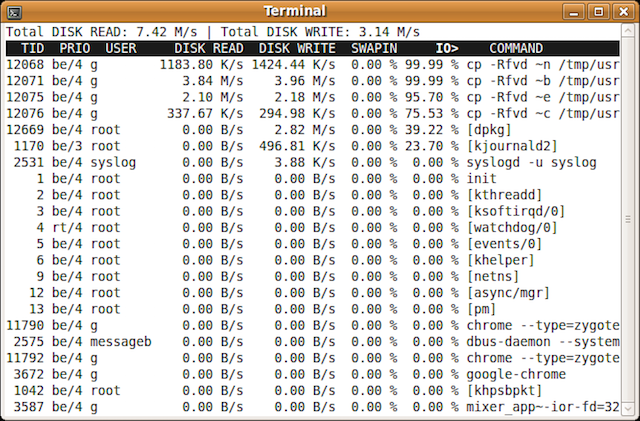
8. iotop
iotop - the utility is similar to the top utility, but it displays not the CPU and memory usage, but the work of processes with disks, written in Python. It will help you determine which process is accessing your Linux hard drive. Displays active processes that are currently performing I / O operations with the disk, collects statistics for a certain time.
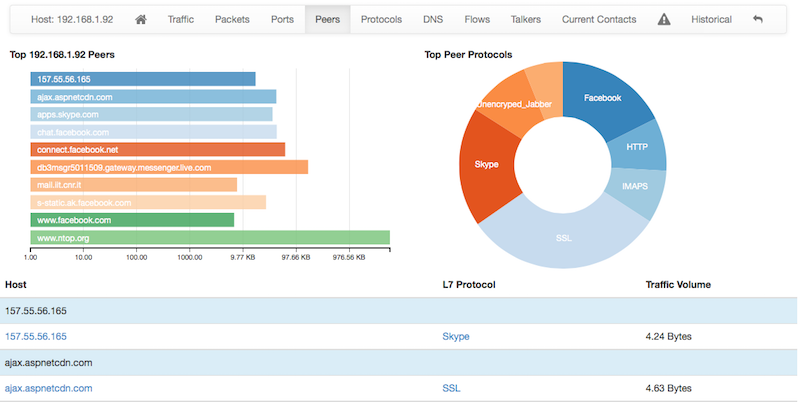
9. ntopng
ntopng is the next generation of ntop, the tool allows you to monitor how much, what and which IP has been pumped through the interface on the gateway, shows the distribution of IP traffic, host geolocation, and network traffic analysis.
10. iftop
iftop - displays information about active network connections, network download / upload speed, monitors online traffic, shares traffic by protocols, interfaces and hosts.
iftop is similar to top in terms of network usage.
11. jnettop
jnettop visualizes network traffic similar to iftop, monitors network activity. A utility for monitoring traffic in real time.
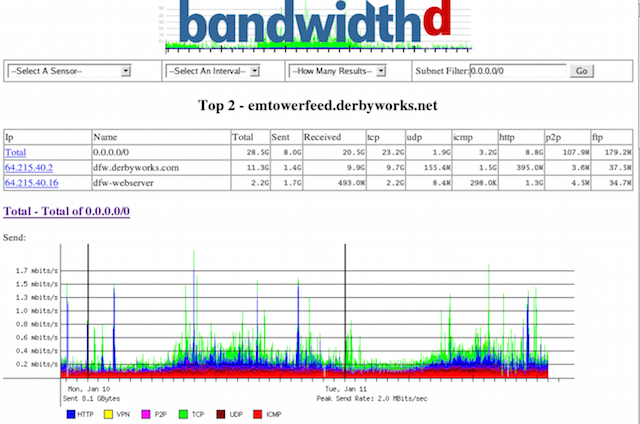
12. bandwidthd
bandwidthd - a utility for controlling end-user traffic, builds summary tables (html) and graphs for each user by IP and subnet, disaggregated by day, week and month.
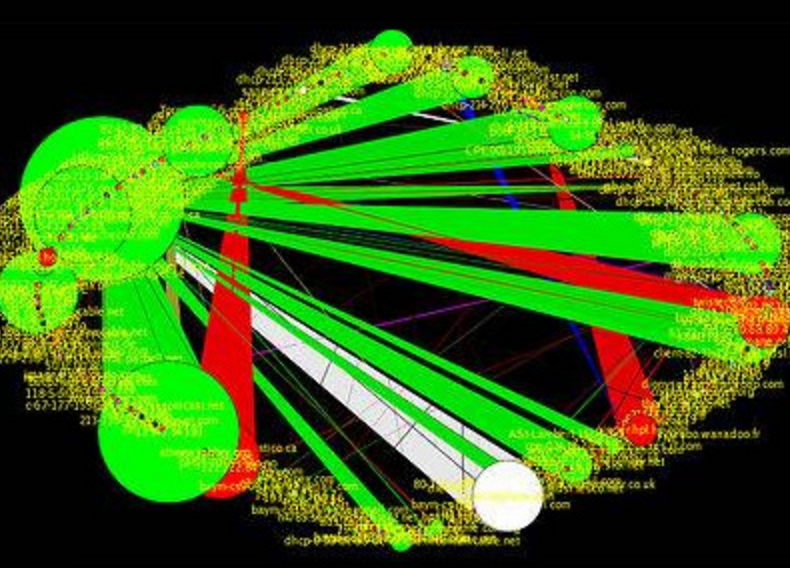
13. EtherApe
EtherApe - shows network traffic in the form of a graph, shows not only connections, but also the flow for each of them, the type of protocol by port number, network activity of different hosts. On the graph, the nodes are displayed in the form of a ring, and the connections in the form of lines, and so, the more intense the traffic, the thicker the connecting lines, different types of traffic are indicated in different colors.
14. ethtool
ethtool is a Linux network interface configuration utility. This means that bond0, tun0, and other devices that are not physical, cannot be viewed or edited using ethtool.
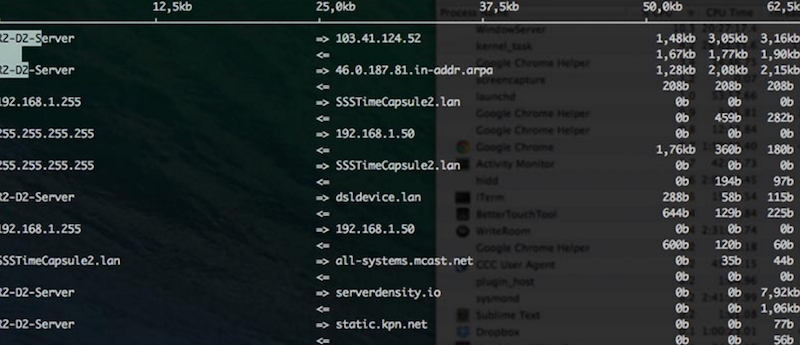
15. NetHogs
NetHogs - a utility that monitors any network activity of all processes on the computer, similar to top only for the network. The utility is in standard repositories and is installed with just one command:
You can run the utility only with root privileges:
16. iptraf
iptraf - a utility for monitoring network interfaces, monitors traffic over all TCP connections, provides statistics on the loading of network interfaces, protocols, ports, packet sizes.

17. ngrep
ngrep - the same grep only at the network level, serves to select and view the contents of packages, is a pcap-compatible utility, allows you to use hexadecimal strings when defining patterns.
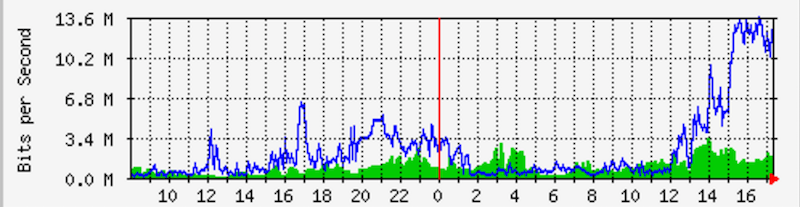
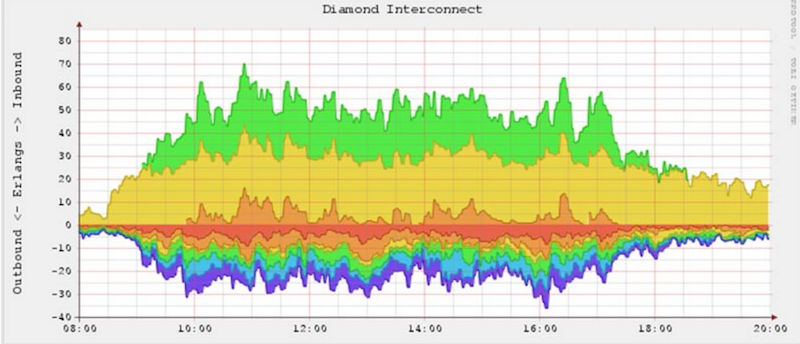
18. MRTG
MRTG - utility monitors network links. MRTG output generates html pages with charts in png.
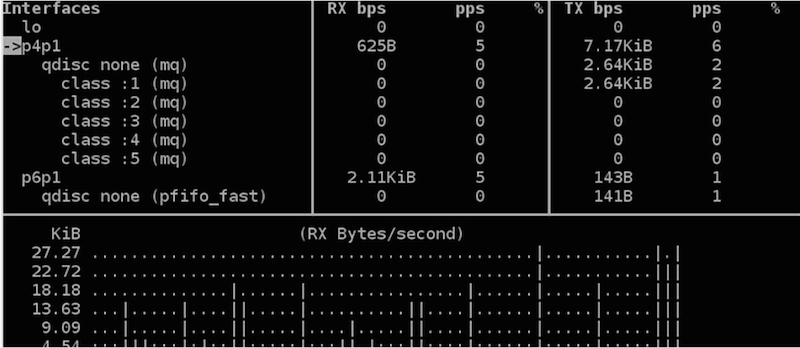
19. bmon
bmon - a utility for monitoring several network interfaces in real time at once, supports various input / output methods and filters, shows the load of the network interface in the form of a graph, the total load of the network interface is displayed in the form of a table.
20. traceroute
traceroute - a utility with the help of which it is possible to determine on which part of the IP network a failure has occurred, to “investigate” IP networks (routing, DNS servers, data backbone, also known as backbone, subnet system, etc.)
21 . IPTState
IPTState - displays statistics of open ports in the form of a table with IP addresses. An effective tool that monitors IP traffic, displays both general statistics for all network interfaces and detailed statistics for a single taken interface.
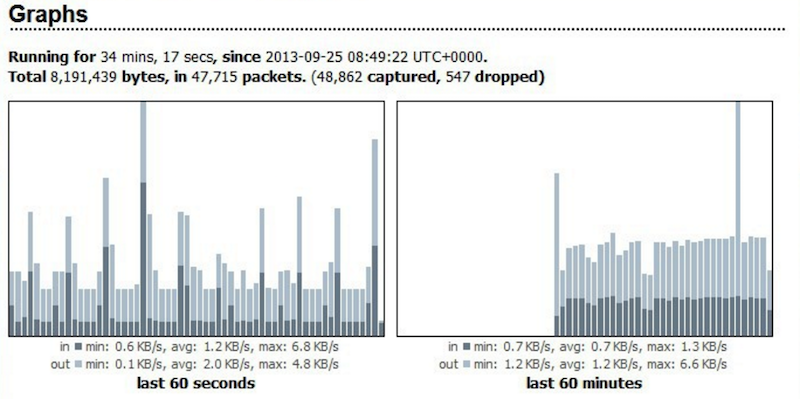
22. darkstat
darkstat - monitors network traffic, displays network usage statistics, sends reports via http. The collected information about the speed, the number of transmitted packets, bytes, visited hosts and host data is displayed in the form of a web page.
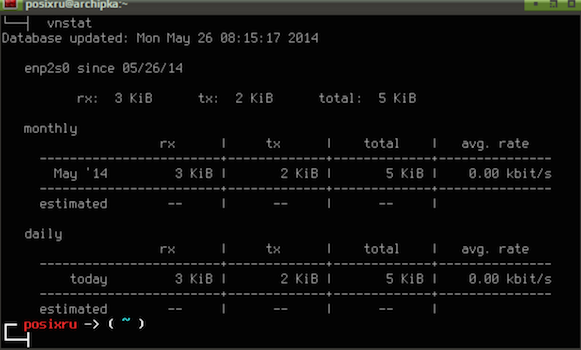
23. vnStat
vnStat - a utility for accounting for network traffic, saves the history of network traffic for the selected interfaces, traffic is considered both incoming and outgoing for each interface. vnStat gets data from the Linux kernel.
24. netstat
netstat - the utility is used to check active TCP connections, displays information about the protocol used, the local address and port number, the external address and port number, as well as information about the connection status.
25. ss
ss - a utility that can be used instead of netstat, it can display more detailed information and faster if you want to display summary statistics - this utility is for you. ss collects and displays information about all TCP and UDP ports, open ssh / ftp / http / https connections, etc.
26. nmap
nmap - the utility allows you to scan the server, determines which OS is installed, you can find out if the computer is protected by any packet filters or firewall and many other features (an open-source utility for network research and security verification).
20 examples of the nmap
27 command . MTR
MTR is a network diagnostic utility that combines the capabilities of the traceroue and ping programs, examines the connections between the node on which it is running and the target node, the program allows you to determine the node on which packet loss occurs.
28. Tcpdump
Tcpdump - displays packet headers passing through the network interface that match the boolean expression, is included in most Unix distributions and allows you to intercept and display / save network traffic to a file. Using tcpdump, you can analyze traffic at the network level (ARP, ICMP), at the transport level (TCP, UDP).
29. Justniffer
Justniffer is a console utility for analyzing traffic, an HTTP protocol sniffer based on pcap and tailored for TCP.
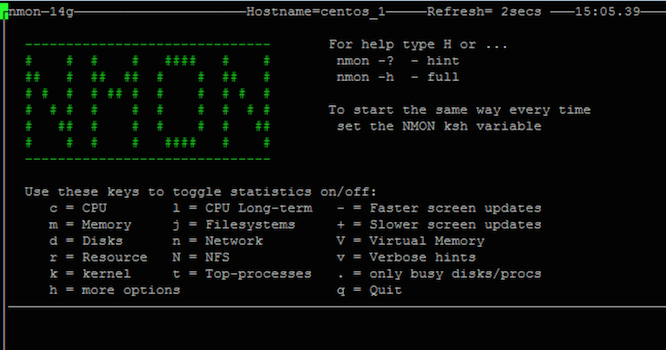
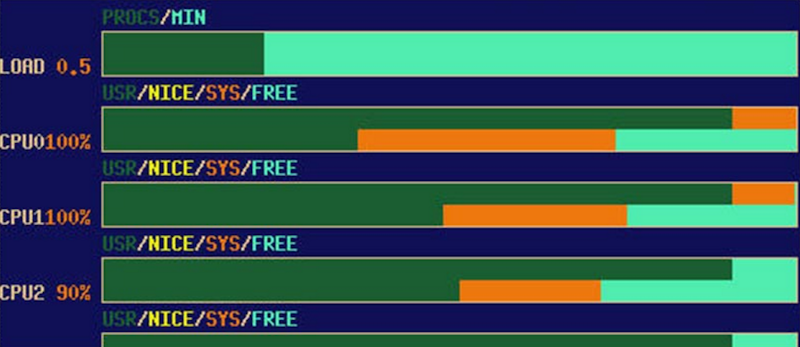
30. nmon
nmon - a system monitoring utility that displays information about the CPU, RAM, network, disks, both in the form of graphs and in numerical data, file systems, NFS, the most stressful processes, resources.
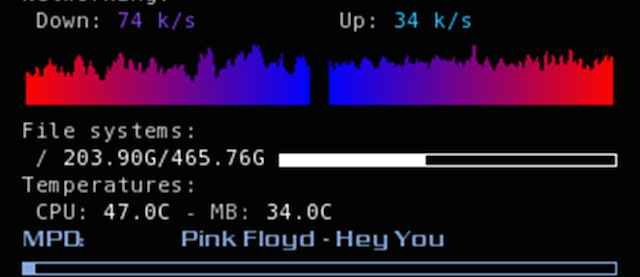
31. conky
conky is a multifunctional, fully customizable system monitor for Linux and BSD systems that monitors many system indicators, such as CPU, memory, swap, disk sizes, temperature, download and download speeds, system messages and much more.
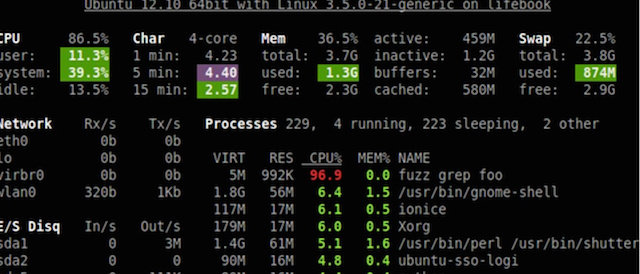
32. Glances
Glances - a utility for monitoring system resources in real time, monitors in one window, displays information about CPU usage, Load Average, RAM and Swap usage, interface bit rate, sensor data (only in Linux), input / output bit rate, FS usage process information.
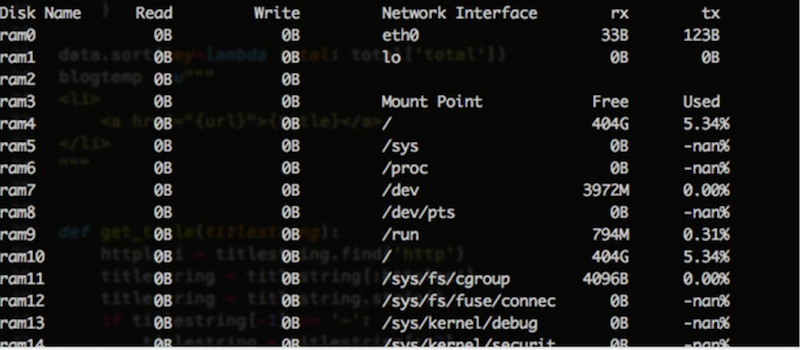
33. saidar
saidar is a small tool that displays basic information about system resources (shows the load of the processor, memory, processes and network interfaces).
34. RRDtool
RRDtool is a utility for monitoring network and hardware resources, the set of RRDtool utilities is designed to store, process and display any data that changes over time, this includes network traffic, network bandwidth, CPU and RAM load, temperature.
RRDTool collects information and creates graphs, information is stored in a ring database. The size of the database remains constant because the cells are cycled.
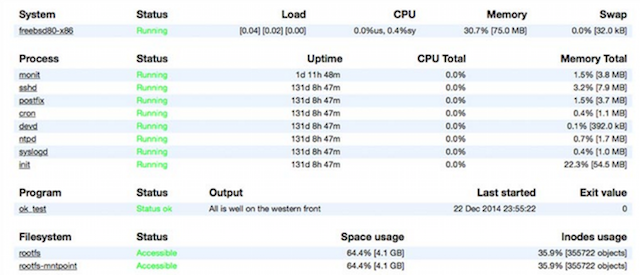
35. monit
monit - the utility performs the same functions as monitord, monitors the status of services, sends notifications of various events by email, takes actions to restart services, depending on the conditions. It is possible to monitor the status of the system both from the command line and through its own monit web server.
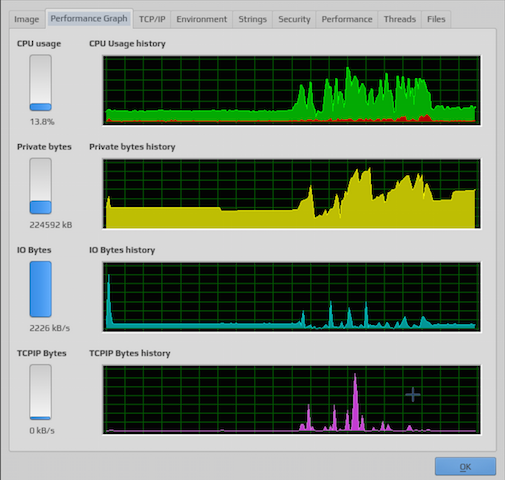
36.Linux process explorer
Linux process explorer is a compact but powerful C ++ / QT graphical application for viewing active processes (task manager) and monitoring system status (system monitor) in detail
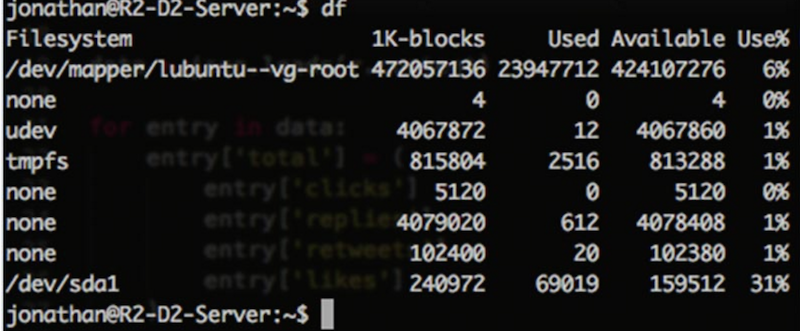
37. df
df - utility that displays data on the amount of free disk space of a specified file system or the file system to which the specified file belongs, reports its size, mount points. If neither a file nor a file system is specified, the utility displays statistics for all mounted file systems. The values displayed correspond to the number of 512-byte blocks.
38. discus
discus - similar to df, the graphically different output looks nicer)

39. xosview
xosview - is a classic tool for monitoring the system, it is simple, displays the current state of the system in the form of a set of graphic stripes, the length and width of which depends on the size of the window.
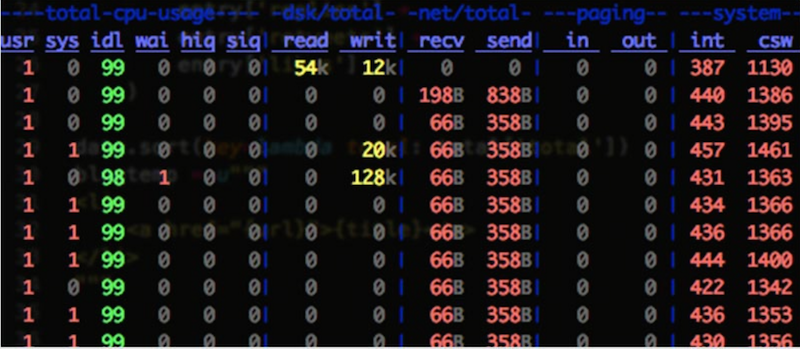
40. Dstat
Dstat is a good utility to monitor system status, analyze performance and diagnose failures interactively. You can connect a variety of modules to monitor various services (mysql, nfs, postfix). Universal replacement for Vmstat, IOSTAT, NetStat and ifstat.
41. Net-SNMP
SNMP - the OSI model protocol, was designed to test the functioning of network routers and bridges, then the scope of the protocol covered other network devices, such as hubs, gateways, terminal servers, LAN Manager servers, and machines running Windows NT.
Net-SNMP Utilities - for monitoring router settings.
42. incron
incron (INotify CRON) - a package of utilities, you can run scripts on events on the file system using the Linux inotify kernel notification system. A utility is like cron, but as a lever to execute a command, it’s not time, but the coincidence of a given file system event in relation to a specified file.
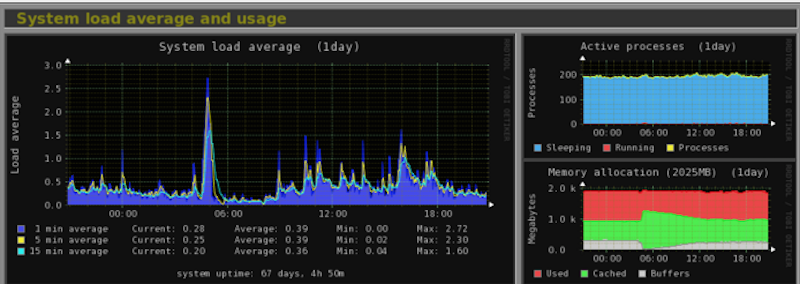
43. monitorix
monitorix - a simple tool for monitoring the system, you can control the load and temperature of the processor, RAM, hard drives and other equipment. It was originally created for use in Linux / UNIX production servers, but can be used on embedded devices.
44. vmstat
vmstat - statistics of virtual memory, a small built-in tool that tracks and displays brief information about the state of memory in the computer.

45. uptime
uptime - a utility that shows the current time, time after boot, the number of current users in the computer system and the load for the last 1, 5 and 15 minutes.
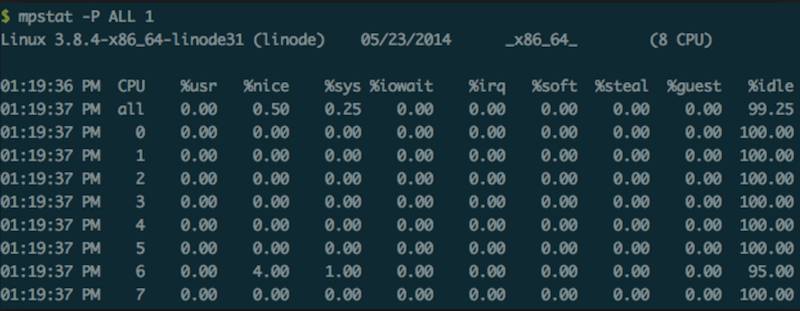
46. mpstat is a built-in tool that tracks the use of processors in the system. The most commonly used mpstat -P ALL command shows detailed statistics of all system processes.
47. pmap
pmap - displays data on the distribution of memory between processes, allows you to find the cause of bottlenecks associated with the use of memory.
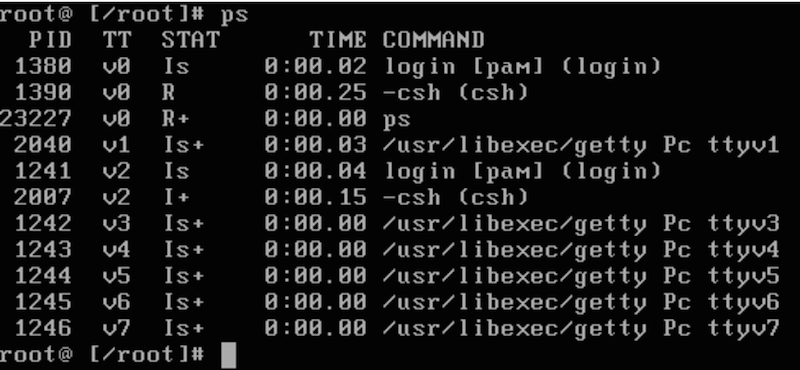
48. ps
ps - a utility for monitoring processes in real time, shows a list of all processes that were running at the time this program was launched, works faster than top, focuses on viewing the PID of a specific process and the entire command line of each process.
49. sar
sar - a utility, part of the Systat package, used to monitor various Linux subsystems (processor, memory, I / O) in real time. A powerful utility, it is convenient when you need to collect activity information for a certain period for future use.
50. collectl
collectl - a utility for monitoring CPU, network load, monitors performance and collects statistics from various equipment, various services such as bind, apache, openvpn, mysql and others.
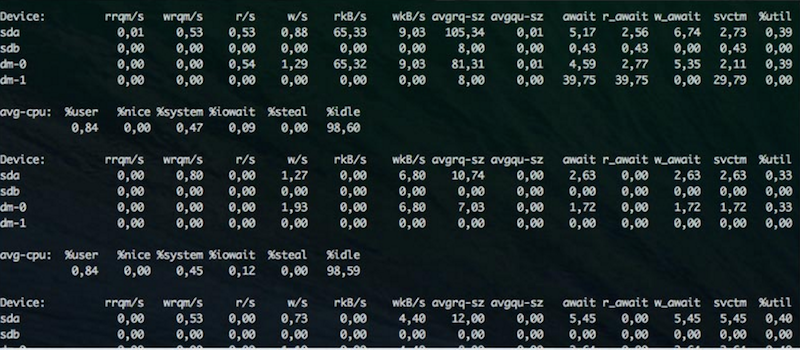
51. iostat
iostat - a utility for identifying bottlenecks associated with a disk, provides information about disk I / O and processor usage.
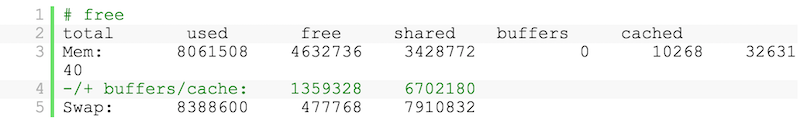
52. free
free - the utility displays information about the full amount of memory, free and occupied part of the memory, including swap sections.
53. / Proc file system
/ Proc file system - the file system makes it possible to study the Linux kernel from the inside). From these statistics you can get detailed information about the various hardware devices on your computer.
54. GKrellM
GKrellM is a customizable widget with various themes that displays on the desktop data about the system device: CPU, temperature, memory, network and so on.
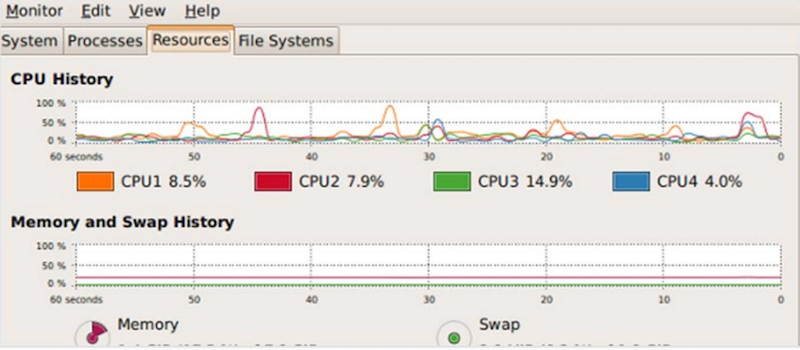
55. Gnome system monitor
Gnome system monitor - monitors the operation of the system, the utility displays graphs of real-time information about resources - processor usage (CPU), use of random access memory (RAM) and swap file (SWAP), as well as network usage.
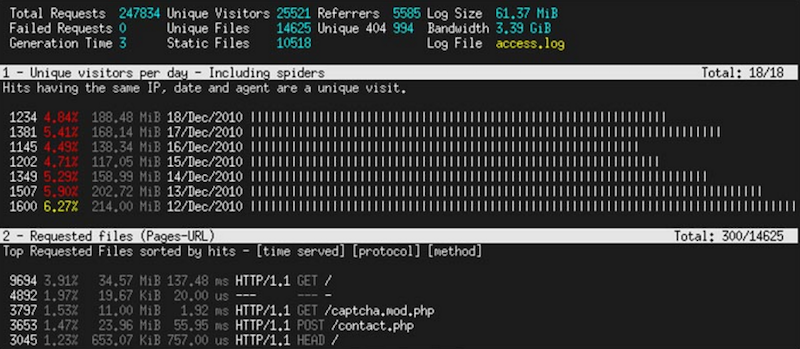
56. GoAccess
GoAccess is a utility with which you can analyze web server logs and build reports (analysis of access logs to your sites) in real time. In addition, data can be output in HTML, JSON or CSV. Displays general statistics, top visitors, 404, geolocation and much more.
57. Logwatch
Logwatch - analyzes the system logs according to various criteria with the ability to compile a report and send it by mail, built on a modular principle, you can create your own criteria for analysis.
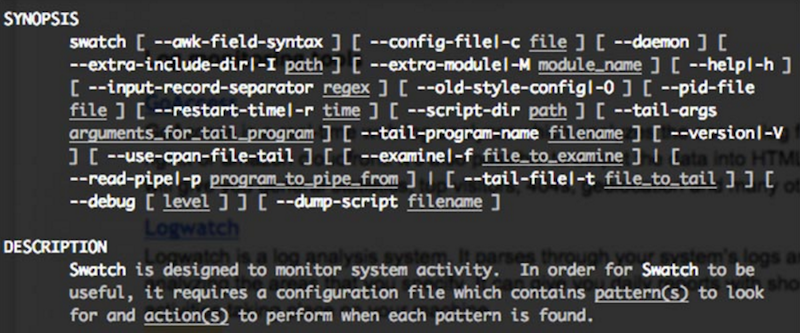
58. Swatch
Swatch - a utility for active monitoring of logs, controls almost any type of log file.
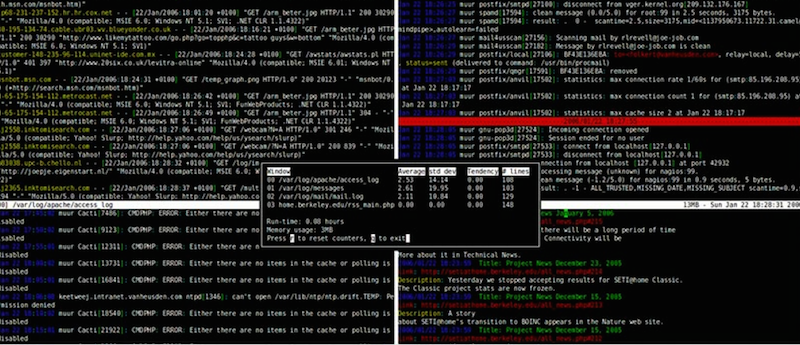
59. MultiTail
MultiTail is a console tool, you can monitor the log files, as well as the output of other commands (such as rsstail, wtmptail, negtail), can split the terminal into many small windows.
60. acct or psacct
acct or psacct - utilities for monitoring users and applications that work or worked in the system, works in background mode and collects data in logs, you can track the amount of resources consumed by a particular application.
61. whowatch
whowatch is a utility that tracks users on your system and allows you to see in real time which commands and processes they use.
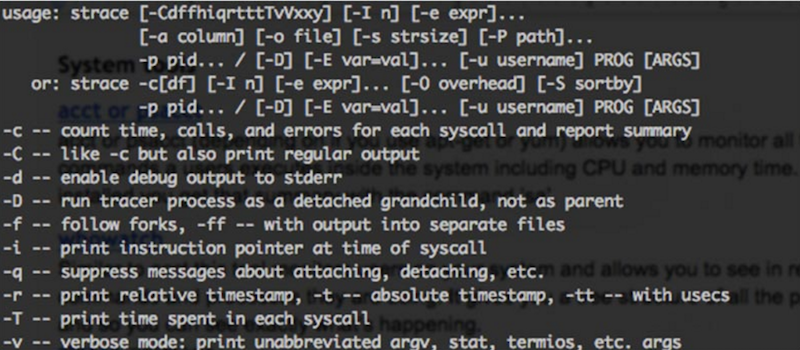
62. strace
strace - a utility that tracks the system calls that the specified process makes, as well as what signals it receives.
63. DTrace
DTrace is the big brother of strace, a utility for debugging iOS applications, it is needed when debugging complex cases, when you need to set rules for filtering functions that are called, the utility is not for the faint of heart, you need to study the "1000 and 1" book to work with it.
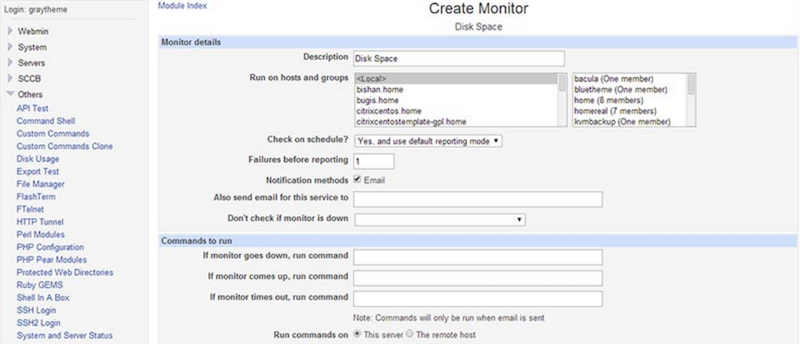
64. webmin
webmin is a web-based tool for system administration, eliminates the need to manually edit Unix configuration files, allows you to remotely control the system if necessary, you can configure user accounts, Apache server, DNS, file server and more.
65. stat
stat - a built-in tool that displays information about the status of files and file systems, displays data on how, when the file was changed, or on how to edit it.
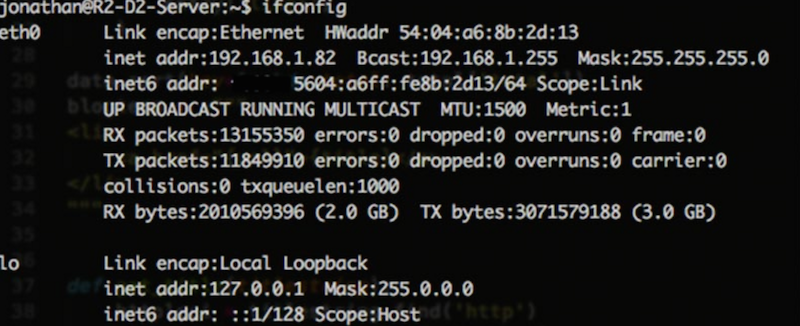
66. ifconfig
ifconfig - the command allows you to configure network interfaces.
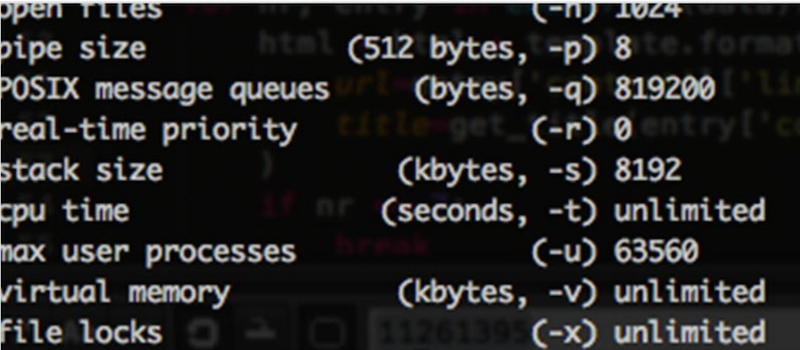
67. ulimit
ulimit - a utility, with its help you can set restrictions on system-wide resources, provides control over resources for the shell and processes running under its control, is built into the bash interpreter. The limit values are usually specified in 1024-byte blocks.
68. cpulimit
cpulimit is a small utility that will help limit the use of the CPU process.
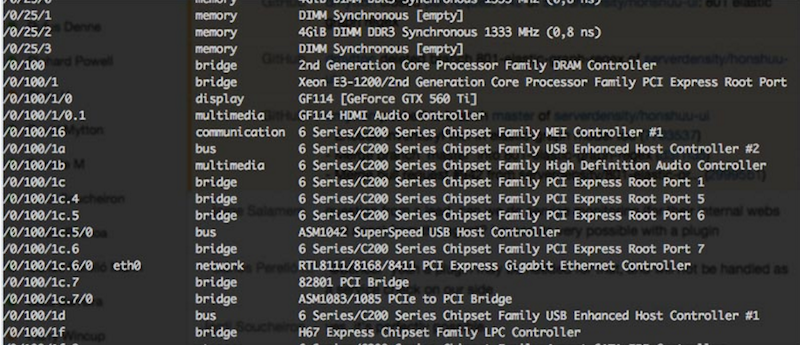
69. lshw
lshw - a small utility that provides detailed information about computer hardware configuration, displays data on memory, firmware version, motherboard device, type and speed of the processor, cache configuration, bus frequencies.
70. w
w - a built-in command that displays information about users who are currently using the machine, a brief account of the current activity in the system.
71. lsof
lsof (List Of Opened Files) - a utility for displaying information about which files are used by certain processes.

72. Server Density
Server Density is a Linux monitoring tool that allows you to configure alerts and view graphs for system and network metrics.
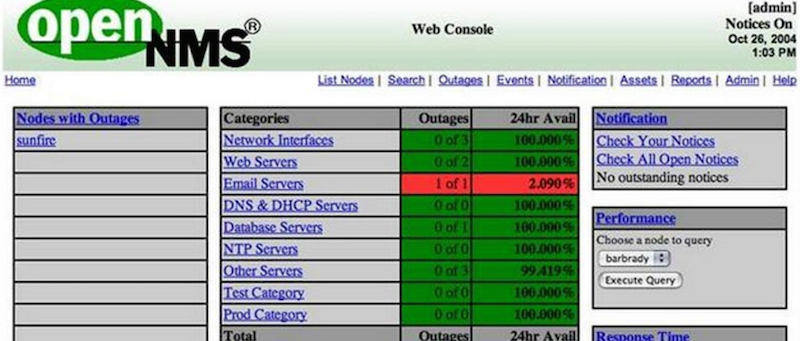
73. OpenNMS
OpenNMS - monitors various services and internal systems of network and server equipment.
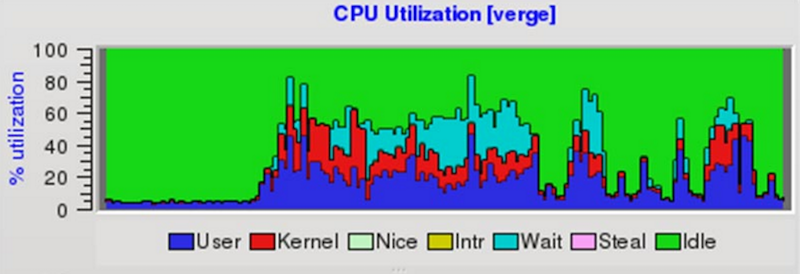
74. SysUsage
SysUsage is a utility that works on all unix platforms and displays detailed information about processors, memory, input / output devices, network devices, files, processes and temperature sensors. Charts are created using rrdtool.

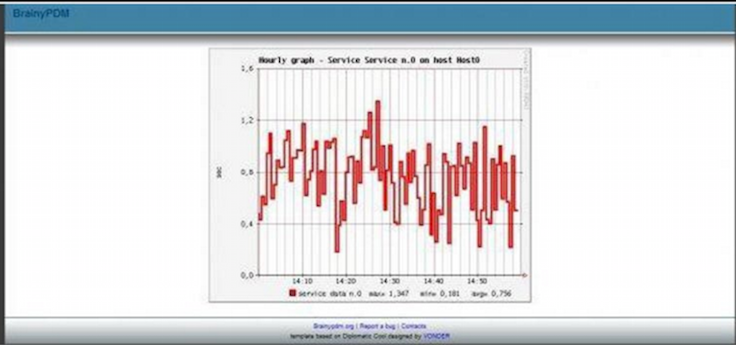
75. brainypdm
brainypdm is a web-based data management and monitoring tool that collects performance data using nagios.
76. PCP
PCP - allows you to collect metrics from multiple hosts, you can access the graph data through a web interface or GUI. Well suited for monitoring large systems.
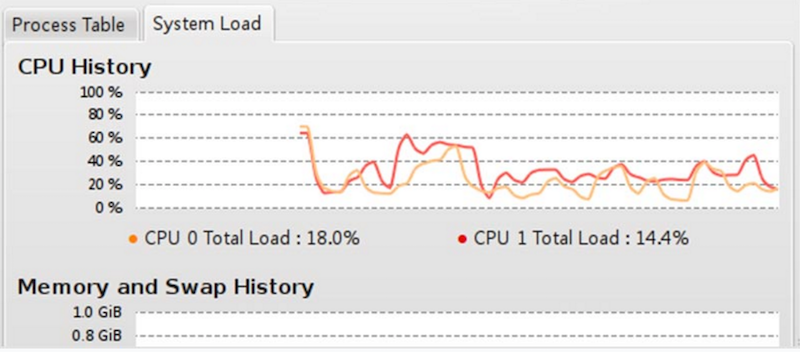
77. KDE system guard
KDE system guard - task manager, graphical monitor that provides real-time system information, an application for KDE, allows monitoring of local and remote hosts.
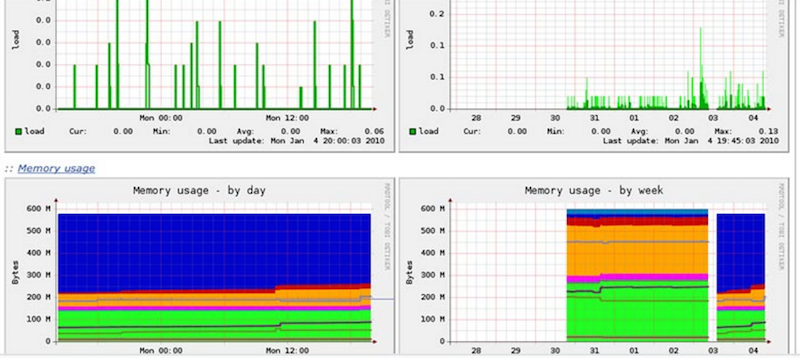
78. Munin
Munin - An OpenSource project that is written in Perl and uses RRDtool, a resource monitoring tool that collects data from several servers at the same time and displays everything in graphs (all past server events, load).
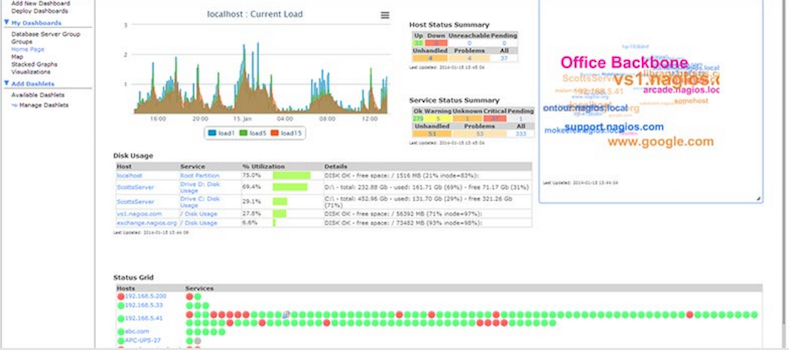
79. Nagios
Nagios - applications for complete monitoring of the system and networks.
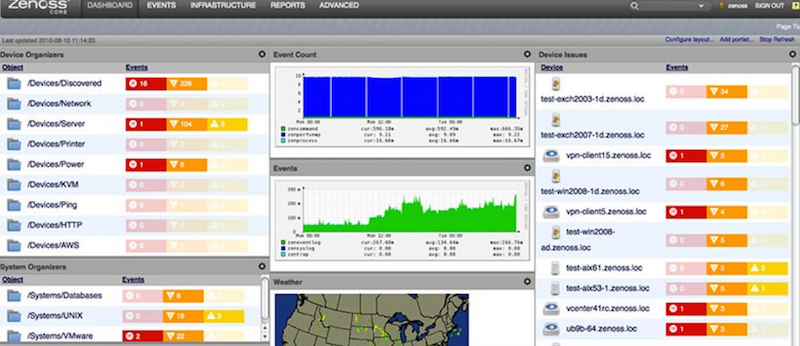
80.Zenoss
Zenoss is a monitoring system that monitors the status of devices on the network, which can help prevent problems before they occur, the auto-detection function allows you to quickly collect information about all active systems on the network, the Zenoss kernel analyzes the environment, which makes it possible to quickly deal with a large number of specific devices.
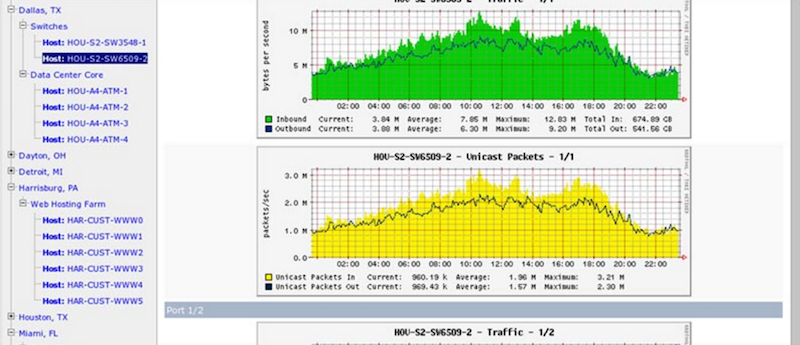
81. Cacti
Cacti - using the SNMP protocol, takes statistics from devices, through the RRD-tool makes visual graphs, whether using disk space on a file server, or loading switch interfaces.
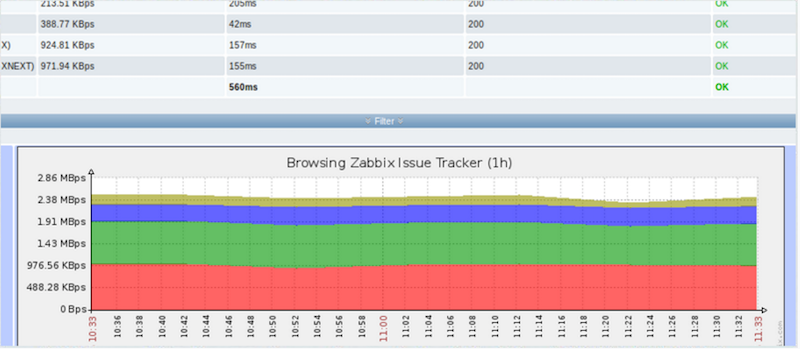
82. Zabbix
Zabbix is a monitoring system that consists of several subsystems, and all of them can be located on different machines, used to monitor servers (mainly).
83. collectd
collectd - collects statistics on the use of resources, an easily customizable tool.
84. Observium
Observium - a system for monitoring and monitoring network devices and servers.
85. Nload
Nload is a command-line tool that controls network bandwidth, if there is a need to get a visual representation of the load on the network interfaces of the system, see general statistics on network traffic.
You can install it with:
or:
84. SmokePing
SmokePing is a utility for accumulating information about delays in transmission and packet loss, displays all the states in the form of graphs, and you can control the speed of services responding to requests.
85. MobaXterm
MobaXterm comes to the rescue and allows you to use many of the terminal commands that are commonly found on Linux if you are running on Windows.
86. Shinken monitoring
Shinken monitoring - a monitoring system that is flexible in configuration, a lot of compatible software, with its own WebUI, with a wide range of supported network and server equipment.
a source
1. the first tool - top The
console command top is a convenient system monitor, easy to use, with which a list of processes running in the system and information about these processes is displayed. This command sorts them in real time by the load on the processor; the tool is preinstalled on many UNIX systems.
2. htop
htop - the system monitor, as an alternative to the top command, shows a dynamic list of all (unlike top) system processes, continuous operation time, CPU and memory usage.
3. atop
atop - an interactive monitor, similar to top, displays new changes about active processes in the system. A good tool for tracking bottlenecks, monitoring the load of the central processing unit, RAM, computer network. Due to the fact that it works continuously, it can load the server. It combines the capabilities of top, netstat, iostat, accounting and others. Saves data to a file of its own binary format (writes the state of the system to a compressed file).
4. apachetop
apachetop - a console utility that monitors real-time traffic, splits apache logs and displays output on the screen, in a word shows a detailed picture of the use of your sites.
5. ftptop
ftptop utility provides basic information about all current ftp connections to the server, information about the total number of sessions, the number of downloads and downloads, who the client is. Allows you to see users connected to the ftp server.
6. mytop
An interesting, convenient, and useful utility called mytop. Similar to top for Unix systems, mytop scans all calls to the MySQL server in real time.
7. powertop
powertop is a utility that allows you to detect components in the system that consume more power than you need on your laptop, and shows the total power consumption (in W), information is read from various sources of the kernel. This will allow you to manage / experiment with power management settings, effectively configure the energy consumption for your machine.
8. iotop
iotop - the utility is similar to the top utility, but it displays not the CPU and memory usage, but the work of processes with disks, written in Python. It will help you determine which process is accessing your Linux hard drive. Displays active processes that are currently performing I / O operations with the disk, collects statistics for a certain time.
Network related monitoring
9. ntopng
ntopng is the next generation of ntop, the tool allows you to monitor how much, what and which IP has been pumped through the interface on the gateway, shows the distribution of IP traffic, host geolocation, and network traffic analysis.
10. iftop
iftop - displays information about active network connections, network download / upload speed, monitors online traffic, shares traffic by protocols, interfaces and hosts.
iftop is similar to top in terms of network usage.
11. jnettop
jnettop visualizes network traffic similar to iftop, monitors network activity. A utility for monitoring traffic in real time.
12. bandwidthd
bandwidthd - a utility for controlling end-user traffic, builds summary tables (html) and graphs for each user by IP and subnet, disaggregated by day, week and month.
13. EtherApe
EtherApe - shows network traffic in the form of a graph, shows not only connections, but also the flow for each of them, the type of protocol by port number, network activity of different hosts. On the graph, the nodes are displayed in the form of a ring, and the connections in the form of lines, and so, the more intense the traffic, the thicker the connecting lines, different types of traffic are indicated in different colors.
14. ethtool
ethtool is a Linux network interface configuration utility. This means that bond0, tun0, and other devices that are not physical, cannot be viewed or edited using ethtool.
15. NetHogs
NetHogs - a utility that monitors any network activity of all processes on the computer, similar to top only for the network. The utility is in standard repositories and is installed with just one command:
sudo apt-get install nethogs
You can run the utility only with root privileges:
sudo nethogs
16. iptraf
iptraf - a utility for monitoring network interfaces, monitors traffic over all TCP connections, provides statistics on the loading of network interfaces, protocols, ports, packet sizes.
17. ngrep
ngrep - the same grep only at the network level, serves to select and view the contents of packages, is a pcap-compatible utility, allows you to use hexadecimal strings when defining patterns.
18. MRTG
MRTG - utility monitors network links. MRTG output generates html pages with charts in png.
19. bmon
bmon - a utility for monitoring several network interfaces in real time at once, supports various input / output methods and filters, shows the load of the network interface in the form of a graph, the total load of the network interface is displayed in the form of a table.
20. traceroute
traceroute - a utility with the help of which it is possible to determine on which part of the IP network a failure has occurred, to “investigate” IP networks (routing, DNS servers, data backbone, also known as backbone, subnet system, etc.)
21 . IPTState
IPTState - displays statistics of open ports in the form of a table with IP addresses. An effective tool that monitors IP traffic, displays both general statistics for all network interfaces and detailed statistics for a single taken interface.
22. darkstat
darkstat - monitors network traffic, displays network usage statistics, sends reports via http. The collected information about the speed, the number of transmitted packets, bytes, visited hosts and host data is displayed in the form of a web page.
23. vnStat
vnStat - a utility for accounting for network traffic, saves the history of network traffic for the selected interfaces, traffic is considered both incoming and outgoing for each interface. vnStat gets data from the Linux kernel.
24. netstat
netstat - the utility is used to check active TCP connections, displays information about the protocol used, the local address and port number, the external address and port number, as well as information about the connection status.
25. ss
ss - a utility that can be used instead of netstat, it can display more detailed information and faster if you want to display summary statistics - this utility is for you. ss collects and displays information about all TCP and UDP ports, open ssh / ftp / http / https connections, etc.
26. nmap
nmap - the utility allows you to scan the server, determines which OS is installed, you can find out if the computer is protected by any packet filters or firewall and many other features (an open-source utility for network research and security verification).
20 examples of the nmap
27 command . MTR
MTR is a network diagnostic utility that combines the capabilities of the traceroue and ping programs, examines the connections between the node on which it is running and the target node, the program allows you to determine the node on which packet loss occurs.
28. Tcpdump
Tcpdump - displays packet headers passing through the network interface that match the boolean expression, is included in most Unix distributions and allows you to intercept and display / save network traffic to a file. Using tcpdump, you can analyze traffic at the network level (ARP, ICMP), at the transport level (TCP, UDP).
29. Justniffer
Justniffer is a console utility for analyzing traffic, an HTTP protocol sniffer based on pcap and tailored for TCP.
System related monitoring
30. nmon
nmon - a system monitoring utility that displays information about the CPU, RAM, network, disks, both in the form of graphs and in numerical data, file systems, NFS, the most stressful processes, resources.
31. conky
conky is a multifunctional, fully customizable system monitor for Linux and BSD systems that monitors many system indicators, such as CPU, memory, swap, disk sizes, temperature, download and download speeds, system messages and much more.
32. Glances
Glances - a utility for monitoring system resources in real time, monitors in one window, displays information about CPU usage, Load Average, RAM and Swap usage, interface bit rate, sensor data (only in Linux), input / output bit rate, FS usage process information.
33. saidar
saidar is a small tool that displays basic information about system resources (shows the load of the processor, memory, processes and network interfaces).
34. RRDtool
RRDtool is a utility for monitoring network and hardware resources, the set of RRDtool utilities is designed to store, process and display any data that changes over time, this includes network traffic, network bandwidth, CPU and RAM load, temperature.
RRDTool collects information and creates graphs, information is stored in a ring database. The size of the database remains constant because the cells are cycled.
35. monit
monit - the utility performs the same functions as monitord, monitors the status of services, sends notifications of various events by email, takes actions to restart services, depending on the conditions. It is possible to monitor the status of the system both from the command line and through its own monit web server.
36.Linux process explorer
Linux process explorer is a compact but powerful C ++ / QT graphical application for viewing active processes (task manager) and monitoring system status (system monitor) in detail
37. df
df - utility that displays data on the amount of free disk space of a specified file system or the file system to which the specified file belongs, reports its size, mount points. If neither a file nor a file system is specified, the utility displays statistics for all mounted file systems. The values displayed correspond to the number of 512-byte blocks.
38. discus
discus - similar to df, the graphically different output looks nicer)
39. xosview
xosview - is a classic tool for monitoring the system, it is simple, displays the current state of the system in the form of a set of graphic stripes, the length and width of which depends on the size of the window.
40. Dstat
Dstat is a good utility to monitor system status, analyze performance and diagnose failures interactively. You can connect a variety of modules to monitor various services (mysql, nfs, postfix). Universal replacement for Vmstat, IOSTAT, NetStat and ifstat.
41. Net-SNMP
SNMP - the OSI model protocol, was designed to test the functioning of network routers and bridges, then the scope of the protocol covered other network devices, such as hubs, gateways, terminal servers, LAN Manager servers, and machines running Windows NT.
Net-SNMP Utilities - for monitoring router settings.
42. incron
incron (INotify CRON) - a package of utilities, you can run scripts on events on the file system using the Linux inotify kernel notification system. A utility is like cron, but as a lever to execute a command, it’s not time, but the coincidence of a given file system event in relation to a specified file.
43. monitorix
monitorix - a simple tool for monitoring the system, you can control the load and temperature of the processor, RAM, hard drives and other equipment. It was originally created for use in Linux / UNIX production servers, but can be used on embedded devices.
44. vmstat
vmstat - statistics of virtual memory, a small built-in tool that tracks and displays brief information about the state of memory in the computer.
45. uptime
uptime - a utility that shows the current time, time after boot, the number of current users in the computer system and the load for the last 1, 5 and 15 minutes.
46. mpstat is a built-in tool that tracks the use of processors in the system. The most commonly used mpstat -P ALL command shows detailed statistics of all system processes.
47. pmap
pmap - displays data on the distribution of memory between processes, allows you to find the cause of bottlenecks associated with the use of memory.
48. ps
ps - a utility for monitoring processes in real time, shows a list of all processes that were running at the time this program was launched, works faster than top, focuses on viewing the PID of a specific process and the entire command line of each process.
49. sar
sar - a utility, part of the Systat package, used to monitor various Linux subsystems (processor, memory, I / O) in real time. A powerful utility, it is convenient when you need to collect activity information for a certain period for future use.
50. collectl
collectl - a utility for monitoring CPU, network load, monitors performance and collects statistics from various equipment, various services such as bind, apache, openvpn, mysql and others.
51. iostat
iostat - a utility for identifying bottlenecks associated with a disk, provides information about disk I / O and processor usage.
52. free
free - the utility displays information about the full amount of memory, free and occupied part of the memory, including swap sections.
53. / Proc file system
/ Proc file system - the file system makes it possible to study the Linux kernel from the inside). From these statistics you can get detailed information about the various hardware devices on your computer.
54. GKrellM
GKrellM is a customizable widget with various themes that displays on the desktop data about the system device: CPU, temperature, memory, network and so on.
55. Gnome system monitor
Gnome system monitor - monitors the operation of the system, the utility displays graphs of real-time information about resources - processor usage (CPU), use of random access memory (RAM) and swap file (SWAP), as well as network usage.
Log monitoring tools
56. GoAccess
GoAccess is a utility with which you can analyze web server logs and build reports (analysis of access logs to your sites) in real time. In addition, data can be output in HTML, JSON or CSV. Displays general statistics, top visitors, 404, geolocation and much more.
57. Logwatch
Logwatch - analyzes the system logs according to various criteria with the ability to compile a report and send it by mail, built on a modular principle, you can create your own criteria for analysis.
58. Swatch
Swatch - a utility for active monitoring of logs, controls almost any type of log file.
59. MultiTail
MultiTail is a console tool, you can monitor the log files, as well as the output of other commands (such as rsstail, wtmptail, negtail), can split the terminal into many small windows.
System tools
60. acct or psacct
acct or psacct - utilities for monitoring users and applications that work or worked in the system, works in background mode and collects data in logs, you can track the amount of resources consumed by a particular application.
61. whowatch
whowatch is a utility that tracks users on your system and allows you to see in real time which commands and processes they use.
62. strace
strace - a utility that tracks the system calls that the specified process makes, as well as what signals it receives.
63. DTrace
DTrace is the big brother of strace, a utility for debugging iOS applications, it is needed when debugging complex cases, when you need to set rules for filtering functions that are called, the utility is not for the faint of heart, you need to study the "1000 and 1" book to work with it.
64. webmin
webmin is a web-based tool for system administration, eliminates the need to manually edit Unix configuration files, allows you to remotely control the system if necessary, you can configure user accounts, Apache server, DNS, file server and more.
65. stat
stat - a built-in tool that displays information about the status of files and file systems, displays data on how, when the file was changed, or on how to edit it.
66. ifconfig
ifconfig - the command allows you to configure network interfaces.
67. ulimit
ulimit - a utility, with its help you can set restrictions on system-wide resources, provides control over resources for the shell and processes running under its control, is built into the bash interpreter. The limit values are usually specified in 1024-byte blocks.
68. cpulimit
cpulimit is a small utility that will help limit the use of the CPU process.
69. lshw
lshw - a small utility that provides detailed information about computer hardware configuration, displays data on memory, firmware version, motherboard device, type and speed of the processor, cache configuration, bus frequencies.
70. w
w - a built-in command that displays information about users who are currently using the machine, a brief account of the current activity in the system.
71. lsof
lsof (List Of Opened Files) - a utility for displaying information about which files are used by certain processes.
Infrastructure monitoring tools
72. Server Density
Server Density is a Linux monitoring tool that allows you to configure alerts and view graphs for system and network metrics.
73. OpenNMS
OpenNMS - monitors various services and internal systems of network and server equipment.
74. SysUsage
SysUsage is a utility that works on all unix platforms and displays detailed information about processors, memory, input / output devices, network devices, files, processes and temperature sensors. Charts are created using rrdtool.
75. brainypdm
brainypdm is a web-based data management and monitoring tool that collects performance data using nagios.
76. PCP
PCP - allows you to collect metrics from multiple hosts, you can access the graph data through a web interface or GUI. Well suited for monitoring large systems.
77. KDE system guard
KDE system guard - task manager, graphical monitor that provides real-time system information, an application for KDE, allows monitoring of local and remote hosts.
78. Munin
Munin - An OpenSource project that is written in Perl and uses RRDtool, a resource monitoring tool that collects data from several servers at the same time and displays everything in graphs (all past server events, load).
79. Nagios
Nagios - applications for complete monitoring of the system and networks.
80.Zenoss
Zenoss is a monitoring system that monitors the status of devices on the network, which can help prevent problems before they occur, the auto-detection function allows you to quickly collect information about all active systems on the network, the Zenoss kernel analyzes the environment, which makes it possible to quickly deal with a large number of specific devices.
81. Cacti
Cacti - using the SNMP protocol, takes statistics from devices, through the RRD-tool makes visual graphs, whether using disk space on a file server, or loading switch interfaces.
82. Zabbix
Zabbix is a monitoring system that consists of several subsystems, and all of them can be located on different machines, used to monitor servers (mainly).
Bonus
83. collectd
collectd - collects statistics on the use of resources, an easily customizable tool.
84. Observium
Observium - a system for monitoring and monitoring network devices and servers.
85. Nload
Nload is a command-line tool that controls network bandwidth, if there is a need to get a visual representation of the load on the network interfaces of the system, see general statistics on network traffic.
You can install it with:
1 yum install nload
or:
1 sudo apt-get install nload
84. SmokePing
SmokePing is a utility for accumulating information about delays in transmission and packet loss, displays all the states in the form of graphs, and you can control the speed of services responding to requests.
85. MobaXterm
MobaXterm comes to the rescue and allows you to use many of the terminal commands that are commonly found on Linux if you are running on Windows.
86. Shinken monitoring
Shinken monitoring - a monitoring system that is flexible in configuration, a lot of compatible software, with its own WebUI, with a wide range of supported network and server equipment.
a source