Visual Studio 2015 Standard Library and Telemetry
Preamble
C and C ++ programs tend to spend most of their lives inside functions
main()and functions directly or indirectly called from main(). However, in fact, the execution of the program does not begin at all with main(), but with some code from the standard library that comes with the compiler. Such code, in theory, should prepare the environment for other functions of the standard library that it might call main(), as well as the parameters itself main()(under Windows; Unix systems tend to transmit argc/argv/envpin a prepared form right at the start of the process, but this is not about them). Symmetrically, the terminating returnfunction main()is not the last instruction of the program at all, after it a little more code from the standard library follows.In Visual Studio, the “real” entry point to the program is called
mainCRTStartup. The source code for the standard library is bundled with VS; in VS2015, the definition mainCRTStartupis in %PROGRAMFILES(X86)%\VC\crt\src\vcruntime\exe_main.cpp, but, however, it does all the work exe_common.inlnearby. Let's see there....
// If this module has any thread-local destructors, register the
// callback function with the Unified CRT to run on exit.
_tls_callback_type const * const tls_dtor_callback = __scrt_get_dyn_tls_dtor_callback();
if (*tls_dtor_callback != nullptr && __scrt_is_nonwritable_in_current_image(tls_dtor_callback))
{
_register_thread_local_exe_atexit_callback(*tls_dtor_callback);
}
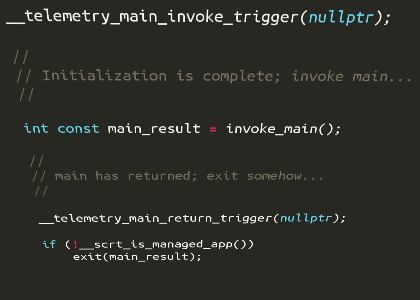
__telemetry_main_invoke_trigger(nullptr);
//
// Initialization is complete; invoke main...
//
int const main_result = invoke_main();
//
// main has returned; exit somehow...
//
__telemetry_main_return_trigger(nullptr);
if (!__scrt_is_managed_app())
exit(main_result);
if (!has_cctor)
_cexit();
// Finally, we terminate the CRT:
__scrt_uninitialize_crt(true, false);
return main_result;
...
Go deeper
Experienced paranoids have undoubtedly already paid attention to the challenges
__telemetry_main_invoke_triggerand __telemetry_main_return_trigger. Let's try to find their source ... and figurines. When you try to go inside these functions, the VS debugger reports “telemetry.cpp not found” (which means that the source file that MS “forgot” to include in the delivery is called telemetry.cpp. Logically) and offers to either specify the path manually or go to the disassembled code. A careful search for other functions from telemetry.cpp finds a couple more functions
__vcrt_initialize_telemetry_providerand __vcrt_uninitialize_telemetry_provider, called during initialization and completion, respectively. Of course, failure to provide the source yet does not mean the inability to look inside. Looking at the disassembled code results in a variable of type _Microsoft_CRTProvider
const __vcrt_trace_logging_provider::_TlgProvider_t* const, and type_TlgProvider_tit is no longer secret and is easily located in the SDK: %PROGRAMFILES(X86)%\Windows Kits\10\Include\10.0.10586.0\shared\TraceLoggingProvider.h... and here is the documentation . (The documentation says "Windows 10", which, however, does not prevent the code from working under Windows 7.) So, well, where does it write all these logs?TraceLogging events are sent to ETW as described in this section.That is, this is another incarnation of the Event Tracing for Windows subsystem . Yeah.
A quick reference for those who first hear the abbreviation ETW: this is an infrastructure for the unified processing of all kinds of logs and counters, which appeared in Windows 2000 and received a serious increase in Vista. Those who wish can type on the command line
logman query providersto assess the scale.We look at the logs
Take some simple program, for example:
#include
int main()
{
	printf("Hello, World!\n");
	return 0;
}
The result of compilation with the command
cl /Os hello.c: yadi.sk/d/pa0S5qVoqw9Q4So, in the compiled exe-shnik there should be a record of some logs before and after the call
main(). The ETW subsystem simply discards everything for which there was no command to maintain logs. Let's turn on the logs: administrator name,logman create trace test_crt_telemetry -p {5EEC90AB-C022-44B2-A5DD-FD716A222A15} -o C:\temp\test_telemetry
logman start test_crt_telemetry(
logmanand what is needed later tracerpt- standard utilities from Windows). Where did I get {5EEC90AB-C022-44B2-A5DD-FD716A222A15}? The VS debugger showed when viewing the already mentioned variable _Microsoft_CRTProvider. We start hello.exe, we see a classical greeting. We reset the logs to a file,
logman stop test_crt_telemetryand look what is written there:
tracerpt -summary summary.txt -o dumpfile.xml C:\temp\test_telemetry_000001.etl17 0 5 0 0 0x200000000000 Main Invoked.C:\temp\hello.exe InvokeMainViaCRT 77 0 5 0 0 0x200000000000 Main Returned.C:\temp\hello.exe ExitMainViaCRT Yes, there are logs. However, there is not much data: in addition to the actual call / return message
main()and standard ETW headers, only the name of the exe-shnik is written. By the way, what if you leave the log entry turned on and work? You can catch, for example,
Main Invoked.C:\Program Files\Python 3.5\python35.dll Main Invoked.C:\Program Files\Python 3.5\python.exe Main Returned.C:\Program Files\Python 3.5\python.exe Main Returned.C:\Program Files\Python 3.5\python35.dll Don't panic
What do we have in the end?
- Any binary compiled by VS2015 from a C or C ++ program has code that can write logs. (boring-mode: if you don’t take special efforts to disable the standard library. However, if you can still write in C without it, then in C ++ - only until the first exception)
- Logs are scanty, there is nothing particularly interesting that the system would not have known without that. You can distinguish between the cases “
main()regularly returned control” and “someone calledexitorabort”, but this is more interesting for the developer to debug. Paranoid people can relax. - But the precedent itself is interesting.
- By default, logs are not written anywhere. They need to be included specifically. However, the inclusion command may not know anything at all about the program, or about the subject area (neither logman nor tracerpt is aware of the concrete
Microsoft.CRTProvider- the entire structure of the logs above is written together with the logs). - You can check if the logs are enabled with the following code:
(It will not work under XP due to the lack of the necessary APIs. However, for exactly the same reason, XP logging is always disabled. Exe-shnik for the lazy: yadi.sk/d/pvQkFUqKqwJSV )#include#include static void NTAPI EnableCallback(LPCGUID, ULONG isEnabled, UCHAR, ULONGLONG, ULONGLONG, PEVENT_FILTER_DESCRIPTOR, PVOID context) { *(bool*)context = (bool)isEnabled; } typedef ULONG (WINAPI *EventSetInformation_t)(REGHANDLE, EVENT_INFO_CLASS, PVOID, ULONG); #pragma pack(push, 1) static struct { unsigned short TotalSize; char ProviderName[22]; unsigned short Chunk1Size; unsigned char Chunk1Type; GUID GroupGuid; } _Microsoft_CRTProvider_traits = { 0x2B, "Microsoft.CRTProvider", 0x13, 1, { 0x4F50731A, 0x89CF, 0x4782, 0xB3, 0xE0, 0xDC, 0xE8, 0xC9, 0x04, 0x76, 0xBA }, }; static_assert(sizeof(_Microsoft_CRTProvider_traits) == 0x2B, "invalid size"); #pragma pack(pop) int main() { static const GUID providerId = { 0x5eec90ab, 0xc022, 0x44b2, 0xa5, 0xdd, 0xfd, 0x71, 0x6a, 0x22, 0x2a, 0x15 }; REGHANDLE hProvider; bool enabled = false; ULONG status = EventRegister(&providerId, &EnableCallback, &enabled, &hProvider); if (status == ERROR_SUCCESS) { EventSetInformation_t EventSetInformation = (EventSetInformation_t)GetProcAddress(GetModuleHandleA("advapi32.dll"), "EventSetInformation"); if (EventSetInformation) EventSetInformation(hProvider, EventProviderSetTraits, &_Microsoft_CRTProvider_traits, sizeof(_Microsoft_CRTProvider_traits)); EventUnregister(hProvider); } printf("Microsoft.CRTProvider logging is %s\n", enabled ? "on" : "off"); return 0; } - It would be most logical to use such logs as a debugging aid. But launching under the debugger itself does not include logs. Of course, it is possible that some checkbox in the settings includes functionality that needs logs ... or logs are needed for some tricky debugging utility ... but then it is not clear why the code remains when compiling with the release library.
UPD from 12:00 04/13/2016: updated the code for detecting the presence of an active user of logs, now it exactly corresponds to what is happening inside __vcrt_initialize_telemetry_provider.