Kernel trace with ftrace
- Tutorial
We have already addressed the problems of kernel tracing and profiling in previous publications . There are many specialized tools for analyzing events at the kernel level: SystemTap , Ktap , Sysdig , LTTNG and others. Many detailed articles and training materials have been published about these tools.
Much less information can be found about the "native" Linux mechanisms, with which you can track system events, receive and analyze debugging information. We would like to consider this topic in today's article. We will pay special attention to ftrace , the first and so far the only trace tool added to the kernel. Let's start by defining the basic concepts.
Kernel profiling and tracing
Kernel profiling is the identification of performance bottlenecks. Using profiling, you can determine exactly where the performance loss occurred in a particular program. Special programs generate a profile - a summary of events, on the basis of which you can find out which functions took the most time. These programs, however, do not help identify the cause of the performance degradation.
Bottlenecks very often arise under certain conditions that cannot be identified during profiling. To understand why an event occurred, it is necessary to restore the context. In turn, tracing is required to restore context .
Tracing refers to obtaining information about what is happening inside a working system. For this, special software tools are used. They record all events in the system, just like a tape recorder records all the sounds of the environment.
Tracer programs can simultaneously track events both at the individual application level and at the operating system level. The information obtained during the trace can be useful for diagnosing and solving many system problems.
Tracing is sometimes compared to logging. There are indeed similarities between the two procedures, but there are differences.
During tracing, information about events that occur at a low level is recorded. Their number is in the hundreds and even thousands. The logs contain information about high-level events that occur much less frequently: for example, users logging in to the system, errors in the operation of applications, transactions in databases, and others.
Like logs, files with trace data can be read “from the worksheet”. It is much more interesting and useful, however, to extract information from them that relates to the operation of specific applications. All tracer programs have the corresponding functions.
There are three main mechanisms in the Linux kernel with the help of which kernel routing and profiling procedures are implemented:
- tracepoints - a mechanism that works through static instrumentation of code;
- kprobes - a dynamic tracing mechanism with which you can interrupt the execution of kernel code anywhere, call your own handler and return to the end of all necessary operations;
- perf_events - PMU (Performance Monitoring Unit) access interface.
We will not describe in detail the features of all these mechanisms; interested readers, we refer to the article of the NTC MetroTek company , as well as to Brendan Gregg's blog .
Using ftrace, you can interact with these mechanisms and get debugging data while in user space. We will talk more about this below. All sample commands are provided for Ubuntu 14.04, the kernel version 3.13.0-24.
Ftrace: general information
The name ftrace is short for Function Trace - function tracing. However, the capabilities of this tool are much wider: with its help, you can track context switches, measure the processing time of interrupts, calculate the time to activate tasks with high priority, and much more.
Ftrace was developed by Stephen Rostedt and added to the kernel in 2008, starting with version 2.6.27. This is a framework that provides a debug ring buffer for writing data. This data is collected by the tracer programs built into the kernel.
Ftrace runs on the basis of the debugfs file system, which is mounted by default in most modern Linux distributions. To get started with ftrace, you just need to go to the sys / kernel / debug / tracing directory (it is available only to the root user):
# cd /sys/kernel/debug/tracing
We will not talk in detail about all the files and subdirectories contained in it - this is already done in the official documentation . We briefly describe only those that are of interest in the context of our consideration:
- available_tracers - available tracer programs;
current_tracer - the tracer program that is currently active; - tracing_on - a service file responsible for enabling and disabling writing data to the ring buffer (to enable recording, you need to write the number 1 in this file, and to disable it, 0);
- trace - a file where trace data is stored in a human-readable format.
Available Tracers
You can view the list of available tracers using the command
root@andrei:/sys/kernel/debug/tracing#: cat available_tracers
blk mmiotrace function_graph wakeup_rt wakeup function nop
Here is a brief description for each tracer:
- function - tracer of kernel call functions without the possibility of receiving arguments;
- function_graph - tracer of kernel call functions with sub-calls;
- blk - a tracer for calls and events related to input-output to block devices; it is he who is used in the blktrace utility about which we already wrote ;
- mmiotrace is a tracer for memory I / O.
- nop is the simplest tracer, which, as the name implies, does nothing (however, in some situations, it can be useful, which will be discussed below).
Tracer function
We will begin our acquaintance with ftrace with the function tracer. We will consider it on the material of such a test script:
#!/bin/sh
dir=/sys/kernel/debug/tracing
sysctl kernel.ftrace_enabled=1
echo function > ${dir}/current_tracer
echo 1 > ${dir}/tracing_on
sleep 1
echo 0 > ${dir}/tracing_on
less ${dir}/trace
The crypt is very simple and generally understandable, but there are moments in it that are worth paying attention to.
The sysctl ftrace.enabled = 1 command enables function tracing. Next, we install the current tracer by writing its name to the current_tracer file.
After that, we write 1 to the tracing_on file and thereby activate the update of the ring buffer. An important feature of the syntax: there must be a space between 1 and the sign>: a command of the form echo1> tracing_on will not work. Literally after one line, we disable it (note: if you write 0 in the tracing_on file, the ring buffer will not be cleared; ftrace will not be disabled).
Why are we doing this? Between the two echo commands is the sleep 1 command. We enable the buffer update, execute this command, and then immediately disable it. Due to this, the trace will include information about all system calls that occurred during the execution of this command.
In the last line of the script, we give the command to display the trace data to the console.
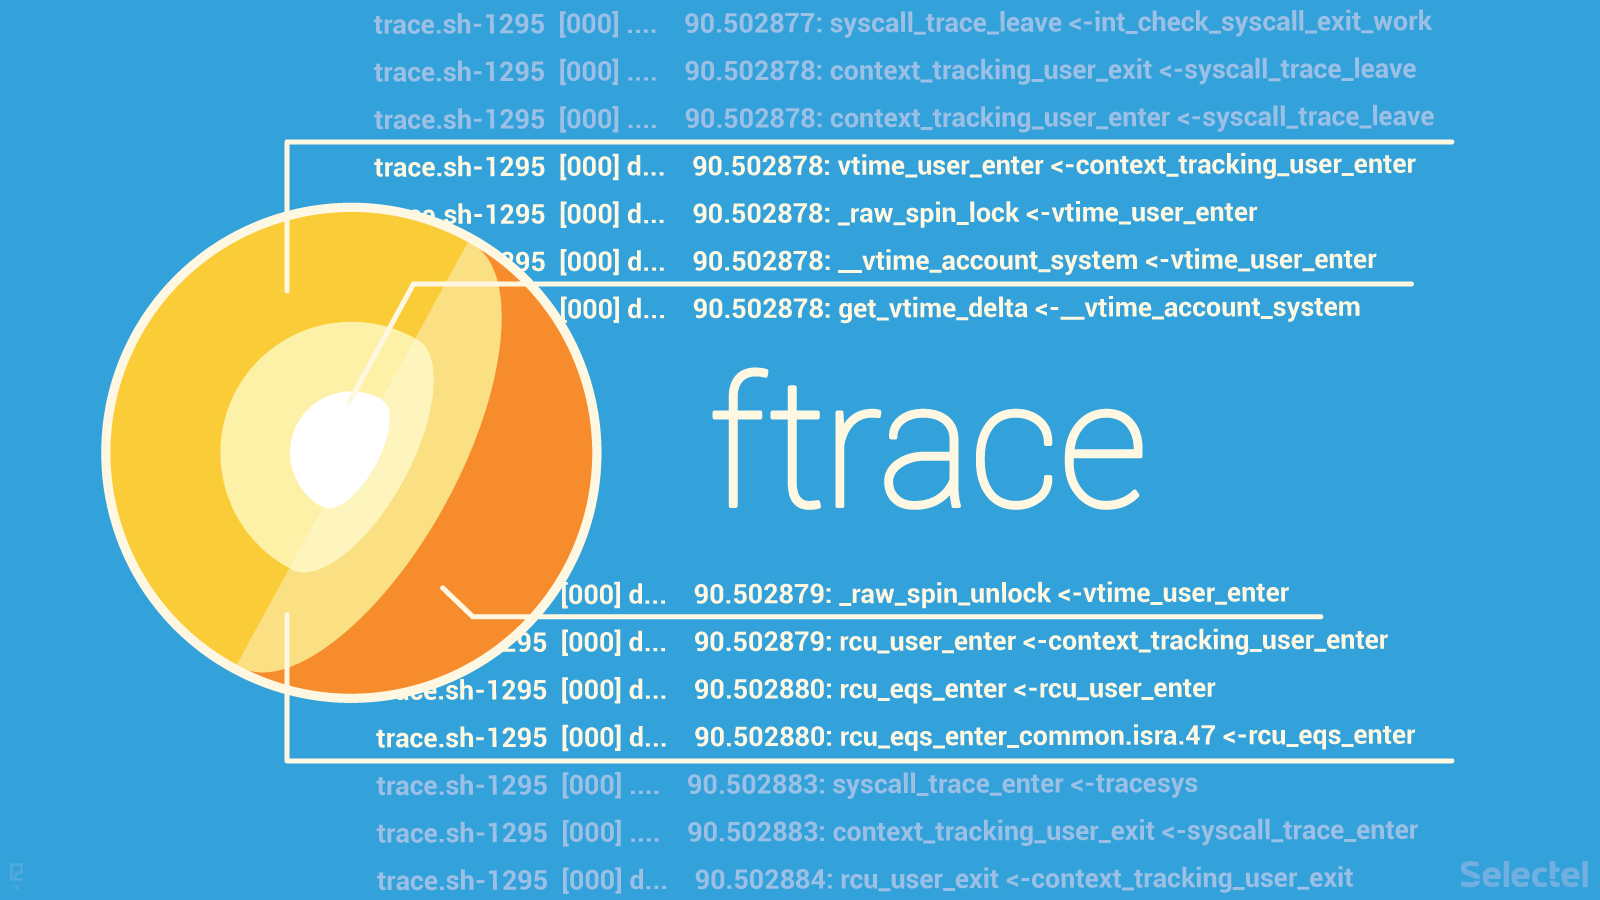
As a result of executing this script, we will see the following output (we give only a small fragment):
# tracer: function
#
# entries-in-buffer/entries-written: 29571/29571   #P:2
#
#                              _-----=> irqs-off
#                             / _----=> need-resched
#                            | / _---=> hardirq/softirq
#                            || / _--=> preempt-depth
#                            ||| /     delay
#           TASK-PID   CPU#  ||||    TIMESTAMP  FUNCTION
#              | |       |   ||||       |         |
        trace.sh-1295  [000] ....    90.502874: mutex_unlock <-rb_simple_write
        trace.sh-1295  [000] ....    90.502875: __fsnotify_parent <-vfs_write
        trace.sh-1295  [000] ....    90.502876: fsnotify <-vfs_write
        trace.sh-1295  [000] ....    90.502876: __srcu_read_lock <-fsnotify
        trace.sh-1295  [000] ....    90.502876: __srcu_read_unlock <-fsnotify
        trace.sh-1295  [000] ....    90.502877: __sb_end_write <-vfs_write
        trace.sh-1295  [000] ....    90.502877: syscall_trace_leave <-int_check_syscall_exit_work
        trace.sh-1295  [000] ....    90.502878: context_tracking_user_exit <-syscall_trace_leave
        trace.sh-1295  [000] ....    90.502878: context_tracking_user_enter <-syscall_trace_leave
        trace.sh-1295  [000] d...    90.502878: vtime_user_enter <-context_tracking_user_enter
        trace.sh-1295  [000] d...    90.502878: _raw_spin_lock <-vtime_user_enter
        trace.sh-1295  [000] d...    90.502878: __vtime_account_system <-vtime_user_enter
        trace.sh-1295  [000] d...    90.502878: get_vtime_delta <-__vtime_account_system
        trace.sh-1295  [000] d...    90.502879: account_system_time <-__vtime_account_system
        trace.sh-1295  [000] d...    90.502879: cpuacct_account_field <-account_system_time
        trace.sh-1295  [000] d...    90.502879: acct_account_cputime <-account_system_time
        trace.sh-1295  [000] d...    90.502879: __acct_update_integrals <-acct_account_cputime
The output starts with information about the number of event records in the buffer (entries in buffer) and the total number of recorded events (entries written). The difference between these two digits is the number of events lost during the filling of the buffer (in our case, there are no lost events).
Next is a list of functions, including the following information:
- process identifier (PID);
- the number of the processor core on which the trace is performed (CPU #);
- time stamp (TIMESTAMP; indicates the time when the function was entered);
- the name of the traced function and the name of the parent function that called it (FUNCTION); for example, in the very first line of our output, the mutex-unlock function is called by the rb_simple_write function.
Function_graph tracer
The function_graph tracer works in exactly the same way as function, but tracks functions in more detail: for each function, it indicates an entry point and an exit point. With this tracer, you can track functions with sub-calls and measure the execution time for each function.
Edit the script used in the previous example:
#!/bin/sh
dir=/sys/kernel/debug/tracing
sysctl kernel.ftrace_enabled=1
echo function_graph > ${dir}/current_tracer
echo 1 > ${dir}/tracing_on
sleep 1
echo 0 > ${dir}/tracing_on
less ${dir}/trace
As a result of executing this script, we get the following output:
# tracer: function_graph
#
# CPU  DURATION                  FUNCTION CALLS
# |     |   |                     |   |   |   |
 0)   0.120 us    |                                  } /* resched_task */
 0)   1.877 us    |                                } /* check_preempt_curr */
 0)   4.264 us    |                              } /* ttwu_do_wakeup */
 0) + 29.053 us   |                            } /* ttwu_do_activate.constprop.74 */
 0)   0.091 us    |                            _raw_spin_unlock();
 0)   0.260 us    |                            ttwu_stat();
 0)   0.133 us    |                            _raw_spin_unlock_irqrestore();
 0) + 37.785 us   |                          } /* try_to_wake_up */
 0) + 38.478 us   |                        } /* default_wake_function */
 0) + 39.203 us   |                      } /* pollwake */
 0) + 40.793 us   |                    } /* __wake_up_common */
 0)   0.104 us    |                    _raw_spin_unlock_irqrestore();
 0) + 42.920 us   |                  } /* __wake_up_sync_key */
 0) + 44.160 us   |                } /* sock_def_readable */
 0) ! 192.850 us  |              } /* tcp_rcv_established */
 0) ! 197.445 us  |            } /* tcp_v4_do_rcv */
 0)   0.113 us    |            _raw_spin_unlock();
 0) ! 205.655 us  |          } /* tcp_v4_rcv */
 0) ! 208.154 us  |        } /* ip_local_deliver_finish */
The column DURATION indicates the time taken to complete the function. Particular attention should be paid to items marked with + and! The + sign means that the function took more than 10 microseconds, and the exclamation mark took more than 100.
In the FUNCTION_CALLS column with information about function calls.
The beginning and end of each function are indicated in it as is customary in C: a curly bracket at the beginning of the function and another at the end. Functions that are leaves of the graph and do not call any other functions are indicated by a semicolon (;).
Filters for functions
The output of ftrace can sometimes be very large, and it is extremely difficult to find the necessary information in it. You can simplify the search with the help of filters: the output will not include information about all the functions, but only about those that really interest us. To do this, just write the names of the necessary functions to the set_ftrace_filter file, for example:
root@andrei:/sys/kernel/debug/tracing# echo kfree > set_ftrace_filter
To disable the filter, you need to write an empty line to the same file:
root@andrei:/sys/kernel/debug/tracing# echo > set_ftrace_filter
As a result of the command
root@andrei:/sys/kernel/debug/tracing# echo kfree > set_ftrace_notrace
we get the exact opposite result: information about all functions except kfree () will get into the output.
Another useful option is set_ftrace_pid. It is designed to trace functions that are called during the execution of the specified process.
The filtering options in ftrace are much wider; You can read more about them in an article by Stephen Rostedt on LWN.net .
Event trace
We have already mentioned the tracepoints mechanism. The word tracepoint in translation means "trace point". A trace point is a special insertion into the code that records certain system events. The trace point can be active (this means that some verification is assigned to it) or inactive (no verification is assigned to it).
An inactive trace point has no effect on the system; it only adds a few bytes to call the trace function at the end of the instrumented function, and also adds the data structure to a separate section.
When the trace point is active, when the corresponding code fragment is executed, the trace function is called. Trace data is written to the debug ring buffer.
Trace points can be inserted anywhere in the code. They are already present in the code of many nuclear functions. Consider, for example, the kmem_cache_alloc function (taken from here ):
{
    void *ret = slab_alloc(cachep, flags, _RET_IP_);
    trace_kmem_cache_alloc(_RET_IP_, ret,
                            cachep->object_size, cachep->size, flags);
         return ret;
         }
Pay attention to the trace_kmem_cache_alloc line - this is exactly the trace point. The number of such examples can be multiplied by referring to the source code of other kernel functions.
The Linux kernel has a special API that can be used to work with trace points from user space. The / sys / kernel / debug / tracing directory contains the events subdirectory, which stores the system events available for monitoring. A system event in this context is nothing more than trace points included in the kernel.
You can view their list using the command:
root@andrei:/sys/kernel/debug/tracing# cat available_events
A long list will be displayed on the console, which is rather inconvenient to browse. You can display the same list in a more structured format like this:
root@andrei:/sys/kernel/debug/tracing# ls events
Before proceeding with event tracking, we check to see if event recording is enabled in the ring buffer:
root@andrei:/sys/kernel/debug/tracing# cat tracing_on
If after executing this command the digit 0 is displayed on the console, execute:
root@andrei:/sys/kernel/debug/tracing# echo 1 > tracing_on
In the last article, we wrote about the chroot () system call - we will monitor the entrance to this system call. We will choose nop as the tracer: function and function_graph write too much information, including that which is not related to the event of interest to us.
root@andrei:/sys/kernel/debug/tracing# echo nop > current_tracer
All events related to system calls are stored in the syscalls directory. It, in turn, stores directories for entering and exiting various system calls. We activate the trace point we need by writing 1 to its enable file:
root@andrei:/sys/kernel/debug/tracing# echo 1 > events/syscalls/sys_enter_chroot/enable
Then create an isolated file system using the chroot command (see the previous post for details ). After executing the commands of interest to us, turn off the trace so that information about unnecessary and irrelevant events does not get into the output:
root@andrei:/sys/kernel/debug/tracing# echo 0 > tracing_on
Next, view the contents of the ring buffer. At the very end of the output will contain information about the system call of interest to us (we give a small fragment):
root@andrei:/sys/kernel/debug/tracing# сat trace
......
          chroot-11321 [000] ....  4606.265208: sys_chroot(filename: 7fff785ae8c2)
          chroot-11325 [000] ....  4691.677767: sys_chroot(filename: 7fff242308cc)
            bash-11338 [000] ....  4746.971300: sys_chroot(filename: 7fff1efca8cc)
            bash-11351 [000] ....  5379.020609: sys_chroot(filename: 7fffbf9918cc)
You can read more about event tracking settings here .
Conclusion
In this article, we have provided a general overview of ftrace features. Any comments and additions will be greatly appreciated. If you want to delve deeper into the topic, we recommend that you familiarize yourself with the following sources:
- https://www.kernel.org/doc/Documentation/trace/tracepoints.txt - a detailed description of the mechanism of tracepoints;
- https://www.kernel.org/doc/Documentation/trace/events.txt - a guide to tracing system events in Linux;
- https://www.kernel.org/doc/Documentation/trace/ftrace.txt - official ftrace documentation;
- https://lttng.org/files/thesis/desnoyers-dissertation-2009-12-v27.pdf - dissertation by Mathieu Denoir (creator of the mechanism of tracepoints and author of LTTNG) on tracing and profiling of the kernel;
- https://lwn.net/Articles/370423/ - Stephen Rodstedt's article on ftrace features;
- http://alex.dzyoba.com/linux/profiling-ftrace.html - a review article on ftrace with a practical case study;
- http://panda-nox.livejournal.com/2235.html - the only detailed publication about ftrace in Russian.
If for one reason or another you can’t leave comments here, we invite you to our blog .