Market research of web-studios and digital-agencies
Hi, Habr! A long time ago I didn’t write anything, about two years, but now we have a decent excuse. We conducted a large study of various indicators of the agency digital-market in Russia, surveyed and analyzed data from more than 1000 companies, and here’s what came out of the most interesting:
1. Distribution of studios / agencies by turnover The
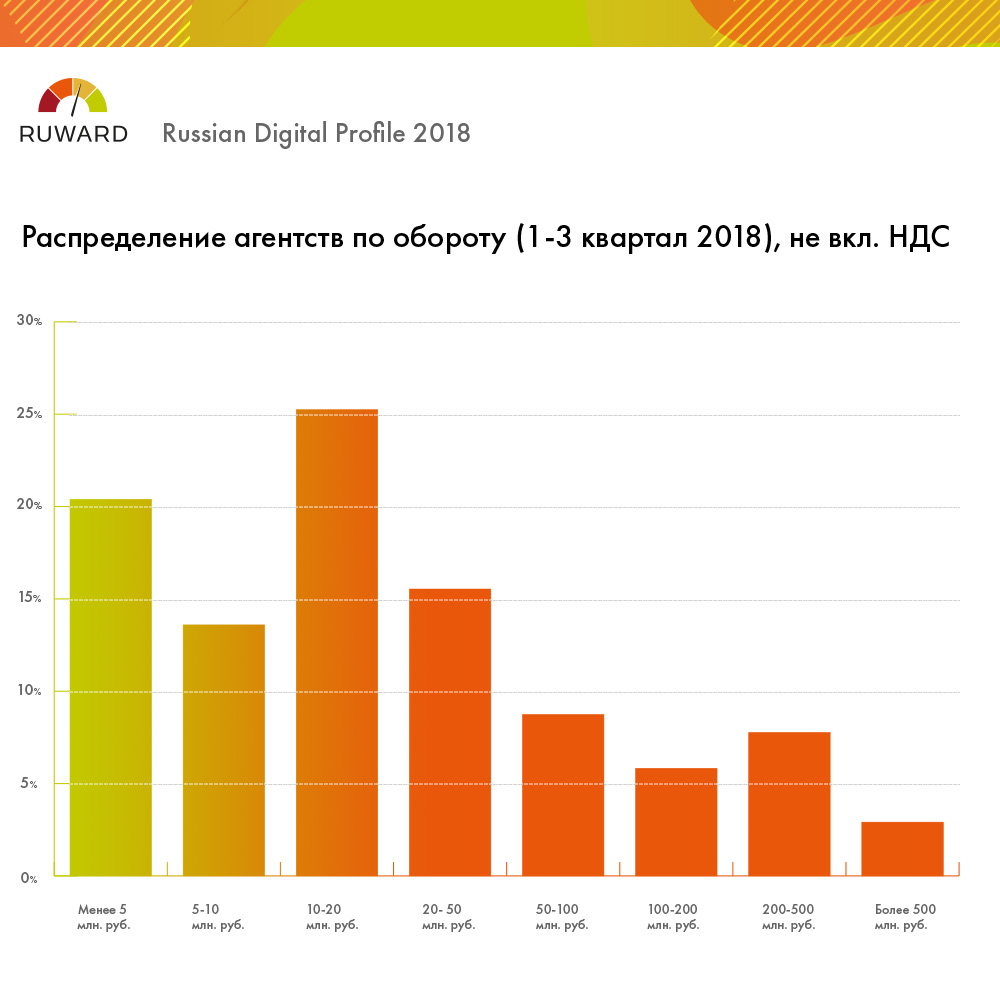
digital-market in Russia still has a fine dispersion, nor One agency out of about 10,000 active players (if you do not take into account the through budgets for media purchases) does not even have 1% of the market in terms of turnover. The vast majority of segment companies can be attributed to the micro-business.
2. Distribution by overhead ratio
The exact wording of the question in the questionnaire: “What is the overhead ratio in your agency? We will explain. If you pay 1 ruble per employee for an hour of work (on hands without arbitrary taxes), what is the average selling price of this hour of work when selling to an end customer (not including VAT, if any)? ”
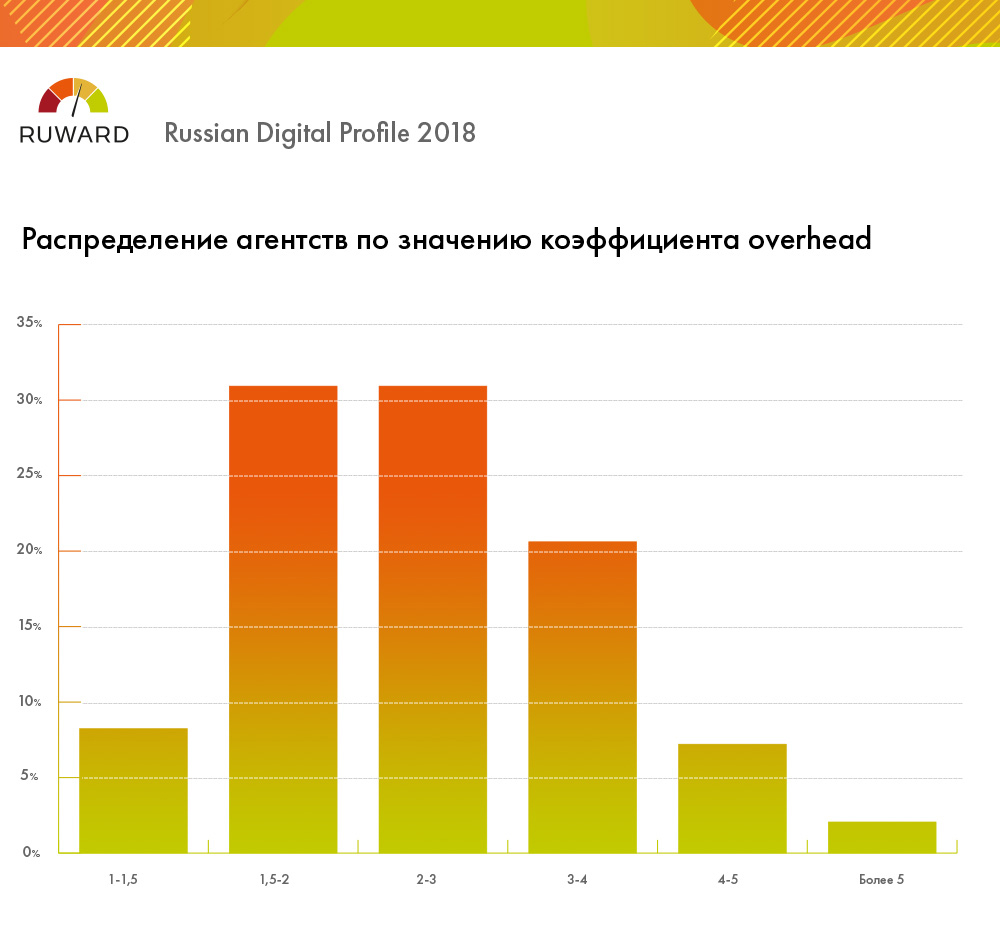
This is the most disturbing graph of all the data obtained in the study. More than two thirds of the agencies operate in a market with an overhead ratio of less than three. This means that the total share of payroll (net, at the hands) producing employees in most cases exceeds one third of the total expenses of the company. Considering that, for a typical agency, the cost structure includes the costs of the payroll fund of non-producing employees, conditionally fixed expenses, taxes, own marketing, the average profit rate of the average player in the agency digital market remains very small and fluctuates at the level of 5-20%, and a significant part of companies still working in the gray area in terms of paying taxes.
3. And what about state support?
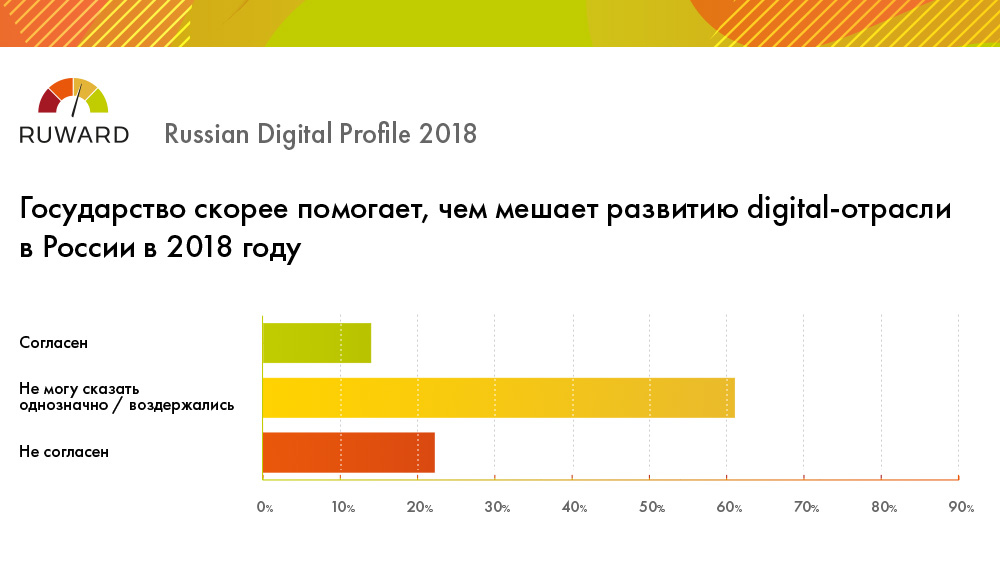
For obvious reasons, this is the most ridiculous schedule of the entire study, in contrast to all other similar questions, the percentage of “abstentions” goes off scale dramatically.
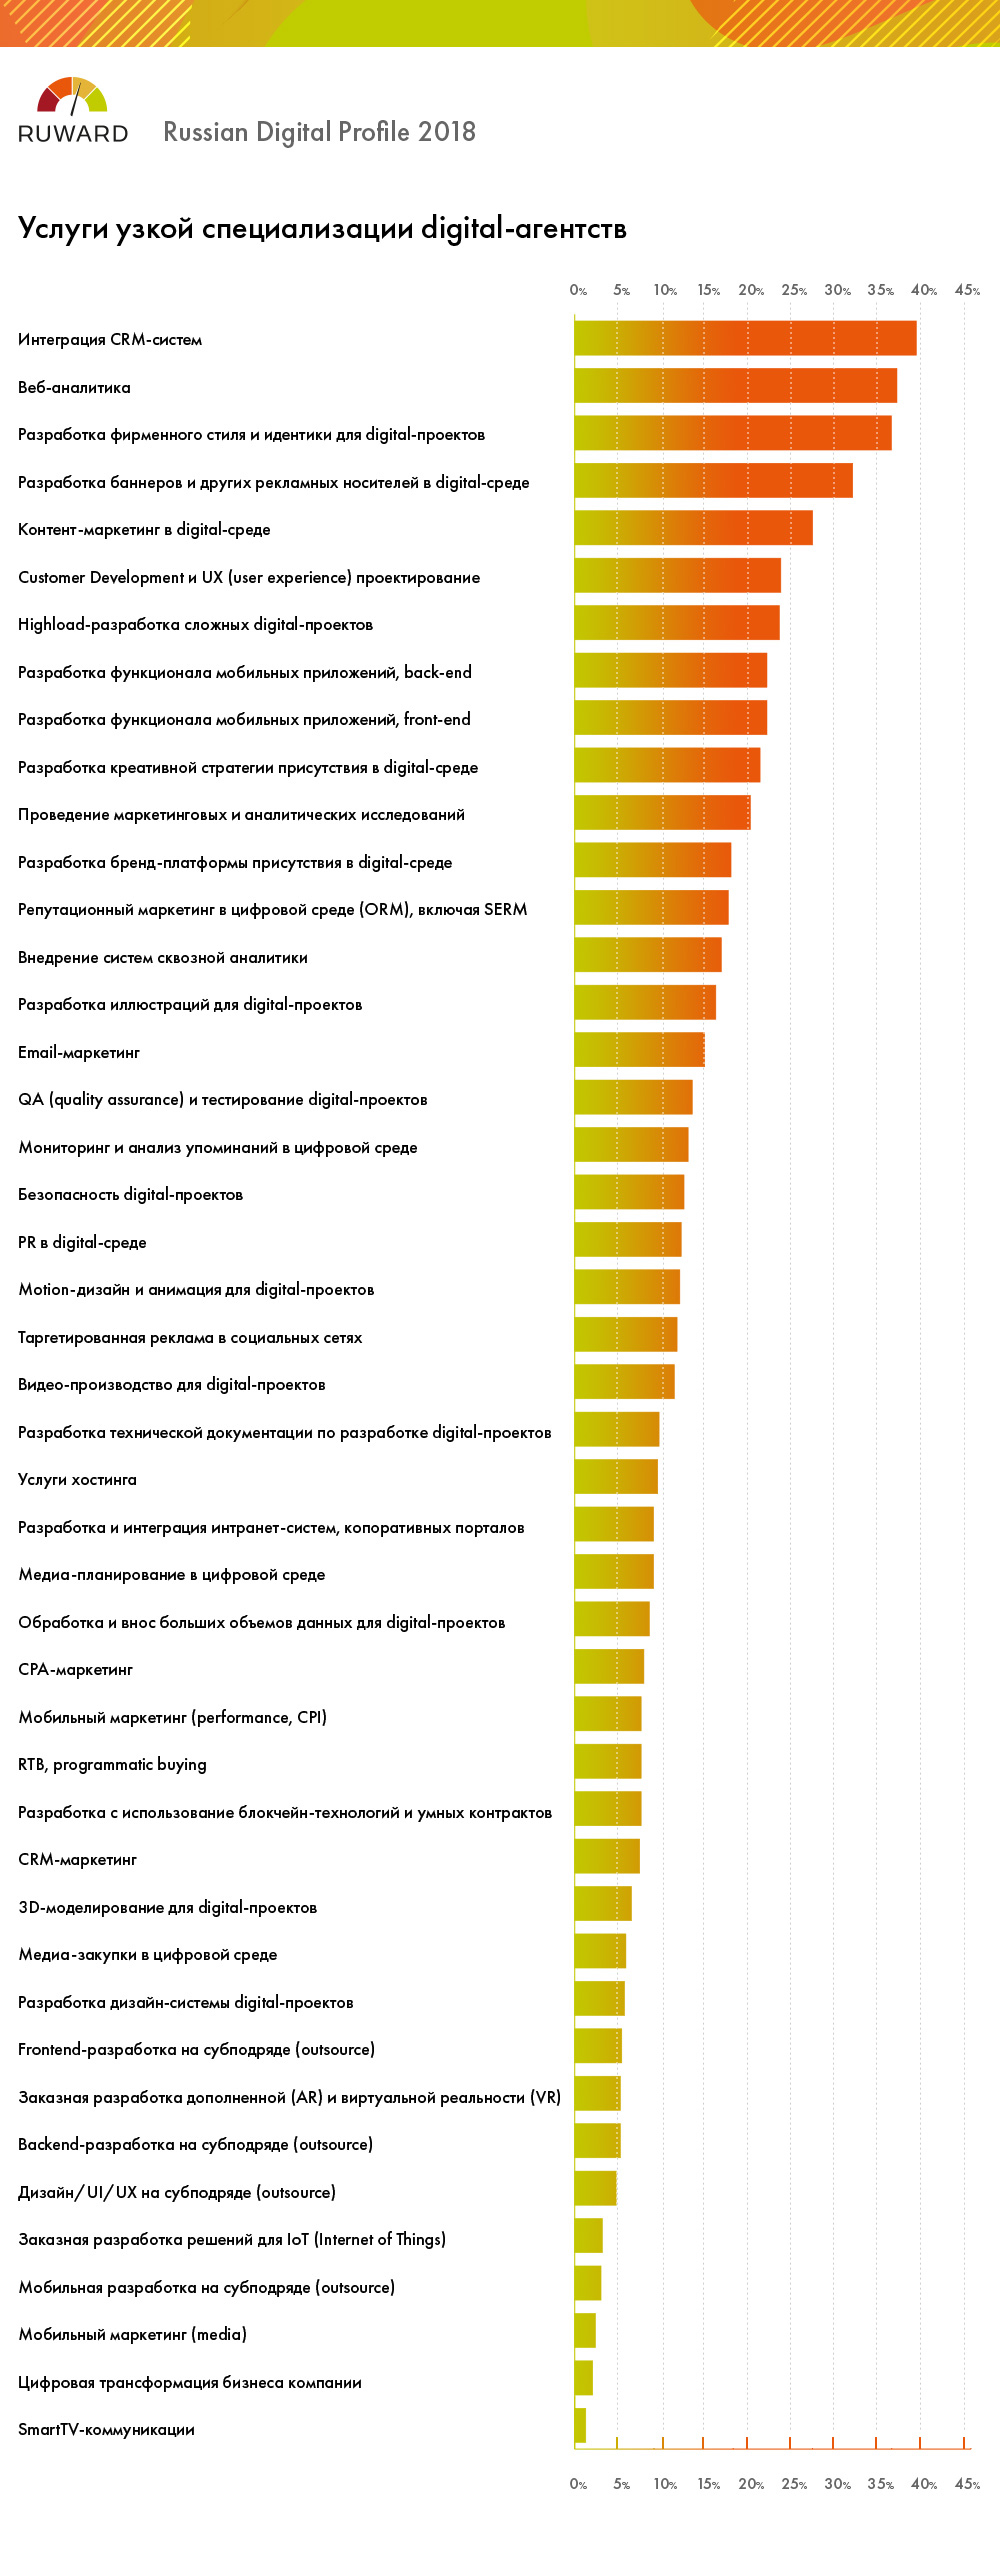
4. The most popular services from agencies / studios.
Major

Narrower (in our terminology)
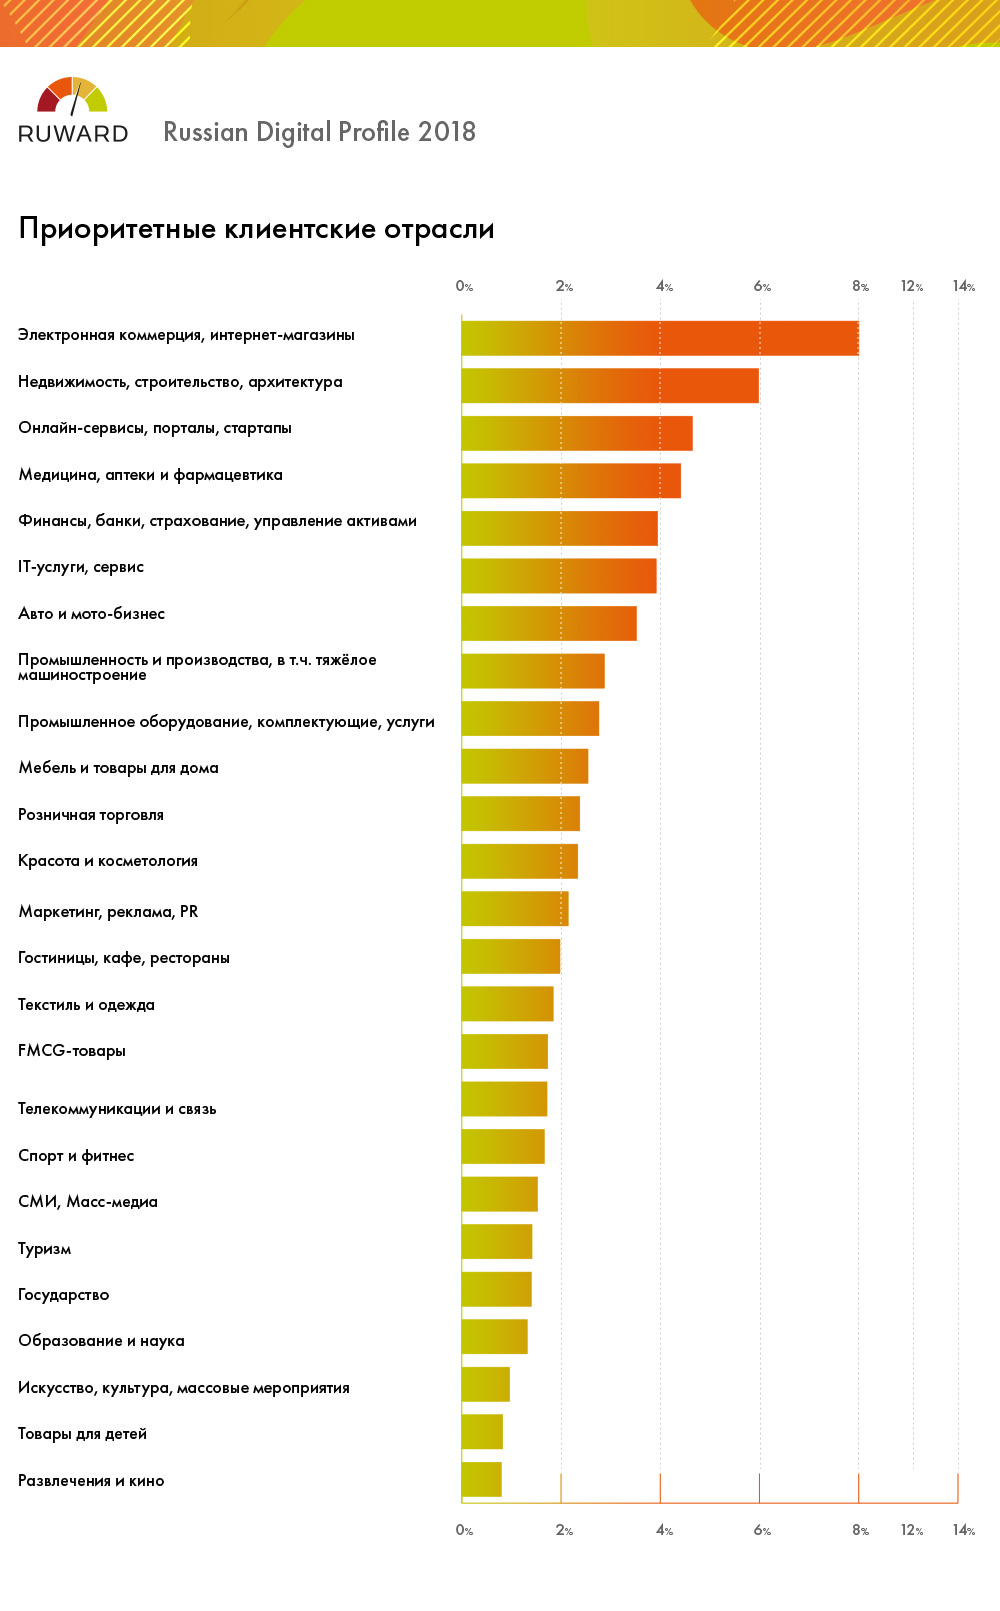
5. The most popular client industries (from the point of view of agencies)
6. The change in the dynamics of growth in demand.
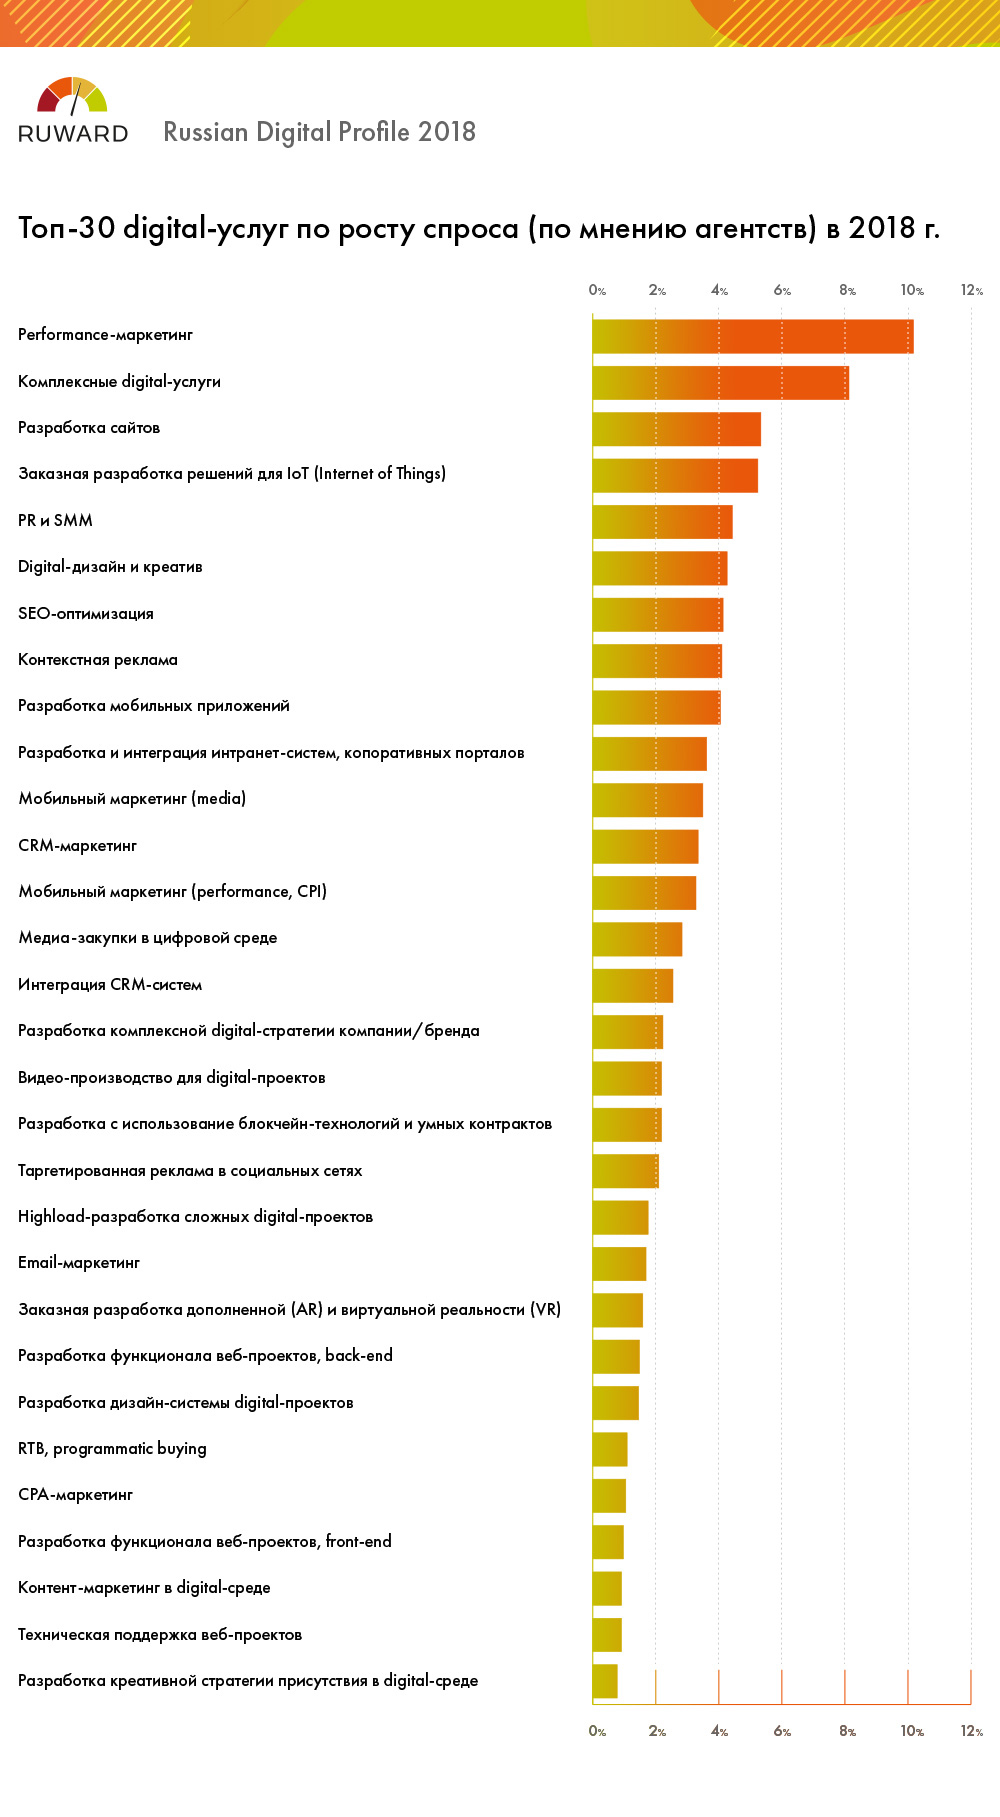
The data is rather contradictory (and the graphs were normalized by the distribution of the popularity of services from the corresponding slides).
Growth in demand:
Drop in demand:

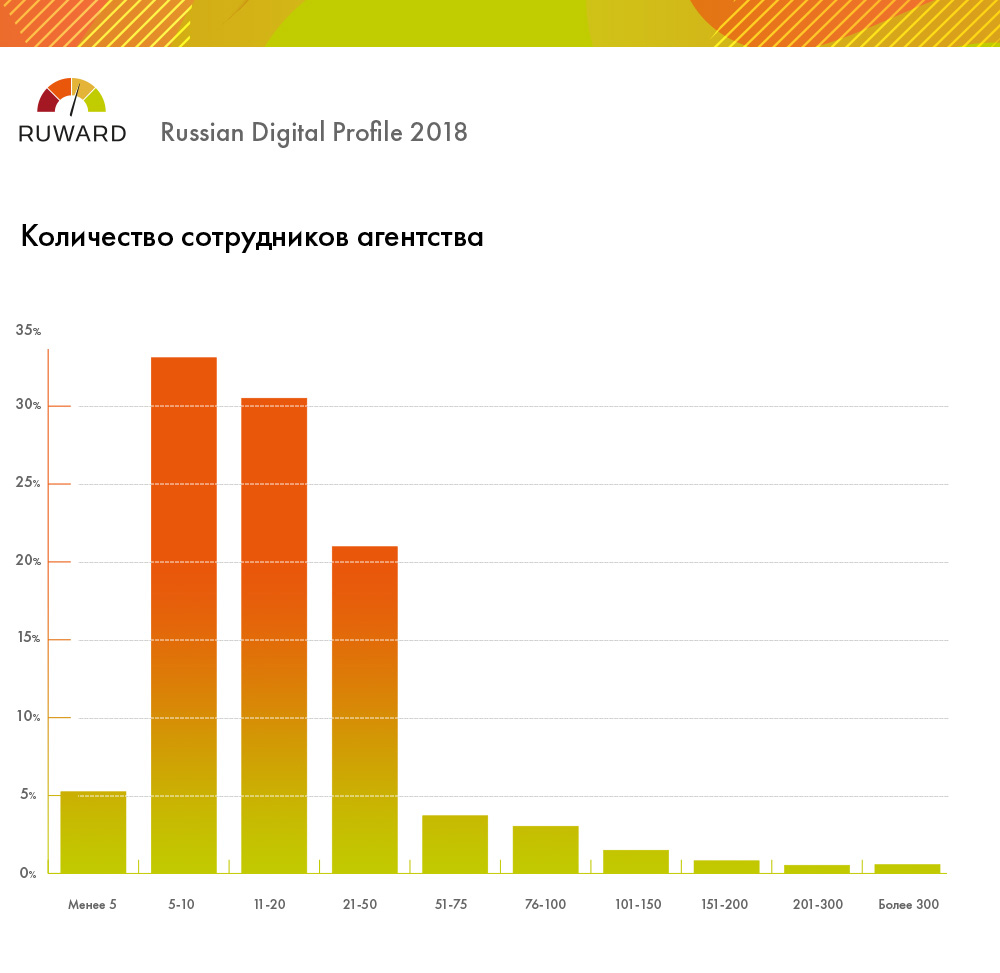
7. Number of employees
There are no surprises here:
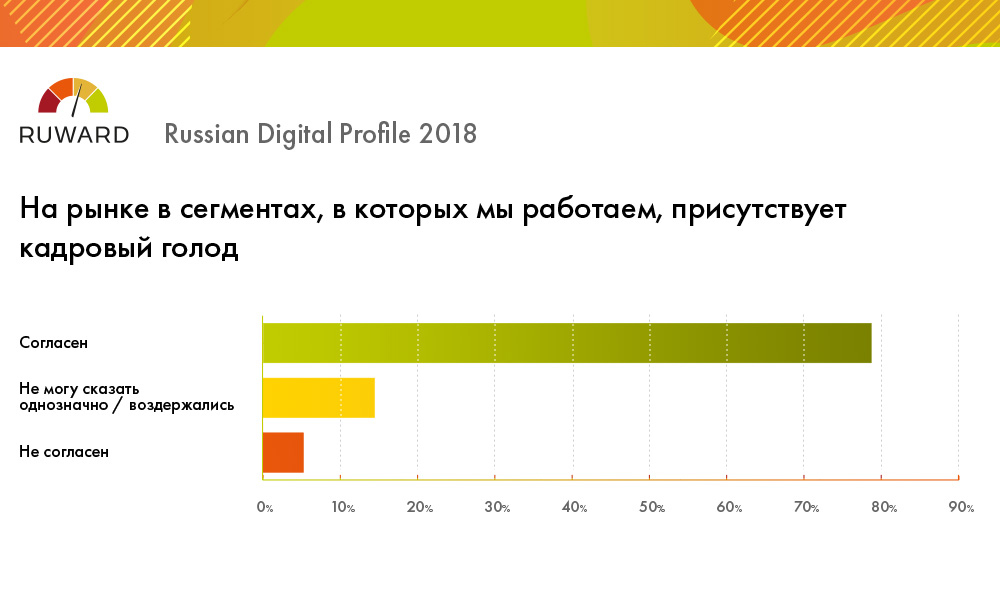
8. And, finally, the question in the style of the captain is obvious:
* The full results of the study with some comments and lineworks have already been published on the website of Ruvard (17 graphs in total). I hope our data will be useful =)
1. Distribution of studios / agencies by turnover The

digital-market in Russia still has a fine dispersion, nor One agency out of about 10,000 active players (if you do not take into account the through budgets for media purchases) does not even have 1% of the market in terms of turnover. The vast majority of segment companies can be attributed to the micro-business.
2. Distribution by overhead ratio
The exact wording of the question in the questionnaire: “What is the overhead ratio in your agency? We will explain. If you pay 1 ruble per employee for an hour of work (on hands without arbitrary taxes), what is the average selling price of this hour of work when selling to an end customer (not including VAT, if any)? ”

This is the most disturbing graph of all the data obtained in the study. More than two thirds of the agencies operate in a market with an overhead ratio of less than three. This means that the total share of payroll (net, at the hands) producing employees in most cases exceeds one third of the total expenses of the company. Considering that, for a typical agency, the cost structure includes the costs of the payroll fund of non-producing employees, conditionally fixed expenses, taxes, own marketing, the average profit rate of the average player in the agency digital market remains very small and fluctuates at the level of 5-20%, and a significant part of companies still working in the gray area in terms of paying taxes.
3. And what about state support?

For obvious reasons, this is the most ridiculous schedule of the entire study, in contrast to all other similar questions, the percentage of “abstentions” goes off scale dramatically.
4. The most popular services from agencies / studios.
Major

Narrower (in our terminology)

5. The most popular client industries (from the point of view of agencies)

6. The change in the dynamics of growth in demand.
The data is rather contradictory (and the graphs were normalized by the distribution of the popularity of services from the corresponding slides).
Growth in demand:

Drop in demand:

7. Number of employees
There are no surprises here:

8. And, finally, the question in the style of the captain is obvious:

* The full results of the study with some comments and lineworks have already been published on the website of Ruvard (17 graphs in total). I hope our data will be useful =)
