January 25, 2016 at 12:02
Service Monitoring with Prometheus
- Tutorial

In previous publications, we have already addressed the issues of monitoring and collecting metrics. In today's article, we would like to return to this topic and talk about an interesting tool called Prometheus . It was created in 2012 as an internal monitoring system for the notorious SoundCloud project , but subsequently became more widespread.
Prometheus is a completely new tool (the first public release took place at the beginning of 2015), and there are almost no publications about it in Russian (a few months ago an article was published in the Hacker magazine , but it is available only to subscribers).
SoundCloud developers celebrate (see detailed report here) that they needed a new monitoring tool in connection with the transition to a microservice architecture. The growing interest in microservices is one of the characteristic trends of the last few years.
From the point of view of the microservice approach, the application is understood not as a monolith, but as a set of services. Each of these services works in its own process and interacts with the environment using a simple mechanism (usually through the HTTP protocol).
Monitoring microservices is not an easy task: in real time, you need to monitor both the status of individual components and the state of the system as a whole. The task is complicated if, in addition to the technical ones, you also need to check business-relevant indicators. As the Prometheus developers themselves have noted in numerous articles and reports, using existing monitoring systems to solve it is problematic. Therefore, they created their own tool.
Prometheus is a complete solution that includes both a monitoring framework and its own temporal database. In some reviews, it is even called a “ new generation monitoring system ”.
We were interested in the publications about Prometheus, and we decided to get to know this tool better.
Prometheus Architecture
The following components are part of Prometheus:
- a server that reads metrics and stores them in a time series database;
- client libraries for various programming languages (Go, Java, Python, Ruby; the community also created libraries for Bash, Node.js, Haskell, .NET / C #);
- Pushgateway - component for receiving metrics of short-term processes;
- PROMDASH - dashboard for metrics;
- tools for exporting data from third-party applications (Statsd, Ganglia, HAProxy and others);
- AlertManager notification manager (currently in beta testing);
- command line client for querying data .
Most of them are written in Go, and a very small part is written in Ruby and Java.
All Prometheus components communicate with each other via HTTP:
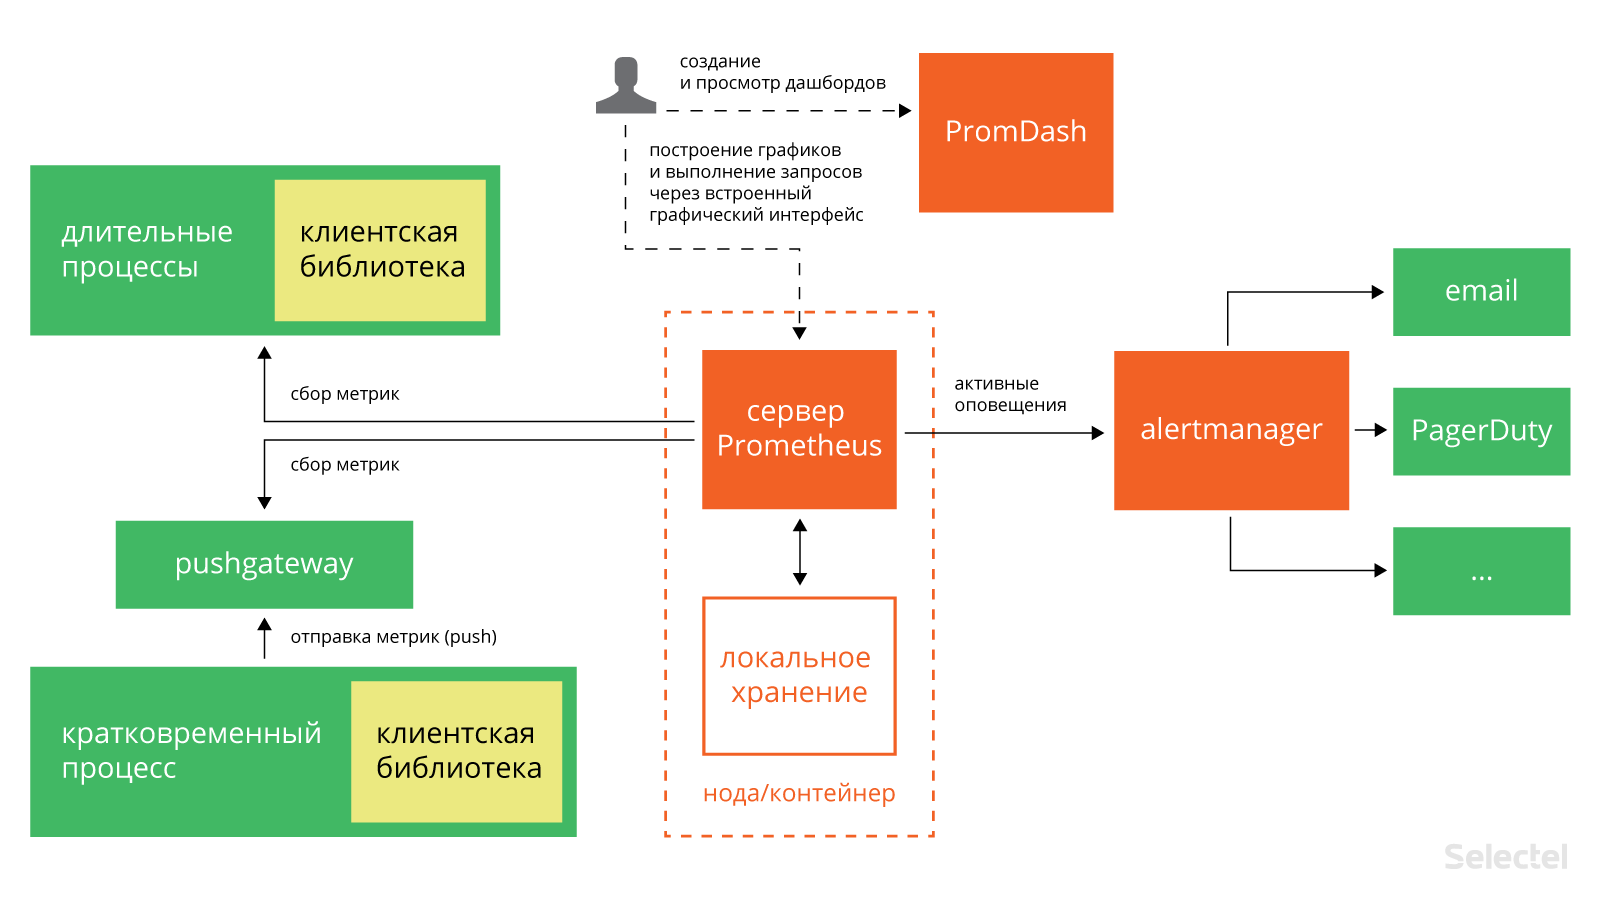
The main component of the entire system is the Prometheus server. It works autonomously and saves all data in a local database. Service discovery occurs automatically. This simplifies the deployment procedure: to monitor a single service, you do not need to deploy a distributed monitoring system; just install the server and the necessary components for collecting and exporting metrics. There are already quite a lot of such components “tailored” for specific services: for Haproxy, MySQL, PostrgreSQL and others (see the full list here , as well as on GitHub ).
Prometheus metrics are collected using the pull mechanism. It is also possible to collect metrics using the push mechanism (for this, a special pushgateway component is used , which is installed separately). This may be necessary in situations where collecting metrics using pull is impossible for one reason or another: for example, when monitoring services protected by a firewall. Also, the push mechanism can be useful when monitoring services that connect to the network periodically and for a short time.
Prometheus is well suited for collecting and analyzing data presented as time series. It stores all metrics in its own temporal database (its comparison with OpenTSDB and InfluxDB see here); IndexD uses LevelDB.
Data model
Prometheus stores data in the form of time series - sets of values associated with a timestamp.
The element of the time series (dimension) consists of the name of the metric, the timestamp, and the key – value pair. Timestamps are accurate to milliseconds, values are presented with 64-bit precision.
The metric name indicates the system parameter about which data is being collected. For example, in a metric with information about the number of HTTP requests to a certain API, the name may look like this: api_http_requests_total. The time series in this metric can store information about all GET requests to the address / api / tracks, to which a response with the code 200 was returned. This time series can be represented in the form of the following notation:
api_http_requests_total{method="GET", endpoint="/api/tracks", status="200"}
The data model used by Prometheus resembles that used by OpenTSDB. All metrics have a name, but it can be the same for several rows.
In addition, each time series must be marked with at least one tag. Measurements for one tag are stored sequentially, which ensures fast data aggregation.
The following types of metrics are supported:
- counter (counter) - stores values that increase over time (for example, the number of requests to the server);
- scale (gauge) - stores values that over time can both increase and decrease (for example, the amount of RAM used or the number of I / O operations);
- histogram (histogram) - stores information about the change of a parameter over a certain period (for example, the total number of requests to the server from 11 to 12 hours and the number of requests to the same servers from 11.30 to 11.40);
- summary of results (summary) - like a histogram, it stores information about a change in the value of a parameter over a time interval, but also allows you to calculate quantiles for moving time intervals.
Installation
Now let's look at the practical aspects of using Prometheus. Let's start with a description of the installation procedure.
More recently, Prometheus has been included in the official Debian 8 and Ubuntu 15.10 repositories.
In Ubuntu 14.04, it can also be installed using the standard package manager. Naturally, for this you need to connect the appropriate repository:
$ echo 'deb http://deb.robustperception.io/ precise nightly' > /etc/apt/sources.list
$ wget https://s3-eu-west-1.amazonaws.com/deb.robustperception.io/41EFC99D.gpg
$ sudo apt-key add 41EFC99D.gpg
$ sudo apt-get update
$ sudo apt-get install prometheus node-exporter alertmanager
Using the above commands, we installed the Prometheus server, as well as additional components - node_exporter and alertmanager. Node_exporter collects server status data, and alertmanager (we will talk about it in more detail below) sends out notifications in case of fulfilling or not fulfilling specified conditions.
Installation is complete, but there’s one more small touch: you need to make node_exporter constantly collect metrics in the background. To do this, first create a symbolic link in / usr / bin:
$ sudo ln -s ~/Prometheus/node_exporter/node_exporter /usr/bin
Then create the file /etc/init/node_exporter.conf and add the following lines to it:
# Run node_exporter
start on startup
script
   /usr/bin/node_exporter
end script
Save the changes and execute the command:
$ sudo service node_exporter start
In distributions that switched to systemd (for example, in Ubuntu 15.10), to run node_exporter in the background, you need to create the /etc/systemd/system/node_exporter.service file and add the following lines to it:
[Unit]
Description=Node Exporter
[Service]
ExecStart=/usr/sbin/node_exporter
Restart=Always
[Install]
WantedBy=default.target
Having saved the changes, you need to run the commands:
$ sudo systemctl enable node_exporter.service
$ sudo systemctl start node_exporter
Configuration
The default Prometheus settings are enough to keep track of everything that happens on the local machine. If necessary, additional settings can always be specified in the configuration file /etc/prometheus/prometheus.yml. Consider its structure in more detail. It starts with the globals section:
global:
  scrape_interval: 15s
  evaluation_interval: 15s
  rule_files:
It includes the following options:
- scrape_interval - metric collection interval (default is 15 seconds);
- evaluation_interval - the interval of reconciliation with the rules (by default - 15 seconds);
- rule_files - rule files (we will talk about them below).
The following is the scrape_configs section with basic settings for collecting metrics on the server:
scrape_configs:
  - job_name: "prometheus"
  - scrape_interval: "15s"
target_groups:
    - targets:
       - "localhost:9090"
It includes the following required parameters:
- job_name - task name;
- scrape_interval - metric collection interval (in the given example, every 15 seconds);
- target_groups - services and groups of services for which you need to collect metrics.
In the same section, you can specify additional settings:
- scrape_timeout - data timeout;
- metrics_path - HTTP resource to which metrics will be transmitted;
- scheme - the protocol that will be used to transmit the metrics;
- basic_auth - details for authorization on the server from which metrics will be collected (username :, password :).
We have already mentioned that in the configuration file you can refer to the rule files. Rules help pre-calculate the most frequently used or resource-intensive parameters and save them as new time series. Searching by pre-calculated parameters is much simpler than re-calculating their values with each request. This can be useful, for example, when working with dashboards that request parameter values with each update.
In general terms, the syntax of the rules can be represented as follows:
<имя временного ряда>{метки} = <параметр для записи>
Here are more specific and understandable examples:
job:http_inprogress_requests:sum = sum(http_inprogress_requests) by (job)
new_time_series{label_to_change="new_value",label_to_drop=""} = old_time_series
Prometheus checks the rules with a certain frequency specified in the configuration file in the evaluation_interval parameter). After each reconciliation, Prometheus recounts the parameter value and saves it under a new name with the current timestamp.
So, we have examined the structure and syntax of the configuration file in general terms. In order for the prescribed settings to take effect, you need to run the following command (instead of path / to / prometheus.yml, specify the path to the configuration file):
$ prometheus -config.file “path/to/prometheus.yml”
Web interface
The Prometheus web interface will be available in a browser at: http: // [Server IP]: 9090:
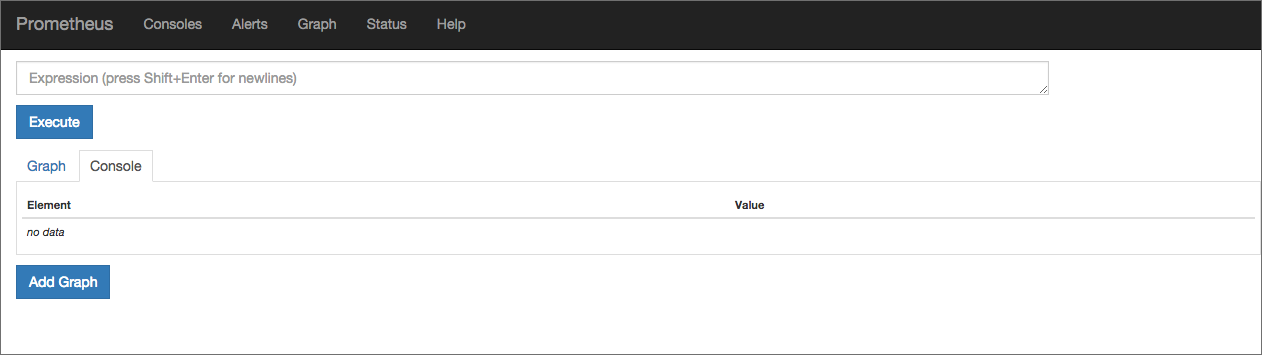
In the Expression field, you can select the metric for which the graph will be displayed. Let's try to track, for example, the amount of active memory on the server. Select the metric node_memory_active and click on the Execute button: Above the chart are buttons that can be used to select a period for displaying statistics.

Console Templates
The main Prometheus console we just reviewed. To view more specialized charts, custom consoles are used.
On the server, they are stored in the / etc / prometheus / consoles directory. Custom consoles display general server statistics (node.html), CPU statistics (node-cpu.html), server I / O statistics (cpu-disk.html), and others. In a browser, they are available at: http: // [Server IP]: 9090 / consoles / <console name> .html.
This is how, for example, the node.html console looks like:
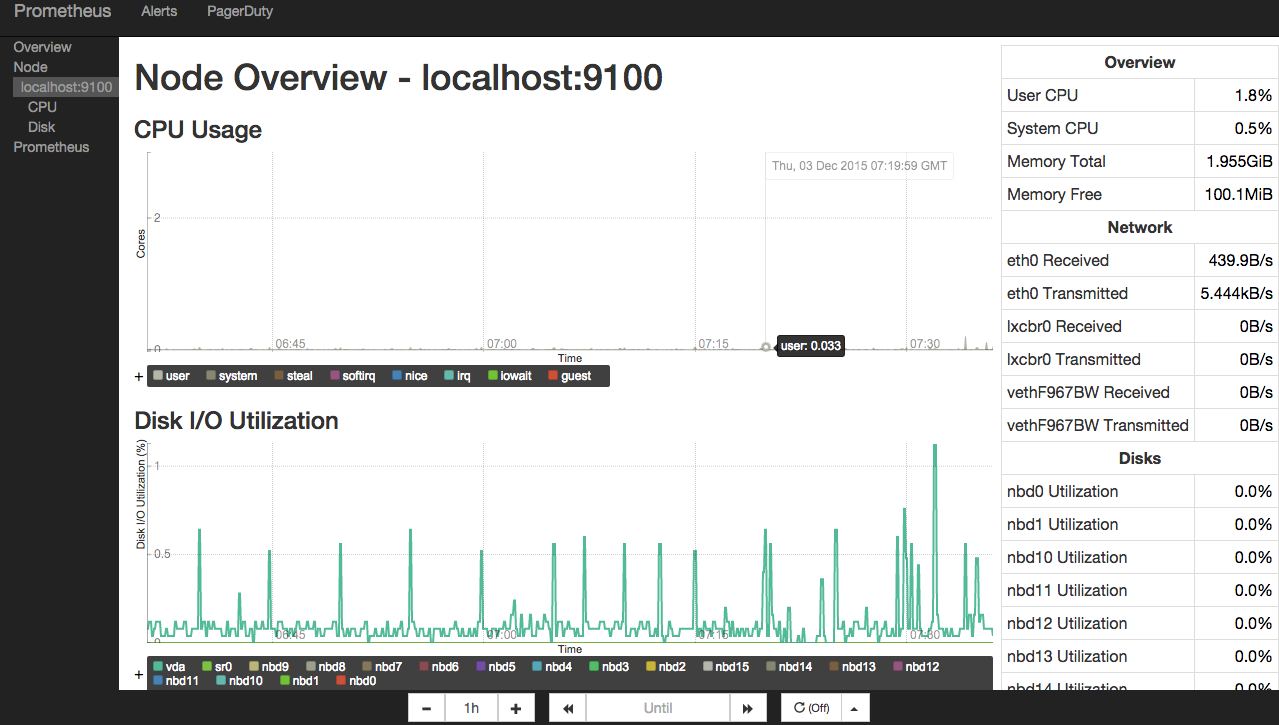
If none of the available consoles suits you, you can create your own console that will display the statistics you need. Prometheus uses the Go HTML templating engine to write consoles. Detailed instructions for creating custom consoles are given.in the official documentation .
And if for one reason or another you are not satisfied with the available consoles, you can integrate Prometheus with the popular Grafana tool .
Prometheus developers have created their own dashboard tool called Promdash (see also the repository on GitHub ), reminiscent of Grafana on the interface. In our opinion, it is still in a somewhat "raw" state, and it is too early to recommend it for use.
Alertmanager: setting notifications
No monitoring tool is unthinkable without a notification distribution component. Prometheus uses the alertmanager for this purpose. Notification settings are stored in the alertmanager.conf configuration file.
Consider the following snippet:
notification_config {
  name: "alertmanager_test"
  email_config {
    email: "[email protected]"
  }
aggregation_rule {
  notification_config_name: "alertmanager_test"
}
Its syntax is understandable: we indicated that notifications upon the occurrence of a certain condition should be sent by e-mail to [email protected].
You can add links to rule files to the configuration file (in fact, they are no different from rule files for collecting metrics described above). The rules specify the conditions under which you need to send notifications.
In general, the rule syntax looks like this:
ALERT <имя проверки>
  IF <параметр и его значение>
  FOR <период времени>
  WITH <набор меток>>
  SUMMARY "<краткое описание>"
  DESCRIPTION "<образец уведомления>"
Consider the function of the rules for more specific examples.
Example 1:
ALERT InstanceDown
  IF up == 0
  FOR 5m
  WITH {
    severity="page"
  }
  SUMMARY "Instance {{$labels.instance}} down"
  DESCRIPTION "{{$labels.instance}} of job {{$labels.job}} has been down for more than 5 minutes."
This rule indicates that a notification should be sent if some instance is unavailable for 5 minutes or more.
Example 2:
ALERT ApiHighRequestLatency
  IF api_http_request_latencies_ms{quantile="0.5"} > 1000
  FOR 1m
  SUMMARY "High request latency on {{$labels.instance}}"
  DESCRIPTION "{{$labels.instance}} has a median request latency above 1s (current value: {{$value}})"
According to this rule, notifications must be sent as soon as the average response time to requests to the API exceeds 1 ms.
For the settings specified in the configuration file to take effect, you need to save it and run the command:
$ alertmanager -config.file alertmanager.conf
You can create several configuration files and register notification settings in them for various cases.
Prometheus sends notifications in JSON format. They look something like this:
{
   "version": "1",
   "status": "firing",
   "alert": [
      {
         "summary": "summary",
         "description": "description",
         "labels": {
            "alertname": "TestAlert"
         },
         "payload": {
            "activeSince": "2015-06-01T12:55:47.356+01:00",
            "alertingRule": "ALERT TestAlert IF absent(metric_name) FOR 0y WITH ",
            "generatorURL": "http://localhost:9090/graph#%5B%7B%22expr%22%3A%22absent%28metric_name%29%22%2C%22tab%22%3A0%7D%5D",
            "value": "1"
         }
      }
   ]
}
Notifications are sent via e-mail, via a web hook, as well as using specialized services: PagerDuty , HipChat and others.
Prometheus developers note that so far the alertmanager is in a "raw" state and warn of possible errors. However, we did not notice any anomalies in the operation of this component.
Conclusion
Prometheus is an interesting and promising tool, and it is worth paying attention to. Among its advantages, you must first highlight:
- ease of deployment;
- Extensive integration with third-party applications and services;
- convenient graphical interface for working with metrics.
If you already have practical experience using Prometheus, share your impressions. We will be grateful for any useful comments and additions.
For those who want to know more, here are some useful links:
- https://developers.soundcloud.com/blog/prometheus-monitoring-at-soundcloud - article about Prometheus from the SoundCloud blog;
- http://www.robustperception.io/blog/ - blog of one of the developers of Prometheus Brian Brazil with interesting practical examples;
- http://agiletesting.blogspot.ru/2015/11/initial-experiences-with-prometheus.html - an interesting report on experiments with Prometheus;
- https://www.digitalocean.com/community/tutorials/how-to-install-prometheus-using-docker-on-centos-7 - instructions for installing Prometheus in Docker
- https://github.com/William-Yeh/ansible-prometheus - Ansible role for installing Prometheus.
If for one reason or another you can’t leave comments here, we invite you to our blog .