We collect and use game statistics with Google Player Analytics
Hello, Habr! The correct use of statistics makes it easy to understand user behavior: how they spend money and at what point do they stop playing. Today we want to offer you to become players yourself for a moment: test an example of a game application in the developer’s console and learn new features of the free tool “Statistics: Players” in the Google Play developer’s console.

The application was created together with the team of Auxbrain , the authors of the game Zombie Highway 2 . Inside you will find anonymized and randomly selected data from a real existing game. You can experience new features on them, which we will tell you about today.
Important: to access the application, you need a Google Play developer account .
Each user will be happy if the developer can guess his wishes. To do this, we added new forecasting capabilities to the API statistics section of the players so that you better understand user behavior.
The new APIs allow you to predict the outflow of players: the system will notify you of a similar probability (for example, if the user stops playing your game regularly). This information can be used to timely create new content, and thereby maintain the interest of players in your application. In addition to this, you can use the method of forecasting expenses: you will receive data on the probability of depositing funds by players and based on these data you will be able to understand whether it is time to arrange an in-game sale for real currency or update a personalized issuance of advertising.
Using reports on funnel conversions, you can create a graph based on any chronologically organized group of events. It can be game achievements (achievements), spending players real currency or various events. For example, you can register user events for each stage of training (stage 1, stage 2, stage 3 ...) and then use this report to visualize exit points and progress in training.
Using group reports, you can compare any events with the values of cumulative events of groups of new users: sessions, cumulative purchases, as well as user events. As a result, you will receive valuable data on the impact of your actions on the player’s behavior model. For example, you can measure the effect of your changes by comparing user activity information before and after edits. Let's say you double the value of each object in the game. Using the detailed data, you will see when the cumulative sessions began to take place: before or after the price increase.
We updated the SDK for iOS and C ++, as well as the Unity plugin. Now they all support the user statistics API, which includes basic user statistics, as well as forecasting spending and churn of players.
Be sure to check out the sample game app and learn more about the Play gaming services . We also recommend reading recommendations from the game developer Auxbrain (a document in English). They will help you work with Google Play gaming services.
The application was created together with the team of Auxbrain , the authors of the game Zombie Highway 2 . Inside you will find anonymized and randomly selected data from a real existing game. You can experience new features on them, which we will tell you about today.
Important: to access the application, you need a Google Play developer account .
New user activity analysis features
Predictive analytics: interact with users before they decide to stop using the application
Each user will be happy if the developer can guess his wishes. To do this, we added new forecasting capabilities to the API statistics section of the players so that you better understand user behavior.
The new APIs allow you to predict the outflow of players: the system will notify you of a similar probability (for example, if the user stops playing your game regularly). This information can be used to timely create new content, and thereby maintain the interest of players in your application. In addition to this, you can use the method of forecasting expenses: you will receive data on the probability of depositing funds by players and based on these data you will be able to understand whether it is time to arrange an in-game sale for real currency or update a personalized issuance of advertising.
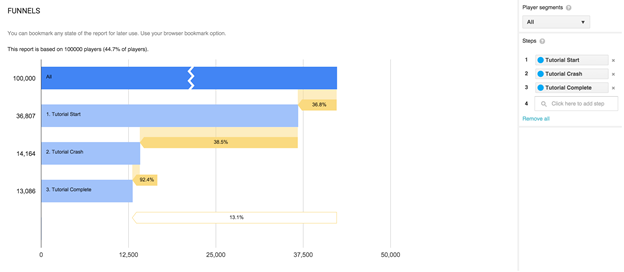
Create charts in sequence reports to get a visual demonstration of event history
Using reports on funnel conversions, you can create a graph based on any chronologically organized group of events. It can be game achievements (achievements), spending players real currency or various events. For example, you can register user events for each stage of training (stage 1, stage 2, stage 3 ...) and then use this report to visualize exit points and progress in training.
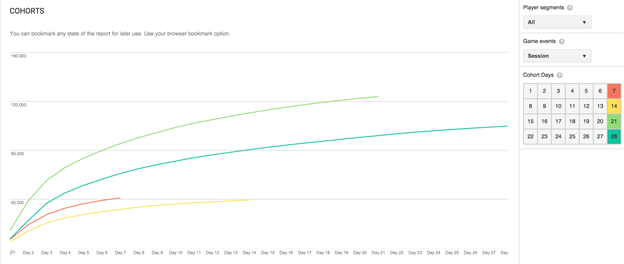
Measure the effect of changes and compare it with cumulative values from new users using a group report
Using group reports, you can compare any events with the values of cumulative events of groups of new users: sessions, cumulative purchases, as well as user events. As a result, you will receive valuable data on the impact of your actions on the player’s behavior model. For example, you can measure the effect of your changes by comparing user activity information before and after edits. Let's say you double the value of each object in the game. Using the detailed data, you will see when the cumulative sessions began to take place: before or after the price increase.
Updated SDKs for iOS and C ++, as well as the Unity plugin to support the user statistics API
We updated the SDK for iOS and C ++, as well as the Unity plugin. Now they all support the user statistics API, which includes basic user statistics, as well as forecasting spending and churn of players.
Be sure to check out the sample game app and learn more about the Play gaming services . We also recommend reading recommendations from the game developer Auxbrain (a document in English). They will help you work with Google Play gaming services.