Comparison of free SQUID traffic accounting software
Recently in our company there was a need to transfer proxies from MS ISA Server to free software. I did not have to choose a proxy server for a long time (squid). Using a few practical recommendations, I configured the proxy for our needs. Some difficulties arose when choosing a program for traffic accounting.
The requirements were:
1) free software
2) the ability to process logs from various proxies on one server
3) the ability to build standard reports by mail, or a link to a web server
4) the construction of reports for individual departments and the distribution of such reports to department heads, or providing access via a link on a web server
Developers presented very scarce information on traffic accounting programs: a concise description of the purpose of the program plus an optional bonus a couple of screenshots. Yes, it’s clear that any program will calculate the amount of traffic per day / week / month, but additional interesting features that distinguish one program from others are not described.
I decided to write this post in which I will try to describe the capabilities and disadvantages of such programs, as well as some of their key “chips”, to help a little in choosing those who have to do it.
Our candidates:
SARG
free-sa
lightsquid
SquidAnalyzer
ScreenSquid
So let's get started.
The eldest among the supported programs of this class (development started in 1998, the former name is sqmgrlog). The latest release (version 2.3.10) is April 2015. After that, there were several improvements and corrections that are available in the master version (can be downloaded using git from sourceforge).
The program is launched manually or by cron. You can run it without parameters (then all parameters will be taken from the sarg.conf configuration file), or you can specify parameters in the command line or script, for example, the dates for which the report is built.
Reports are created in the form of html-pages and are added to the directory / var / www / html / squid-reports (by default). You can specify a parameter that sets the number of stored reports in the directory. For example, 10 daily and 20 weekly, older ones will be automatically deleted.
It is possible to use several config-files with different parameters for different types of reports (for example, for daily reports you can create your own config, in which the option to create graphs will be disabled and another directory for report output will be specified).
Domestic development. Since November 2013, there were no new versions. The claimed faster reporting than competing programs and less space for ready-made reports. Check it out!
According to the logic of work, this program is closest to SARG (and the author himself compares it with this program (for example, here )), therefore we will also compare with it.
Pleased with the presence of several themes. The theme is 3 css-files and 4 png-icons corresponding to them.
Reports are really done faster. A daily report was created at 4:30, when SARG had 12 minutes. True, the volume occupied was not so: the volume occupied by the reports was 440 MB (free-sa) and 336 MB (SARG).
Let's try to give the task more complicated: process a log file of 3.2 GB in 10 days, in which 26.3 million lines.
Free-sa also made the report faster, in 46 minutes, the report takes up 3.7 GB of disk space. SARG spent 1 hour 10 minutes, the report takes 2.5 GB.
But both of these reports will be inconvenient to read. For example, who wants to manually calculate which domain is more popular - vk.com or googlevideo.com and manually calculate the traffic of all their subdomains? If you leave only Level 2 domains in the SARG settings, then creating a report will take about the same amount of time, but now the report itself takes up 1.5 GB of disk space (daily from 336 MB has decreased to 192 MB).
Perhaps the most popular traffic reader. It works quickly, reports do not take up much disk space. Although this program has not been updated for a long time, I still decided to consider its capabilities in this article.
The logic of the program is different: the program reads the log and creates a set of data files, which it then uses to create web pages. That is, there are no pre-created reports with data here, data pages are generated on the fly. The advantages of such a solution are obvious: to get a report it is not necessary to parse all the logs for the period, it is enough to "feed" the lightsquid to the accumulated journal once a day. You can do this several times a few times a day with cron to quickly add a new piece of information.
Not without drawbacks: it is impossible to process logs from different servers and collect statistics in one place: when processing the log for some day from another server, existing statistics for this day are erased.
There is a strange limitation: lightsquid “perceives” both uncompressed log files as well as compressed ones (gz for sure), but in the second case the file name should be in this format: access.log.X.gz, files with the format access.log- YYYYMMDD.gz will not accept.
Through simple manipulations, we overcome this limitation and look at what happened.
A program similar to lightsquid is also written in Perl. More nice design. The latest version 6.4 currently released in mid-December of this year, many improvements have been made. Program website: squidanalyzer.darold.net .
SquidAnalyzer can use several computer processors (the -j option), which makes reports faster, but this only applies to uncompressed files. For packaged (gz format supported) processing occurs using a single processor core.
And one more comparison with lightsquid: the same report on the same server was done for about a day, the disk takes up 3.7 GB.
Like lightsquid, SquidAnalyzer will not be able to merge two or more log files from different servers in the same period.
This program has a different logic: the log is imported into the MySQL database, then the data is requested from it when working in the web interface. The base with the processed ten-day log mentioned earlier takes 1.5 GB.
That's all. I hope this material is useful to someone. Thank you all for your attention.
The requirements were:
1) free software
2) the ability to process logs from various proxies on one server
3) the ability to build standard reports by mail, or a link to a web server
4) the construction of reports for individual departments and the distribution of such reports to department heads, or providing access via a link on a web server
Developers presented very scarce information on traffic accounting programs: a concise description of the purpose of the program plus an optional bonus a couple of screenshots. Yes, it’s clear that any program will calculate the amount of traffic per day / week / month, but additional interesting features that distinguish one program from others are not described.
I decided to write this post in which I will try to describe the capabilities and disadvantages of such programs, as well as some of their key “chips”, to help a little in choosing those who have to do it.
Our candidates:
SARG
free-sa
lightsquid
SquidAnalyzer
ScreenSquid
Retreat
Information about the "age" of the program and the release of the latest release is not a comparison parameter and is provided for information only. I will try to compare exclusively the functionality of the program. Also, I deliberately did not consider too old programs that have not been updated for many years.
Logs are sent to the analyzer for processing in the form that squid created them and will not be subjected to any preliminary processing in order to make changes to them. Processing of invalid entries and all possible conversions of the log fields should be entered by the analyzer itself and should be present only in the report. This article is not a setup guide. Configuration and usage issues can be covered in separate articles.
Logs are sent to the analyzer for processing in the form that squid created them and will not be subjected to any preliminary processing in order to make changes to them. Processing of invalid entries and all possible conversions of the log fields should be entered by the analyzer itself and should be present only in the report. This article is not a setup guide. Configuration and usage issues can be covered in separate articles.
So let's get started.
SARG - Squid Analysis Report Generator
The eldest among the supported programs of this class (development started in 1998, the former name is sqmgrlog). The latest release (version 2.3.10) is April 2015. After that, there were several improvements and corrections that are available in the master version (can be downloaded using git from sourceforge).
The program is launched manually or by cron. You can run it without parameters (then all parameters will be taken from the sarg.conf configuration file), or you can specify parameters in the command line or script, for example, the dates for which the report is built.
Reports are created in the form of html-pages and are added to the directory / var / www / html / squid-reports (by default). You can specify a parameter that sets the number of stored reports in the directory. For example, 10 daily and 20 weekly, older ones will be automatically deleted.
It is possible to use several config-files with different parameters for different types of reports (for example, for daily reports you can create your own config, in which the option to create graphs will be disabled and another directory for report output will be specified).
In detail
Upon entering the main page with reports, we can choose the period for which it was created (determined in the report creation parameters), the date of its creation, the number of unique users, the total traffic for the period, and the average amount of traffic per user.

When choosing one of the periods we can get a topusers report for this period. Below I will give descriptions and examples of all types of reports that SARG can do.
1) topusers - total traffic by users. A user is understood to be either the host name to which Internet access is granted or the user login. Report example:

IP addresses are displayed here. When you enable this option, IP addresses are converted to domain names.
Do you use authentication? Accounts are converted to real names:
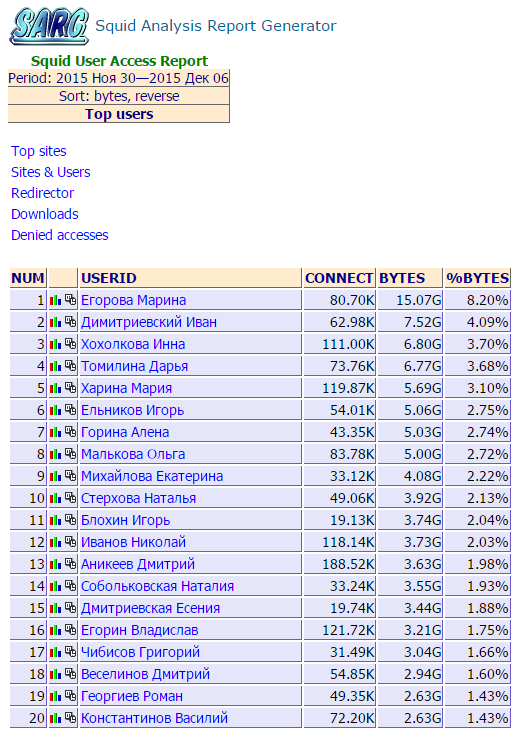
Appearance can be configured in the css file. The output columns are also customizable, unnecessary can be removed. Column sorting is supported (sorttable.js).
When you click on the icon with the graph on the left, we will see a similar graph:
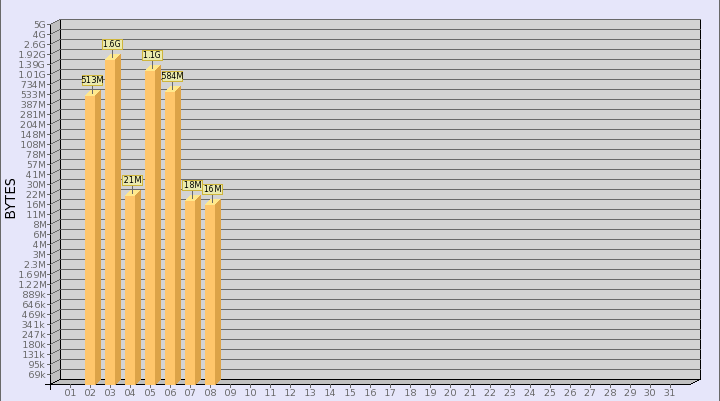
When you click on the icon on the right, we get report 5.
2) topsites - report on the most popular sites. By default, a list of the 100 most popular sites is displayed (the value is adjusted). Using regular expressions or setting aliases, you can combine traffic from domains of the 3rd and higher levels to a 2nd-level domain (as in the screenshot) or set any other rule. For each domain, you can set a rule separately, for example, for yandex.ru and mail.ru combine up to the 3rd level. The meaning of the fields is quite obvious.

3) sites_users - report on who visited a specific site. Everything is simple: the domain name and who addressed it. Traffic is not displayed here.
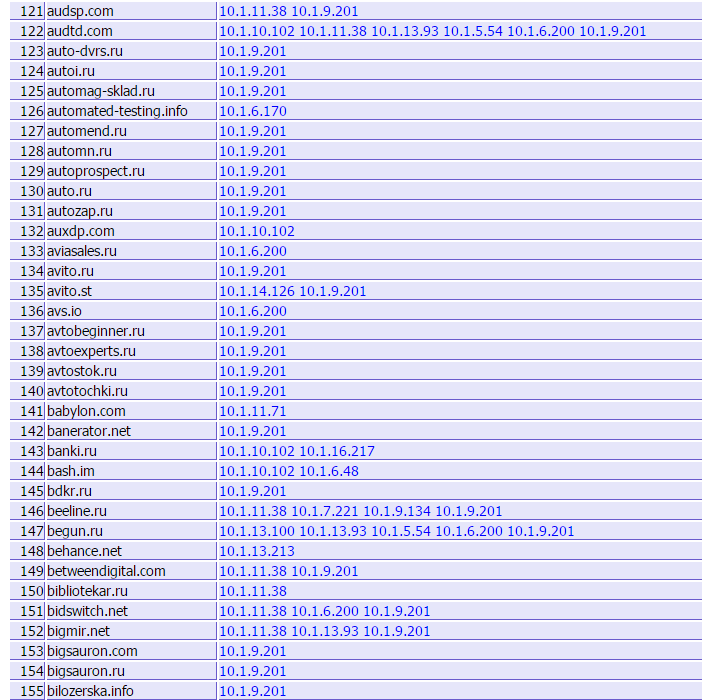
4) users_sites - report on visited sites by each user.
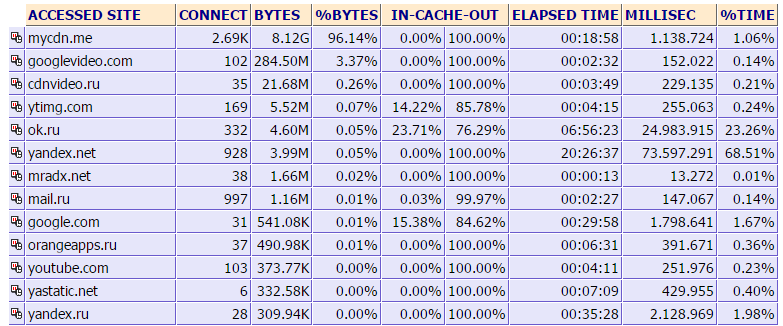
Everything is clear here too. If we click on the icon in the first column, we get a report 8).
5) date_time - distribution of user traffic by days and hours.

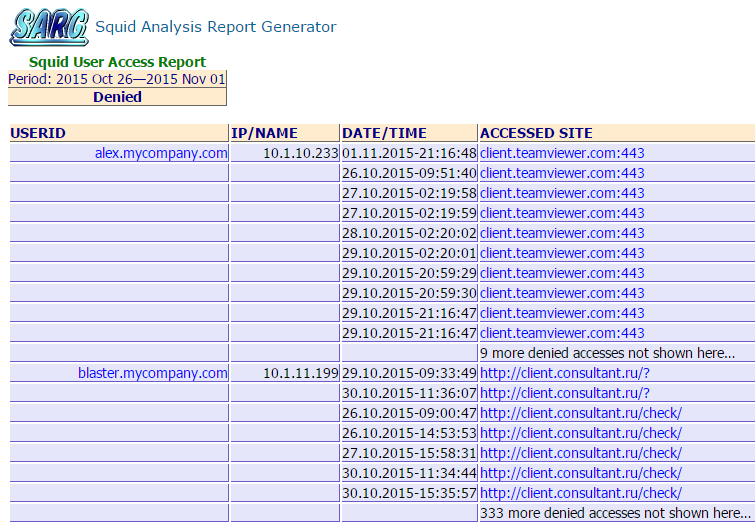
6) denied - requests blocked by squid. It displays to whom, when and where access was denied. The number of entries is configurable (10 by default).
7) auth_failures - authentication denials. HTTP / 407.
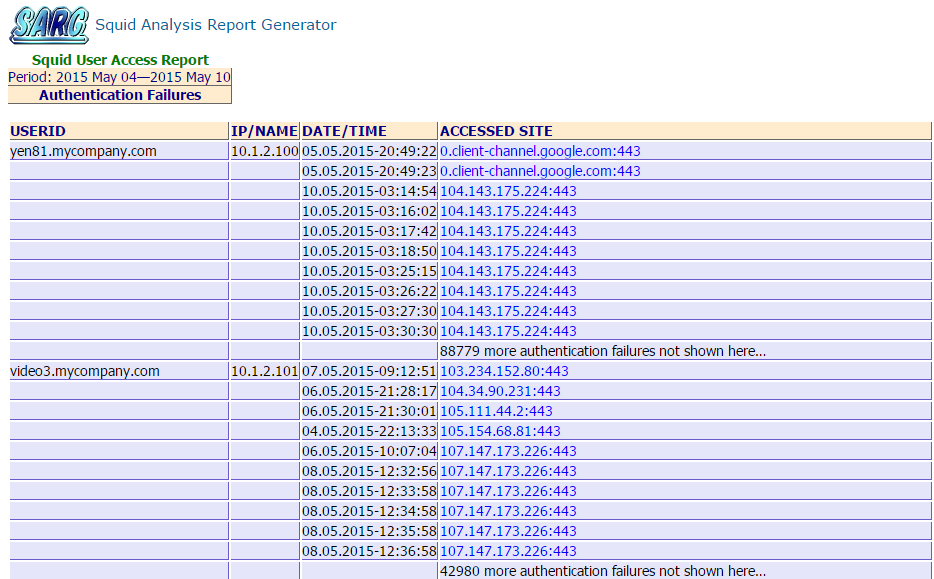
The number of entries is configurable (10 by default).
8) site_user_time_date - shows at what time what site and from which machine the user visited.

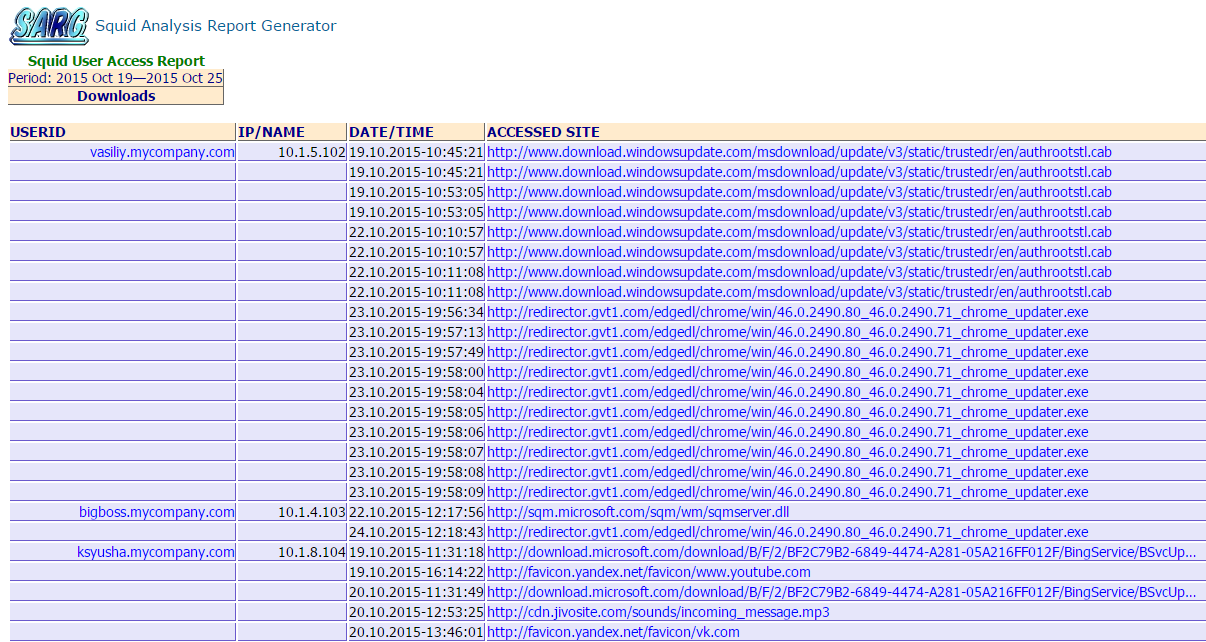
9) downloads - list of downloads.
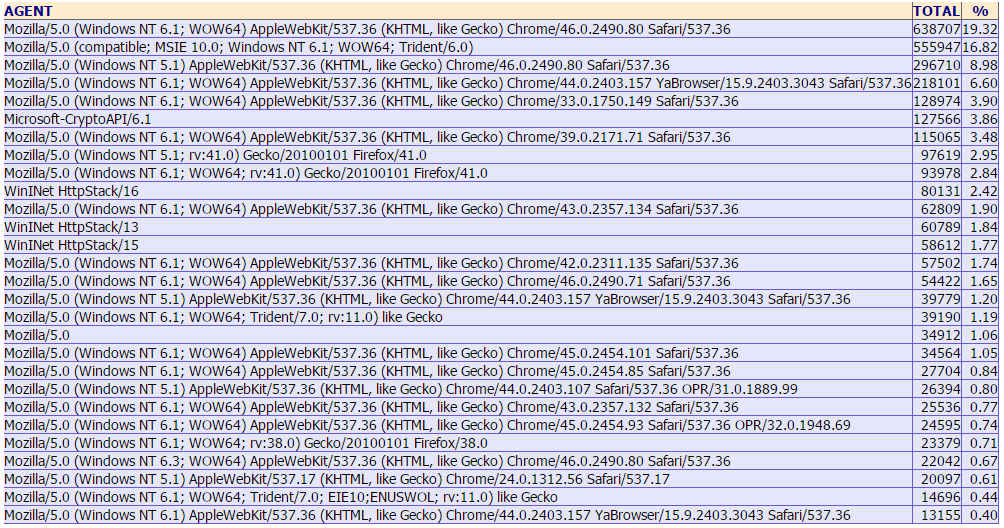
10) useragent - report on used programs.
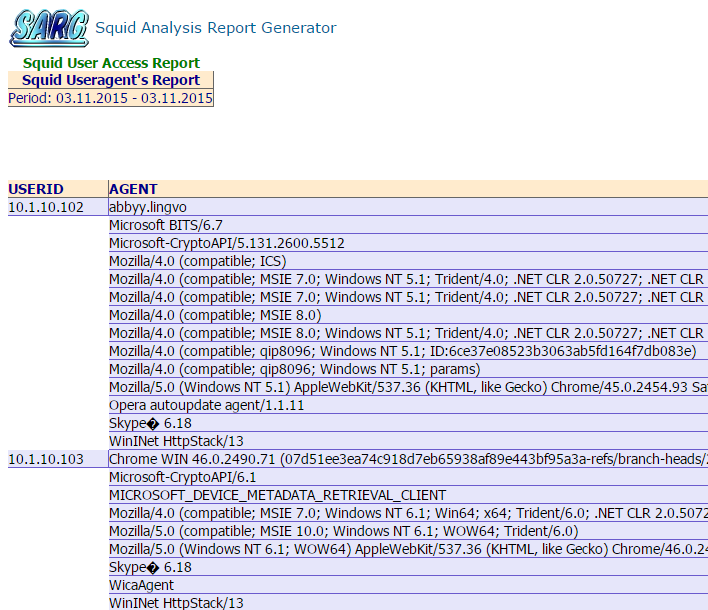
The first part of the report displays the IP address and used useragents.
In the second - a general list of useragents with a percentage distribution, including versions.
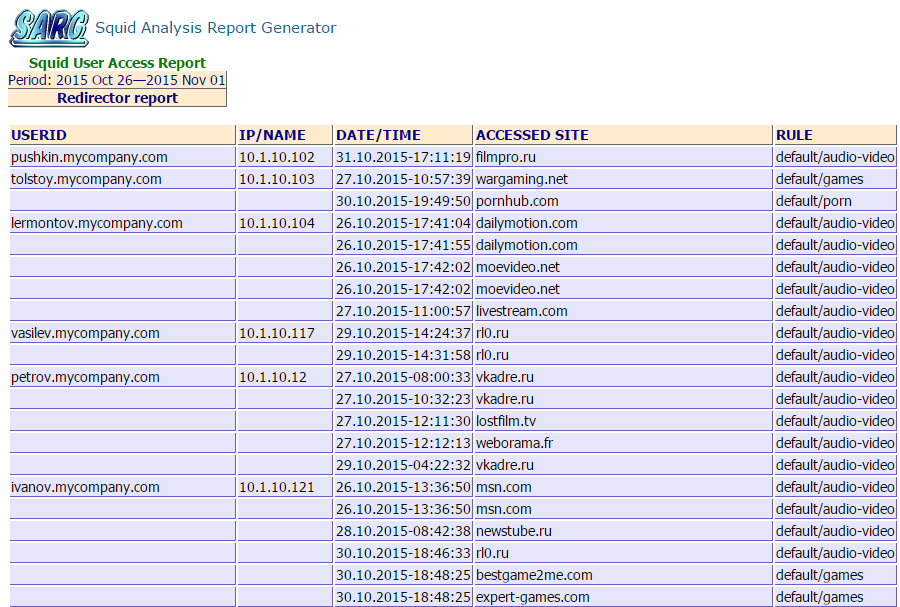
11) redirector - the report shows to whom access was blocked by means of the blocker. Squidguard, dansguardian, rejik are supported, the log format is customizable.
SARG has more than 120 settings, language support (100% of messages are translated into Russian), support for regular expressions, working with LDAP, the ability to provide users with access only to their reports on the web server (via .htaccess), the ability to convert logs to their own format for saving space, uploading reports to a text file for subsequent filling in the database, working with squid log files (splitting one or more log files by day).
It is possible to create reports on a specific set of defined groups, for example, if you want to make a separate report for the unit. In the future, access to the web page with the department reports can be provided, for example, to managers using the web server.
You can send reports by e-mail, however, so far only the topusers report is supported, and the letter itself will be plain text without HTML support.
You can exclude certain users or certain hosts from processing. You can set aliases for users by combining the traffic of several accounts into one, for example, all outstaffers. You can also set aliases for sites, for example, combine several social networks into a certain alias, in which case all parameters for the specified domains (number of connections, traffic volume, processing time) will be summed. Or, using regular expressions, you can “drop” domains above level 3.
It is possible to upload to separate files a list of users that exceed certain volumes for the period. The output will be several files, for example: userlimit_1G.txt - exceeding 1 Gb, userlimit_5G.txt - exceeding 5 Gb, and so on - a total of 16 limits.
SARG also has a couple of PHP pages in its arsenal: viewing current connections to squid and for adding domain names to squidguard blocking lists.
In general, it is a very flexible and powerful tool, easy to learn. All parameters are described in the default configuration file, in the sourceforge project’s wiki section there is a more detailed description of all parameters in the wiki section, divided into groups, and examples of their use.
When choosing one of the periods we can get a topusers report for this period. Below I will give descriptions and examples of all types of reports that SARG can do.
1) topusers - total traffic by users. A user is understood to be either the host name to which Internet access is granted or the user login. Report example:
IP addresses are displayed here. When you enable this option, IP addresses are converted to domain names.
Do you use authentication? Accounts are converted to real names:
Appearance can be configured in the css file. The output columns are also customizable, unnecessary can be removed. Column sorting is supported (sorttable.js).
When you click on the icon with the graph on the left, we will see a similar graph:
When you click on the icon on the right, we get report 5.
2) topsites - report on the most popular sites. By default, a list of the 100 most popular sites is displayed (the value is adjusted). Using regular expressions or setting aliases, you can combine traffic from domains of the 3rd and higher levels to a 2nd-level domain (as in the screenshot) or set any other rule. For each domain, you can set a rule separately, for example, for yandex.ru and mail.ru combine up to the 3rd level. The meaning of the fields is quite obvious.
3) sites_users - report on who visited a specific site. Everything is simple: the domain name and who addressed it. Traffic is not displayed here.
4) users_sites - report on visited sites by each user.
Everything is clear here too. If we click on the icon in the first column, we get a report 8).
5) date_time - distribution of user traffic by days and hours.
6) denied - requests blocked by squid. It displays to whom, when and where access was denied. The number of entries is configurable (10 by default).
7) auth_failures - authentication denials. HTTP / 407.
The number of entries is configurable (10 by default).
8) site_user_time_date - shows at what time what site and from which machine the user visited.
9) downloads - list of downloads.
10) useragent - report on used programs.
The first part of the report displays the IP address and used useragents.
In the second - a general list of useragents with a percentage distribution, including versions.
11) redirector - the report shows to whom access was blocked by means of the blocker. Squidguard, dansguardian, rejik are supported, the log format is customizable.
SARG has more than 120 settings, language support (100% of messages are translated into Russian), support for regular expressions, working with LDAP, the ability to provide users with access only to their reports on the web server (via .htaccess), the ability to convert logs to their own format for saving space, uploading reports to a text file for subsequent filling in the database, working with squid log files (splitting one or more log files by day).
It is possible to create reports on a specific set of defined groups, for example, if you want to make a separate report for the unit. In the future, access to the web page with the department reports can be provided, for example, to managers using the web server.
You can send reports by e-mail, however, so far only the topusers report is supported, and the letter itself will be plain text without HTML support.
You can exclude certain users or certain hosts from processing. You can set aliases for users by combining the traffic of several accounts into one, for example, all outstaffers. You can also set aliases for sites, for example, combine several social networks into a certain alias, in which case all parameters for the specified domains (number of connections, traffic volume, processing time) will be summed. Or, using regular expressions, you can “drop” domains above level 3.
It is possible to upload to separate files a list of users that exceed certain volumes for the period. The output will be several files, for example: userlimit_1G.txt - exceeding 1 Gb, userlimit_5G.txt - exceeding 5 Gb, and so on - a total of 16 limits.
SARG also has a couple of PHP pages in its arsenal: viewing current connections to squid and for adding domain names to squidguard blocking lists.
In general, it is a very flexible and powerful tool, easy to learn. All parameters are described in the default configuration file, in the sourceforge project’s wiki section there is a more detailed description of all parameters in the wiki section, divided into groups, and examples of their use.
free-sa
Domestic development. Since November 2013, there were no new versions. The claimed faster reporting than competing programs and less space for ready-made reports. Check it out!
According to the logic of work, this program is closest to SARG (and the author himself compares it with this program (for example, here )), therefore we will also compare with it.
Pleased with the presence of several themes. The theme is 3 css-files and 4 png-icons corresponding to them.
Reports are really done faster. A daily report was created at 4:30, when SARG had 12 minutes. True, the volume occupied was not so: the volume occupied by the reports was 440 MB (free-sa) and 336 MB (SARG).
Let's try to give the task more complicated: process a log file of 3.2 GB in 10 days, in which 26.3 million lines.
Free-sa also made the report faster, in 46 minutes, the report takes up 3.7 GB of disk space. SARG spent 1 hour 10 minutes, the report takes 2.5 GB.
But both of these reports will be inconvenient to read. For example, who wants to manually calculate which domain is more popular - vk.com or googlevideo.com and manually calculate the traffic of all their subdomains? If you leave only Level 2 domains in the SARG settings, then creating a report will take about the same amount of time, but now the report itself takes up 1.5 GB of disk space (daily from 336 MB has decreased to 192 MB).
In detail
Upon entering the main page, we see something like the following (blues theme is selected):

Honestly, the purpose of the year and month output is not clear, when you click on them nothing happens. You can write something in the search field, but again, nothing happens. You can select the period of interest.
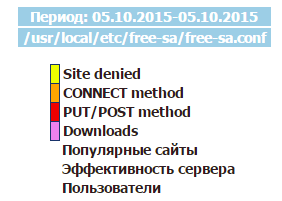
List of blocked URLs:

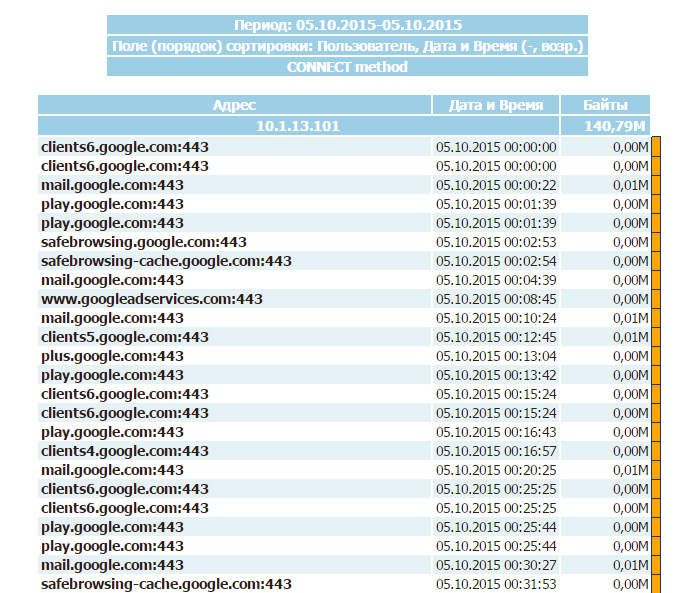
CONNECT metdod
report : PUT / POST metdod
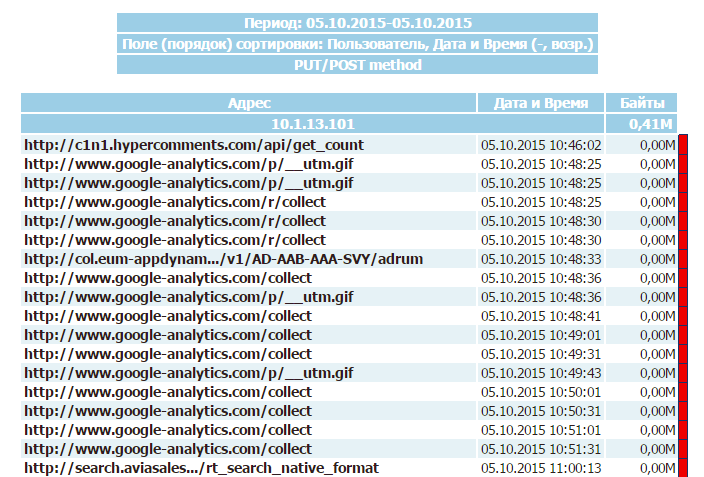
report : Download report:

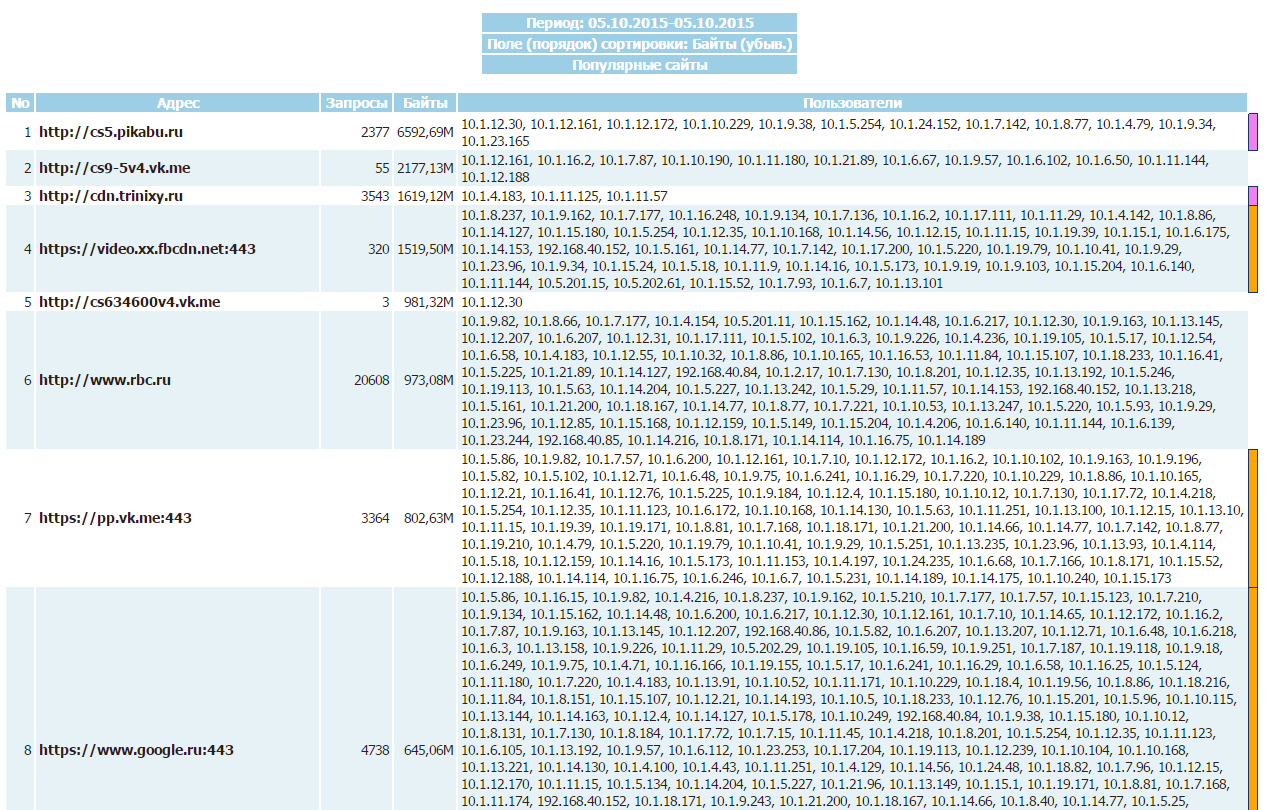
Popular sites: A
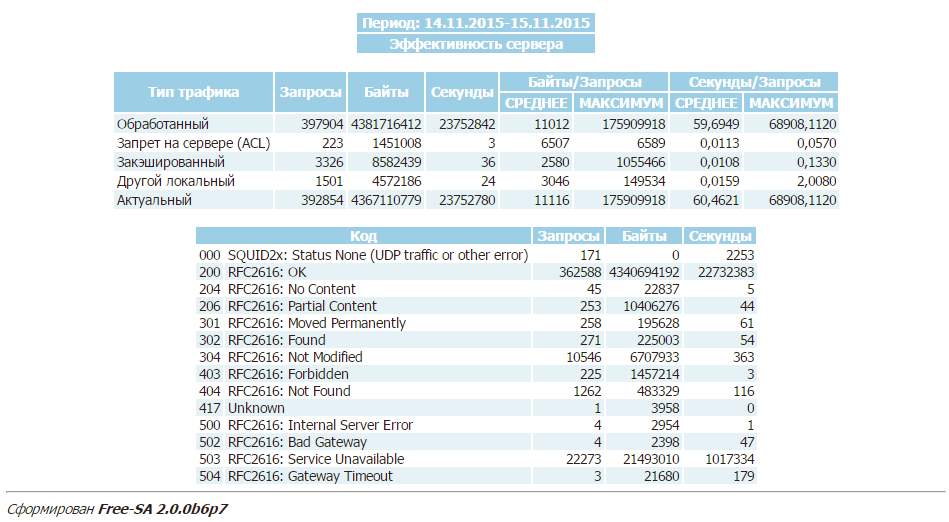
proxy server performance report was interesting:
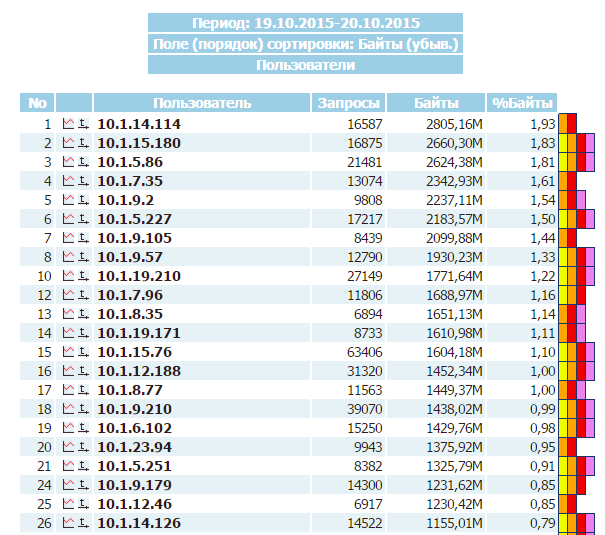
User report:
When we click on the graph icon in the second column, we get a graph of the Internet usage by a specific user:
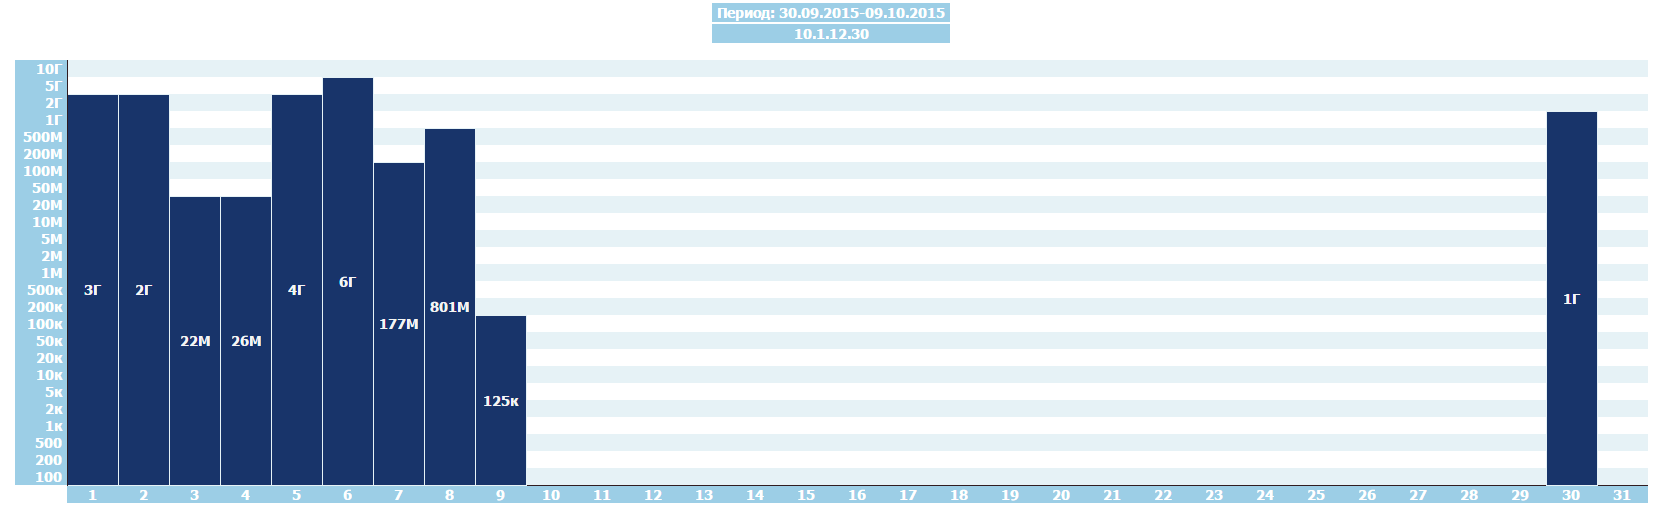
When you click on the second icon, we get the download table of the Internet channel by the hour:

When choosing an IP address, we get a list of sites by user in descending order of traffic:
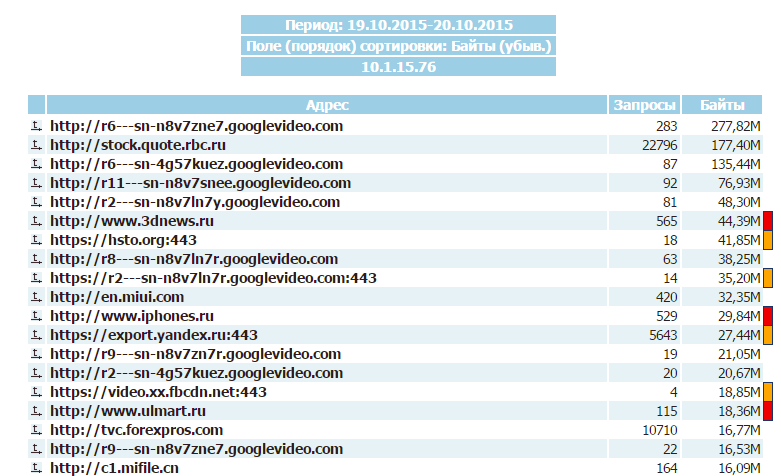
All statistics are displayed in bytes. To switch to megabytes you need to set the parameter
The program does not accept compressed log files, does not accept more than one file with the -l option, does not support file selection by mask. The author of the program suggests circumventing these limitations by creating named pipes.
An annoying glitch was detected - when the length of the log line is too long, timestamps are entered instead of addresses:
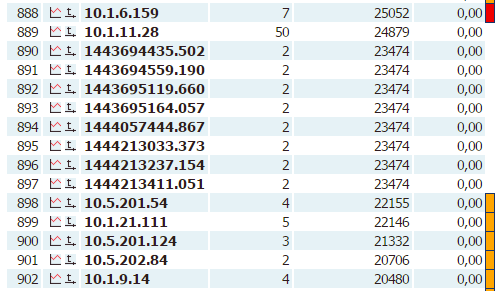
When viewing the traffic of this "user", you can see the domain with the error source:
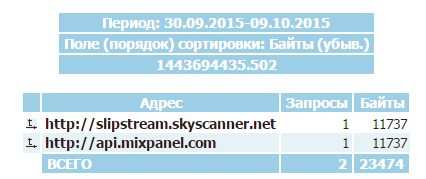
Thus, the number of users has increased several times.
If you compare these two programs, then free-sa generates a report a little faster. A 20-fold increase in speed, as stated by the author, I could not find. Perhaps it can be seen under some specific conditions. I think it’s not important how long it takes to create a weekly report at night - 30 minutes or 50. Free-sa has no advantage in the amount of space occupied by reports.
Honestly, the purpose of the year and month output is not clear, when you click on them nothing happens. You can write something in the search field, but again, nothing happens. You can select the period of interest.
List of blocked URLs:
CONNECT metdod
report : PUT / POST metdod
report : Download report:
Popular sites: A
proxy server performance report was interesting:
User report:
When we click on the graph icon in the second column, we get a graph of the Internet usage by a specific user:
When you click on the second icon, we get the download table of the Internet channel by the hour:
When choosing an IP address, we get a list of sites by user in descending order of traffic:
All statistics are displayed in bytes. To switch to megabytes you need to set the parameter
reports_bytes_divisor = "M"
The program does not accept compressed log files, does not accept more than one file with the -l option, does not support file selection by mask. The author of the program suggests circumventing these limitations by creating named pipes.
An annoying glitch was detected - when the length of the log line is too long, timestamps are entered instead of addresses:
When viewing the traffic of this "user", you can see the domain with the error source:
Thus, the number of users has increased several times.
If you compare these two programs, then free-sa generates a report a little faster. A 20-fold increase in speed, as stated by the author, I could not find. Perhaps it can be seen under some specific conditions. I think it’s not important how long it takes to create a weekly report at night - 30 minutes or 50. Free-sa has no advantage in the amount of space occupied by reports.
lightsquid
Perhaps the most popular traffic reader. It works quickly, reports do not take up much disk space. Although this program has not been updated for a long time, I still decided to consider its capabilities in this article.
The logic of the program is different: the program reads the log and creates a set of data files, which it then uses to create web pages. That is, there are no pre-created reports with data here, data pages are generated on the fly. The advantages of such a solution are obvious: to get a report it is not necessary to parse all the logs for the period, it is enough to "feed" the lightsquid to the accumulated journal once a day. You can do this several times a few times a day with cron to quickly add a new piece of information.
Not without drawbacks: it is impossible to process logs from different servers and collect statistics in one place: when processing the log for some day from another server, existing statistics for this day are erased.
There is a strange limitation: lightsquid “perceives” both uncompressed log files as well as compressed ones (gz for sure), but in the second case the file name should be in this format: access.log.X.gz, files with the format access.log- YYYYMMDD.gz will not accept.
Through simple manipulations, we overcome this limitation and look at what happened.
In detail
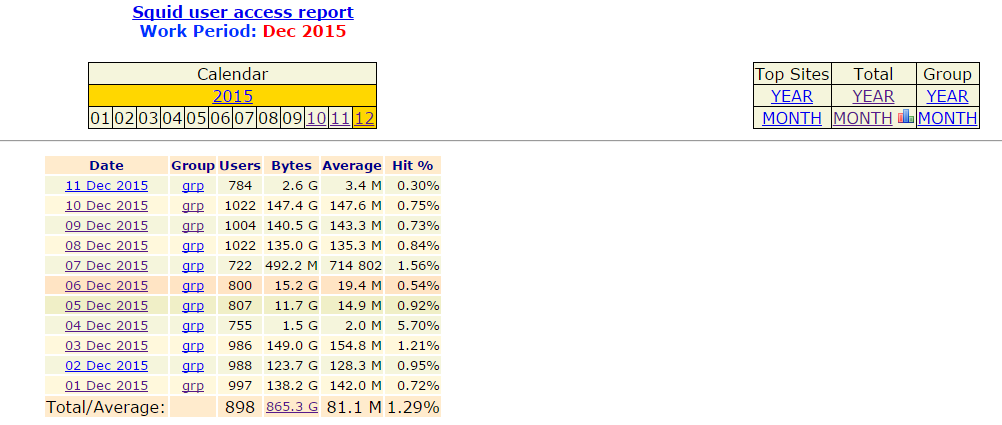
The monthly report (total traffic of 3 Tb, 110 million lines) took up 1 GB of disk space.
On the home page, we see daily traffic for the current month.
When choosing a day, we see a daily report for all users:
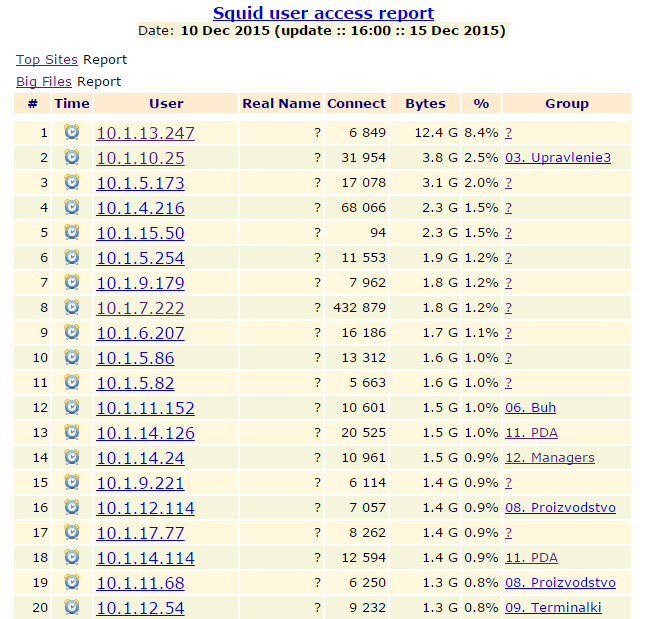
If groups are specified, the name of the group to which the user belongs is displayed in the right column. Users who are not included in any group are grouped in group 00 no in group (in this report they are marked with a question mark).
When you select grp on the main page for the appropriate date, we get to the user report page, divided into groups. First, those that are not included in any group are listed, then the groups in order.
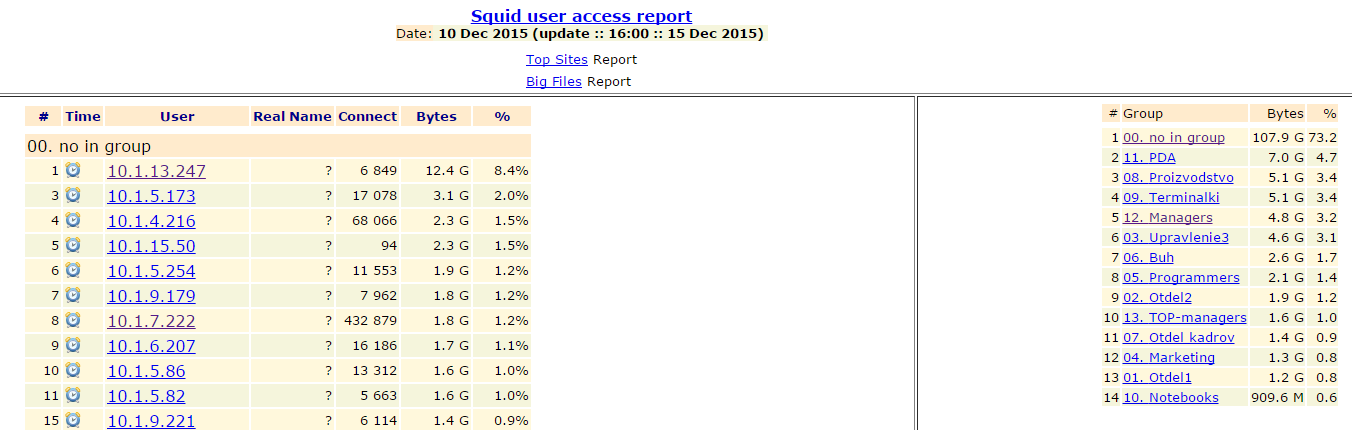
When you click on the name of the group in the table on the right, go down to the place in the page where the report for this group starts:

By clicking on the “Top sites report” we get a report on popular sites for the day:

Big files report:
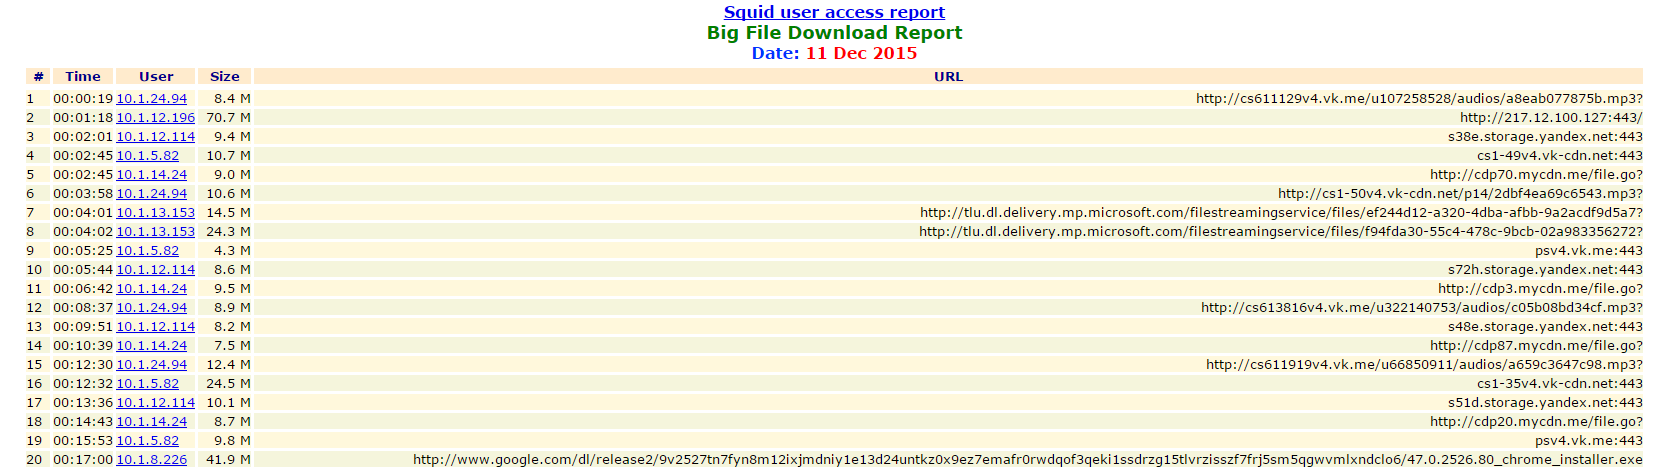
Go to the table on the right.
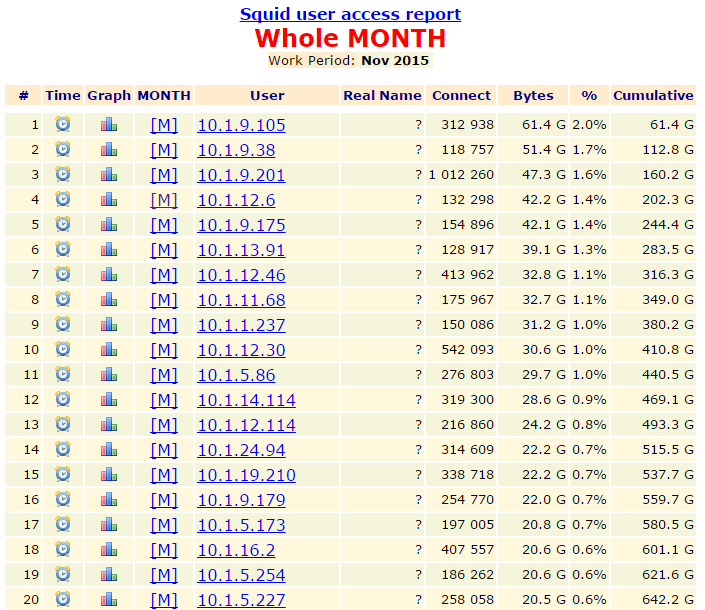
Here you can get a list of top sites for the month and for the whole year (they look the same, therefore, without a screenshot), general statistics for the year and for the month, as well as statistics for the year and for the month by group.
Monthly statistics:
By clicking on the clock icon, we can see a table of sites, access time and traffic consumed per hour:
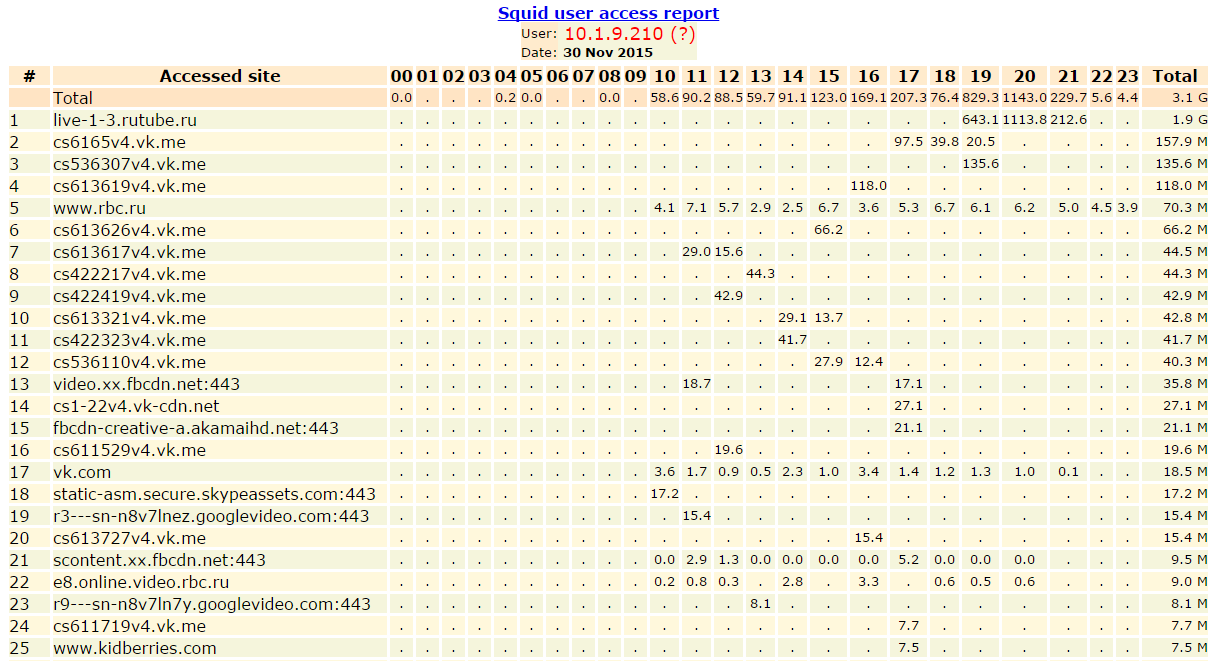
Statistics for the day are displayed here, but for the month and for the year they will look something like this, hourly statistics for domains are summed up.
By clicking on the graph icon, we can see the traffic consumption by the user for a month:

Columns of the graph are clickable: when you click on a column, we switch to user statistics for another day.
When you click on [M] we get a report on the consumption of traffic by the user for a month indicating the volume for each day and for a full week.
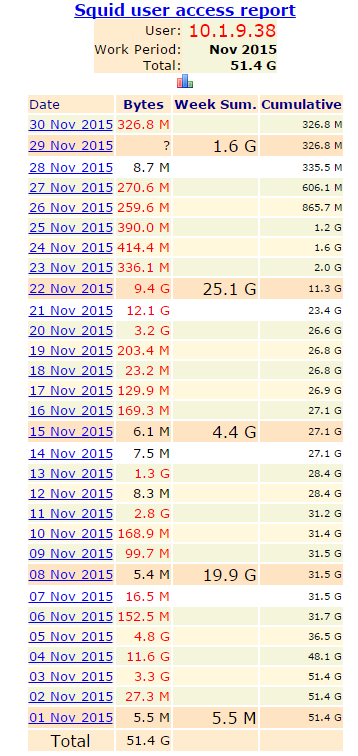
When you click on the username, we get a list of sites that the user visited in descending order of traffic:
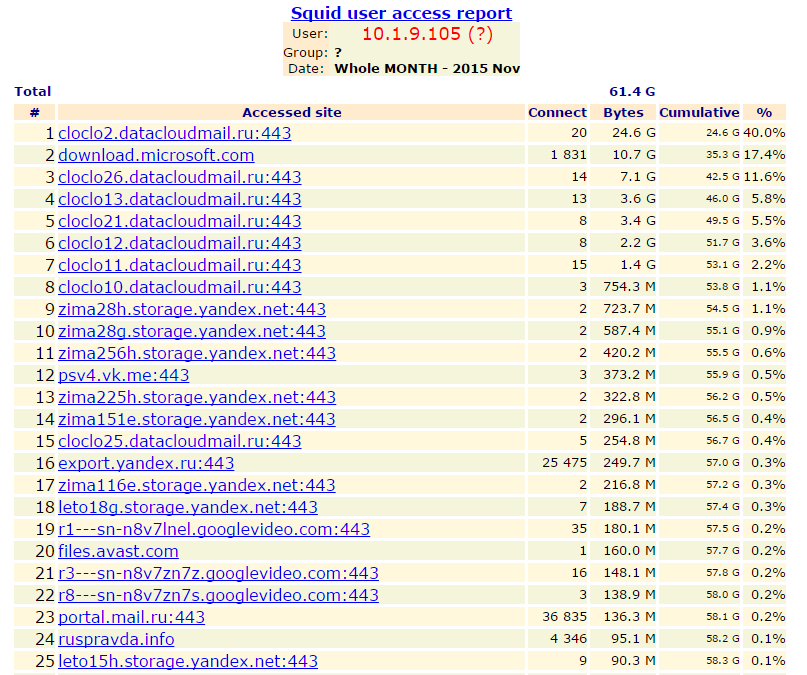
Well, that's all. Everything is simple and concise. IP addresses can be converted to domain names. Using regular expressions, domain names can be combined into second-level domains, just in case I bring a regular expression: With skills in perl, you can modify it for yourself.
On the home page, we see daily traffic for the current month.
When choosing a day, we see a daily report for all users:
If groups are specified, the name of the group to which the user belongs is displayed in the right column. Users who are not included in any group are grouped in group 00 no in group (in this report they are marked with a question mark).
When you select grp on the main page for the appropriate date, we get to the user report page, divided into groups. First, those that are not included in any group are listed, then the groups in order.
When you click on the name of the group in the table on the right, go down to the place in the page where the report for this group starts:
By clicking on the “Top sites report” we get a report on popular sites for the day:
Big files report:
Go to the table on the right.
Here you can get a list of top sites for the month and for the whole year (they look the same, therefore, without a screenshot), general statistics for the year and for the month, as well as statistics for the year and for the month by group.
Monthly statistics:
By clicking on the clock icon, we can see a table of sites, access time and traffic consumed per hour:
Statistics for the day are displayed here, but for the month and for the year they will look something like this, hourly statistics for domains are summed up.
By clicking on the graph icon, we can see the traffic consumption by the user for a month:
Columns of the graph are clickable: when you click on a column, we switch to user statistics for another day.
When you click on [M] we get a report on the consumption of traffic by the user for a month indicating the volume for each day and for a full week.
When you click on the username, we get a list of sites that the user visited in descending order of traffic:
Well, that's all. Everything is simple and concise. IP addresses can be converted to domain names. Using regular expressions, domain names can be combined into second-level domains, just in case I bring a regular expression: With skills in perl, you can modify it for yourself.
$url =~ s/([a-z]+:\/\/)??([a-z0-9\-]+\.){0,}([a-z0-9\-]+\.){1}([a-z]+)(.*)/$3$4/o;
Squidanalyzer
A program similar to lightsquid is also written in Perl. More nice design. The latest version 6.4 currently released in mid-December of this year, many improvements have been made. Program website: squidanalyzer.darold.net .
SquidAnalyzer can use several computer processors (the -j option), which makes reports faster, but this only applies to uncompressed files. For packaged (gz format supported) processing occurs using a single processor core.
And one more comparison with lightsquid: the same report on the same server was done for about a day, the disk takes up 3.7 GB.
Like lightsquid, SquidAnalyzer will not be able to merge two or more log files from different servers in the same period.
More details
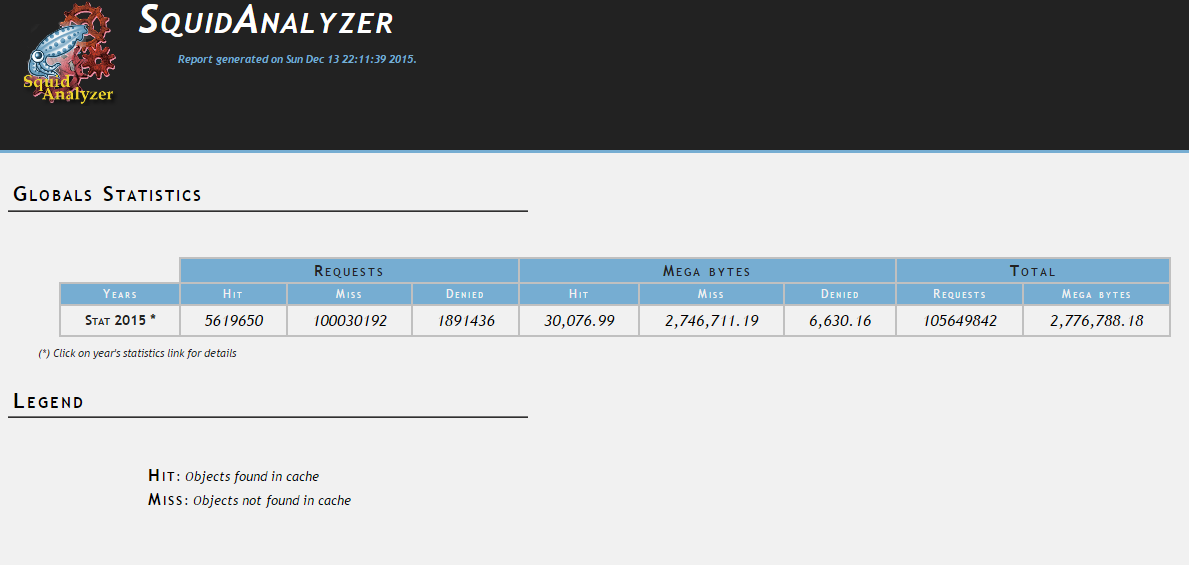
Главная страница — можно выбрать год отчета.
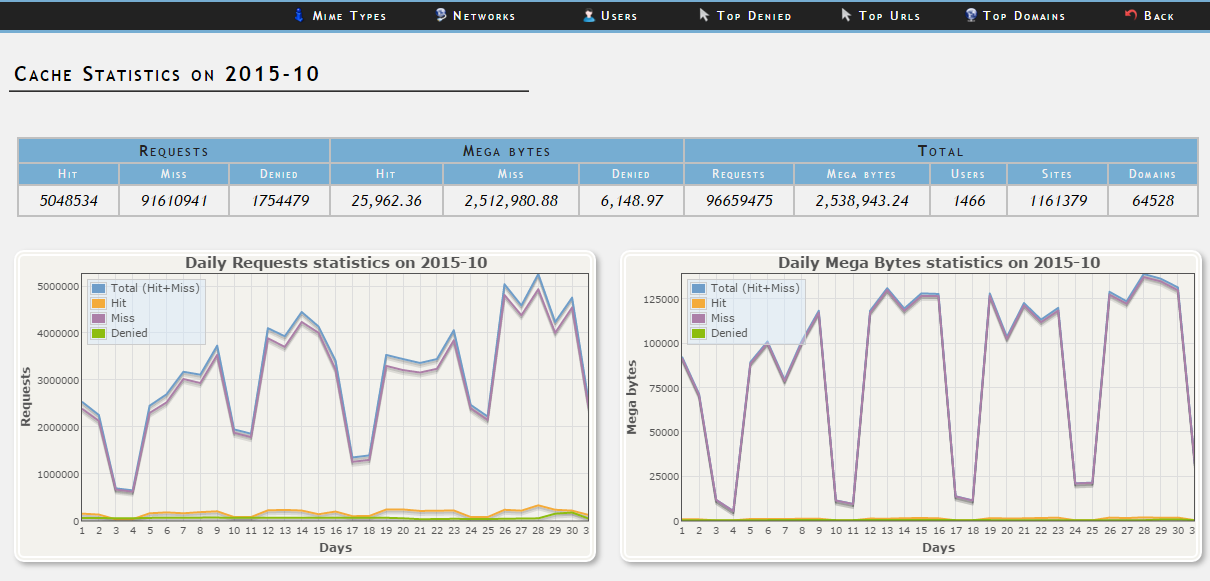
При выборе любого периода (год, месяц, неделя, день) внешний вид веб-страниц будет схожим: сверху меню со следующими отчетами: MIME types, Networks, Users, Top Denied, Top URLs, Top Domains. Чуть ниже статистика прокси за выбранные период: Requests (Hit/Miss/Denied), Megabytes (Hit/Miss/Denied), Total (Requests/Megabytes/Users/Sites/Domains). Далее график по количеству запросов за период и по трафику.
В правом верхнем углу есть календарь. При выборе какого-нибудь месяца можно увидеть краткую статистику и график загрузки по дням:
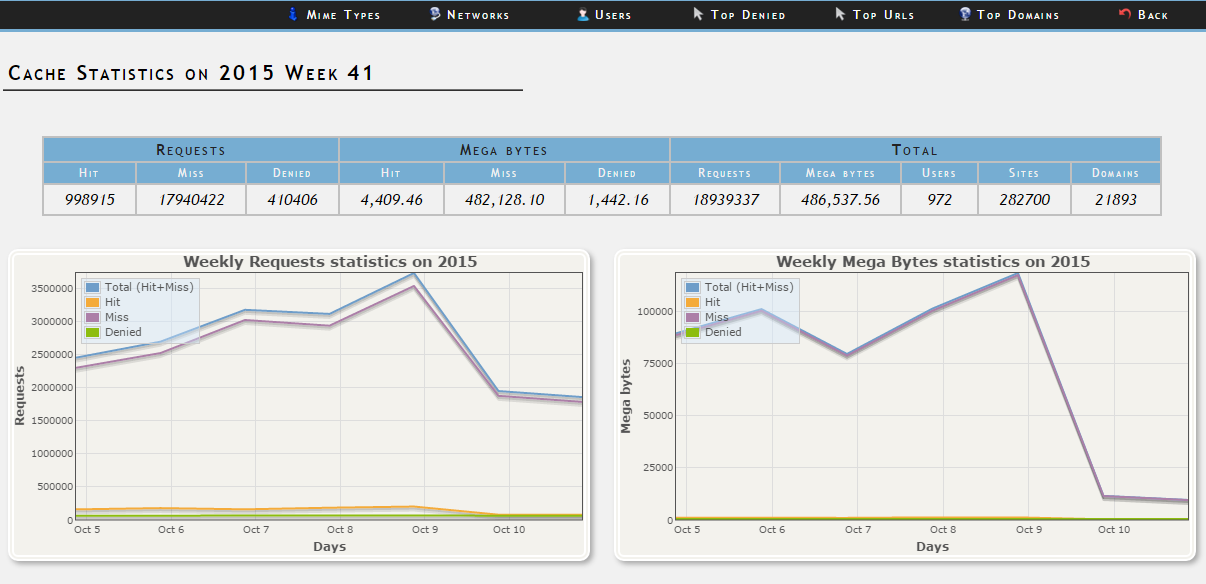
В календаре есть возможность выбора недели. При выборе увидим похожую статистику:
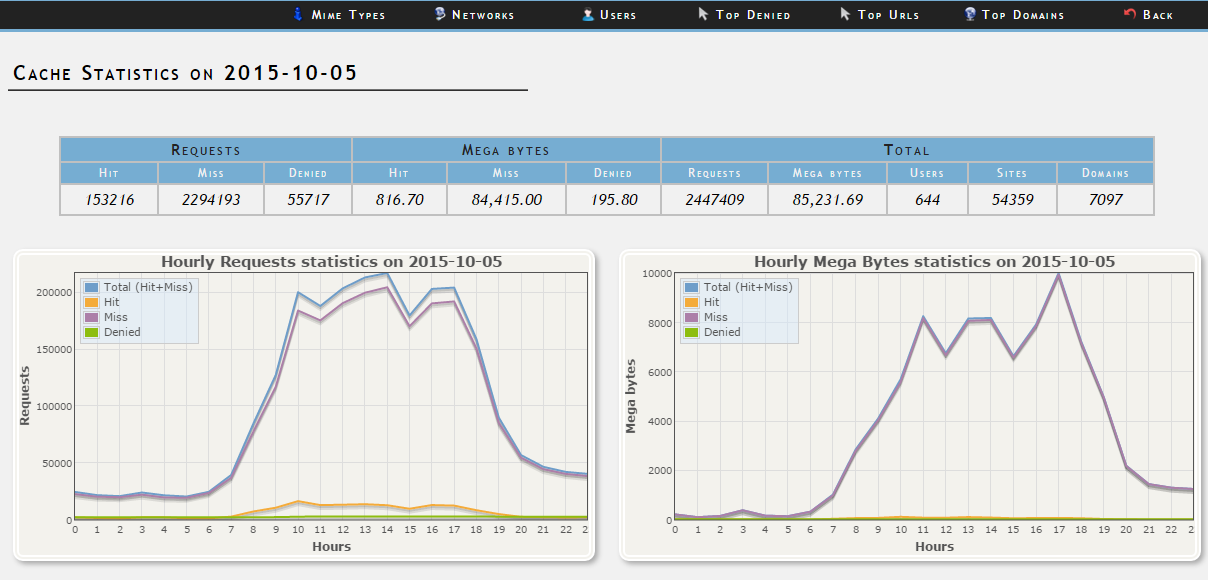
При выборе дня видим статистику по часам:
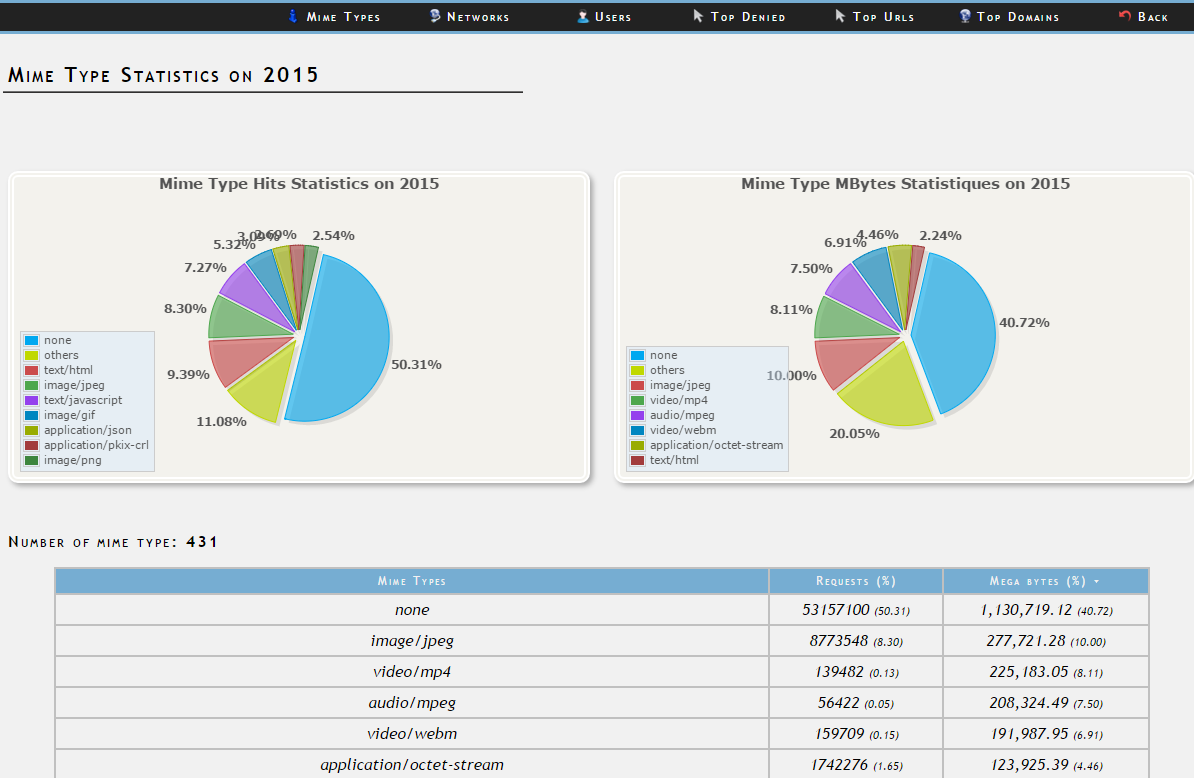
Отчет по типу контента:
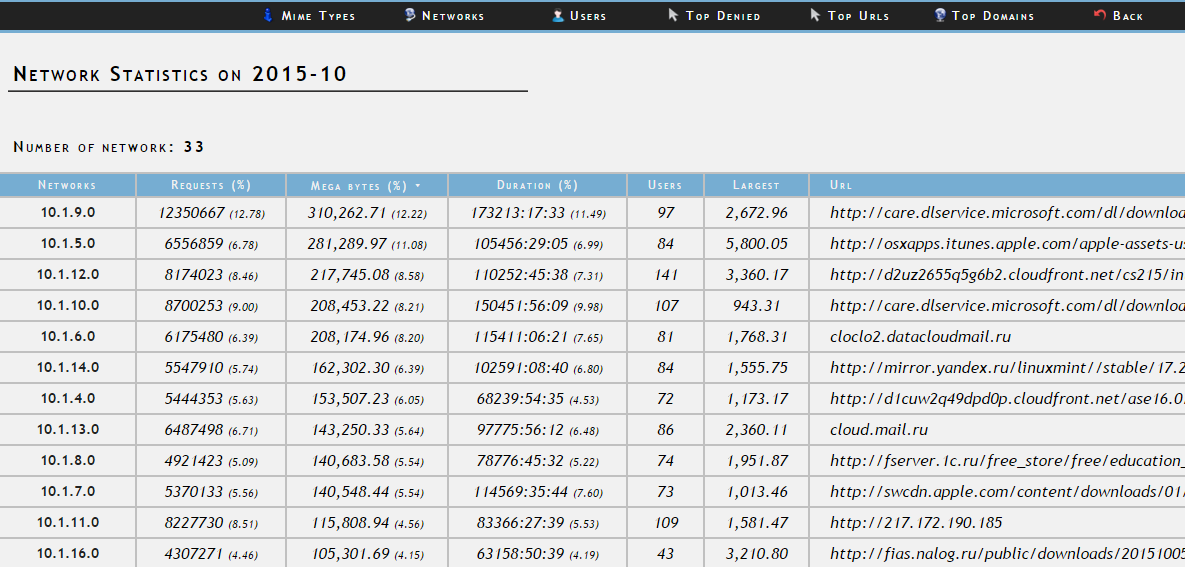
Отчет по сетям.
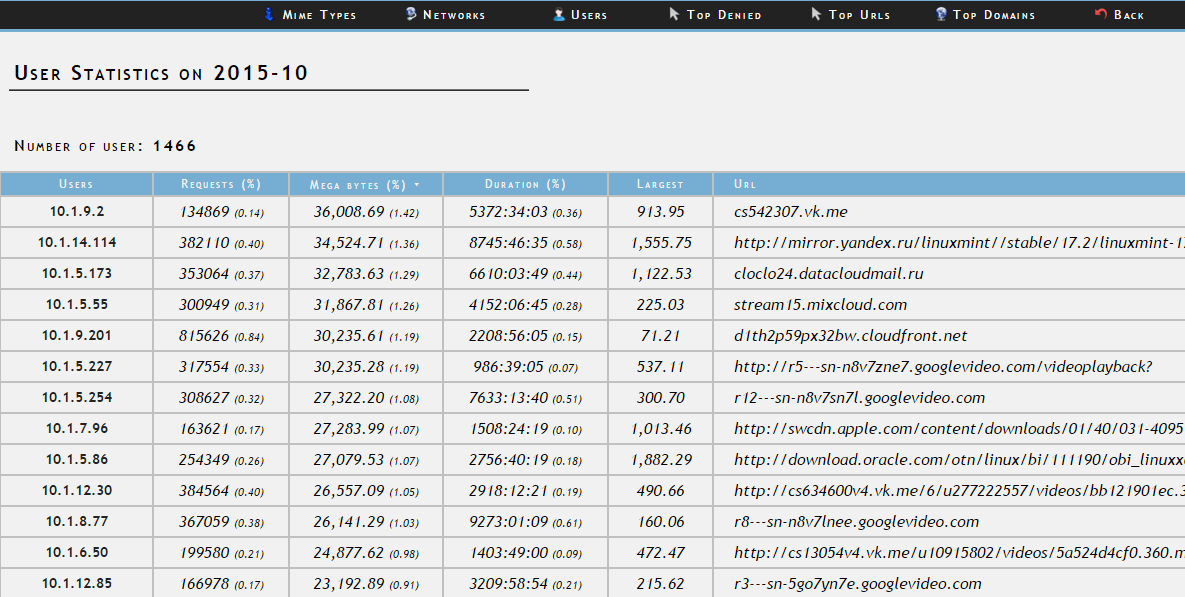
User Report.
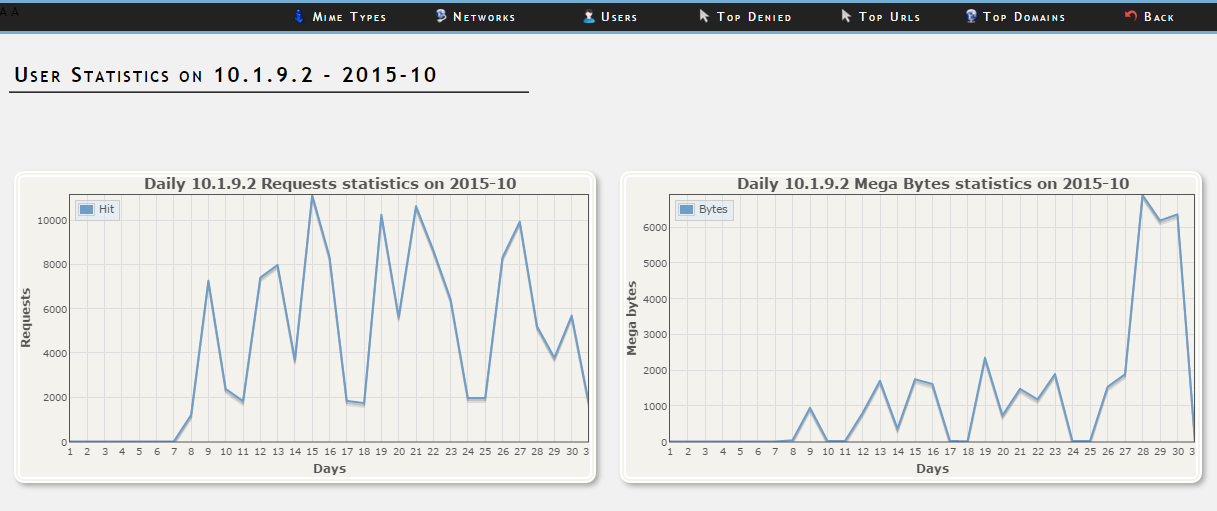
When choosing a user, we get his statistics for the period.
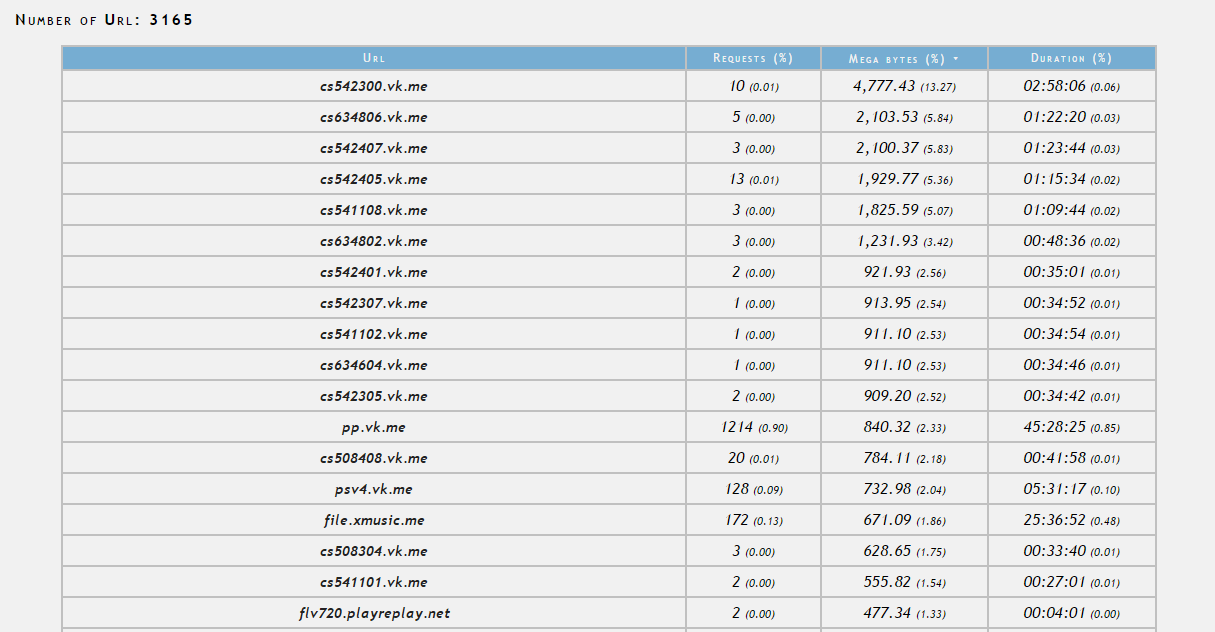
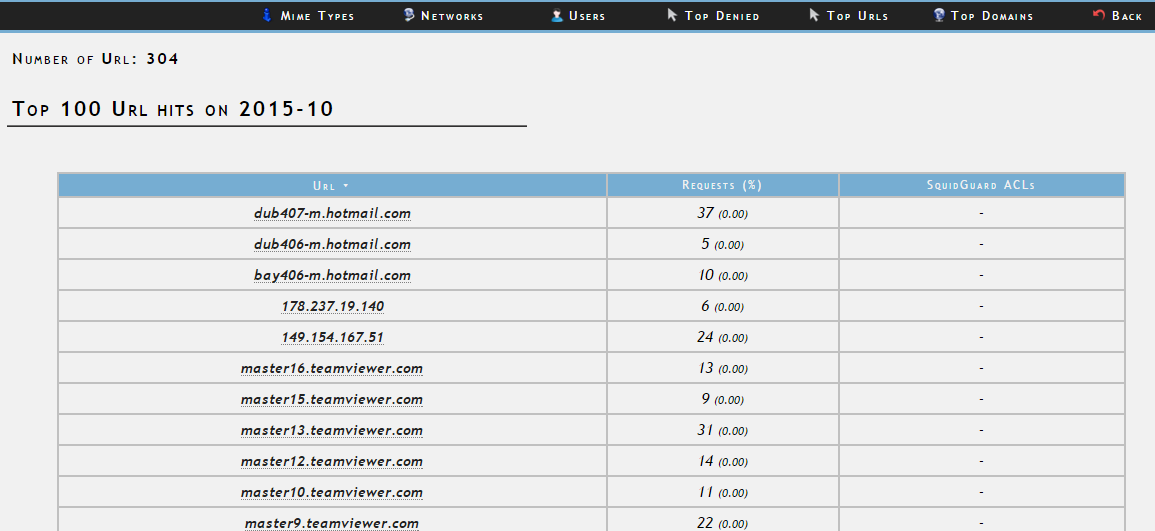
Prohibited Resources:
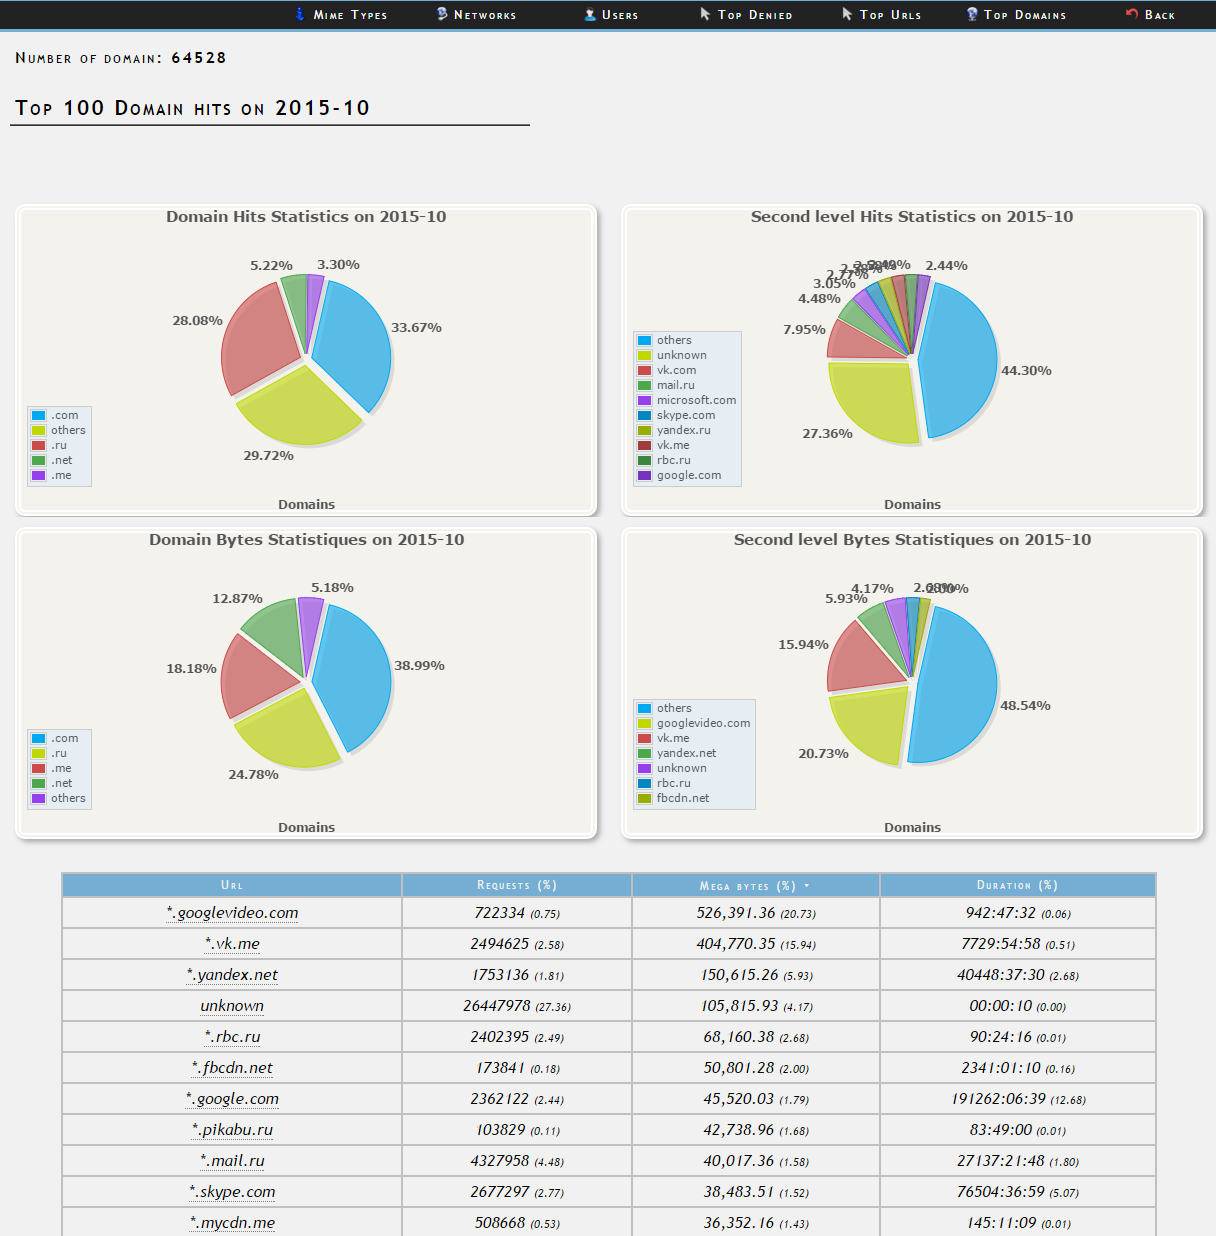
Report on Level 2 Domains.
On my own I would like to note the very slow work of the program as information accumulates. With each new log, statistics for the week, month and year are recounted. Therefore, I would not recommend this program for processing logs from a server with a lot of traffic.
При выборе любого периода (год, месяц, неделя, день) внешний вид веб-страниц будет схожим: сверху меню со следующими отчетами: MIME types, Networks, Users, Top Denied, Top URLs, Top Domains. Чуть ниже статистика прокси за выбранные период: Requests (Hit/Miss/Denied), Megabytes (Hit/Miss/Denied), Total (Requests/Megabytes/Users/Sites/Domains). Далее график по количеству запросов за период и по трафику.
В правом верхнем углу есть календарь. При выборе какого-нибудь месяца можно увидеть краткую статистику и график загрузки по дням:
В календаре есть возможность выбора недели. При выборе увидим похожую статистику:
При выборе дня видим статистику по часам:
Отчет по типу контента:
Отчет по сетям.
User Report.
When choosing a user, we get his statistics for the period.
Prohibited Resources:
Report on Level 2 Domains.
On my own I would like to note the very slow work of the program as information accumulates. With each new log, statistics for the week, month and year are recounted. Therefore, I would not recommend this program for processing logs from a server with a lot of traffic.
ScreenSquid
This program has a different logic: the log is imported into the MySQL database, then the data is requested from it when working in the web interface. The base with the processed ten-day log mentioned earlier takes 1.5 GB.
More details
Программа не может импортировать файлы логов с произвольным именем, привязка только к access.log.
Главная страница:

Краткая статистика:

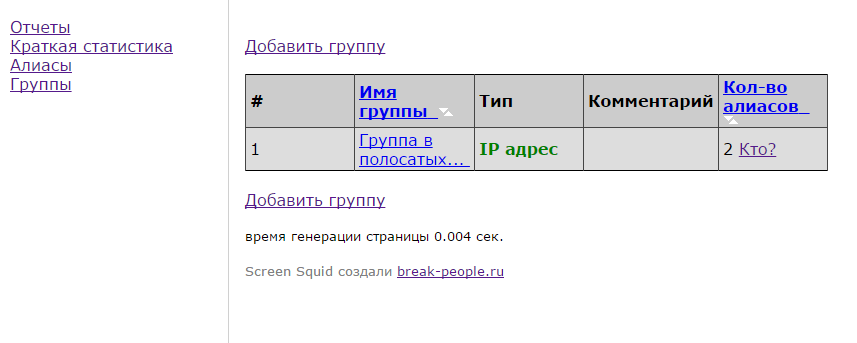
Для IP-адресов можно создать псевдонимы:
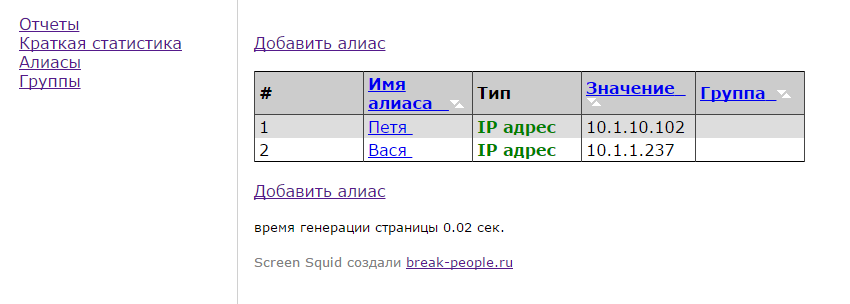
… а потом их можно объединить в группы:
Переходим к основному — отчетам.
Слева меню с типами отчетов:
Трафик пользователей логины
Трафик пользователей IP адреса
Трафик сайтов
Топ сайтов
Топ пользователей
Топ IP адресов
По времени суток
Трафик пользователей логины расширенный
Трафик пользователей IP адреса расширенный
Трафик IP адреса с резолвом
Популярные сайты
Кто качал большие файлы
Трафик по периодам (дни)
Traffic by periods (day name)
Traffic by periods (months)
HTTP statuses
IP addresses of logins
Logins from IP addresses
Sample reports.
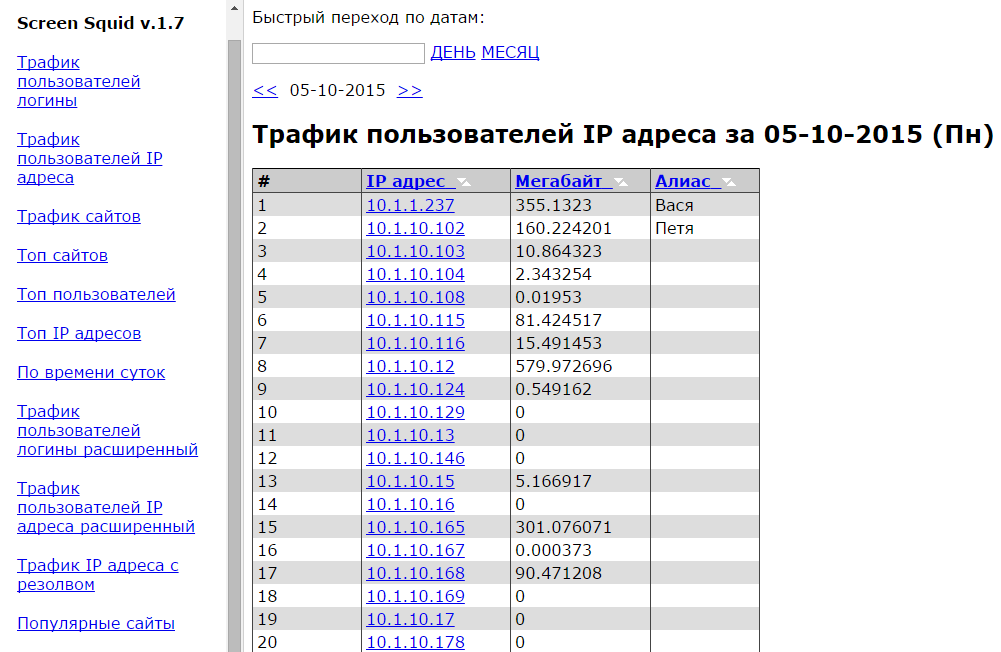
User traffic IP addresses:
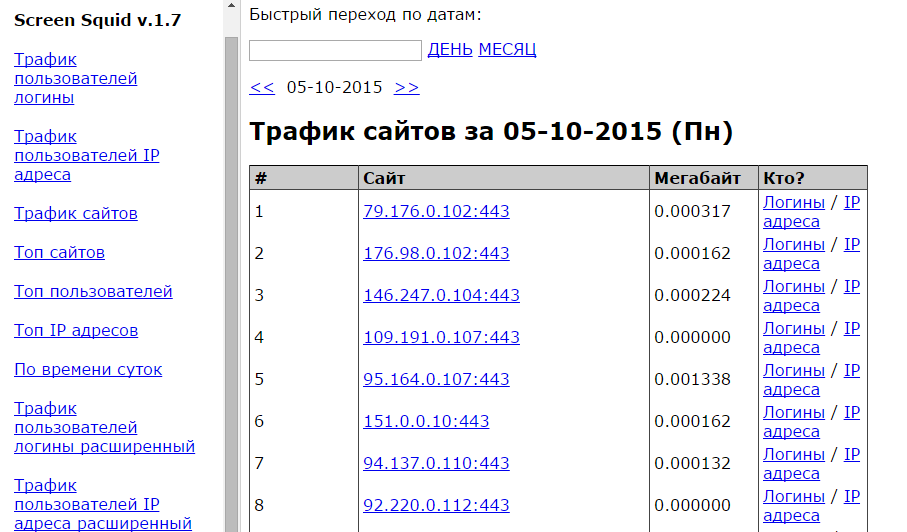
Website traffic:
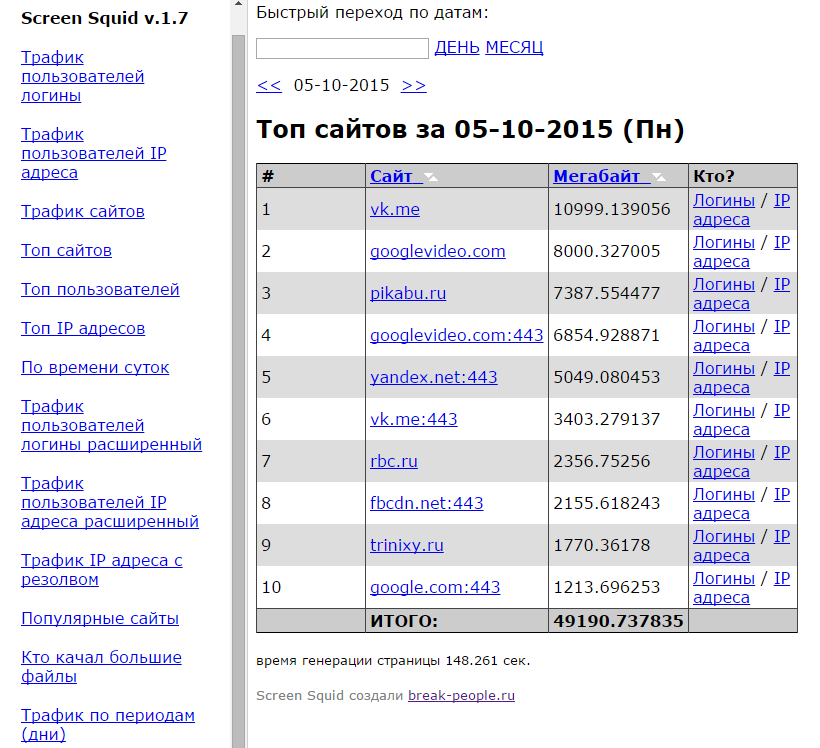
Top sites:
... further, to be honest, I didn’t have the patience to study the possibilities, since the pages began to be generated for 3-5 minutes. The report "by time of day" for the day, the log for which was not imported at all, was created for more than 30 seconds. For a day with traffic - 4 minutes:

Главная страница:
Краткая статистика:
Для IP-адресов можно создать псевдонимы:
… а потом их можно объединить в группы:
Переходим к основному — отчетам.
Слева меню с типами отчетов:
Трафик пользователей логины
Трафик пользователей IP адреса
Трафик сайтов
Топ сайтов
Топ пользователей
Топ IP адресов
По времени суток
Трафик пользователей логины расширенный
Трафик пользователей IP адреса расширенный
Трафик IP адреса с резолвом
Популярные сайты
Кто качал большие файлы
Трафик по периодам (дни)
Traffic by periods (day name)
Traffic by periods (months)
HTTP statuses
IP addresses of logins
Logins from IP addresses
Sample reports.
User traffic IP addresses:
Website traffic:
Top sites:
... further, to be honest, I didn’t have the patience to study the possibilities, since the pages began to be generated for 3-5 minutes. The report "by time of day" for the day, the log for which was not imported at all, was created for more than 30 seconds. For a day with traffic - 4 minutes:
That's all. I hope this material is useful to someone. Thank you all for your attention.