Guide to Power Bi: Getting Started
- Tutorial
Microsoft Power BI is a collection of software services, applications, and connectors that interact with each other to turn disparate data sources into consistent, visually immersive, and interactive analytical information. Today we share with you the initial guide to this free tool. From the manual you will learn the following:

Whether your data is presented using a simple Microsoft Excel book or a collection of cloud and local hybrid data warehouses, Power BI makes it easy to connect to data sources, visualize (or identify) important aspects and share the results with everyone who needs it.

Power BI can work simply and quickly, creating a brief analytical information based on an Excel workbook or a local database. However, Power BI is also a reliable enterprise-level product that is suitable not only for large-scale real-time modeling, but also for developing individual solutions. Thus, it can act as your personal visualization and reporting tool, as well as serve as a subsystem of analytics and decision making for group projects, departments or entire organizations.
If you are just starting to get acquainted with Power BI, this module will help you get started. If you are already an experienced Power BI user, then this module will help to establish relationships between basic concepts and eliminate existing gaps in knowledge.
Power BI consists of the classic Microsoft Windows application — Power BI Desktop, a SaaS web service (software as a service) called the Power BI service, and Power BI mobile apps available on Windows smartphones and tablets, as well as on Apple iOS devices and Google Android.
These three elements (Desktop, Service, and Mobile Applications) allow people to create, use, and analyze analytical business information most effectively in terms of personal or business tasks.
The approach to using Power BI may depend on your role in the project or in a workgroup. Other people in other positions may use Power BI differently, and there is nothing to worry about.
For example, you can view reports and dashboards in the Power BI service, and perhaps this will limit your use of Power BI. And your colleague who processes numeric data and compiles business reports can actively use Power BI Desktop (and publish reports to Power BI, which you then view). Another colleague from the sales department may prefer the Power BI application for the phone, tracking the progress of his sales plan and studying new data on potential customers.
You can also use each of the Power BI elements at different times, depending on your goals and your role in the project or your efforts.
For example, you can view inventory and progress information using a real-time dashboard in a service, and you can also create statistical reports for your team on customer interaction in Power BI Desktop. The approach to using Power BI may depend on which component or which Power BI function is optimal in the current situation. In this case, you always have access to all components of Power BI, which makes this product so flexible and attractive.
Later we will take a closer look at each of these components: Desktop, service, and mobile applications. In subsequent blocks and modules, we will also create reports in Power BI Desktop, share them in the service and analyze them on your mobile device.
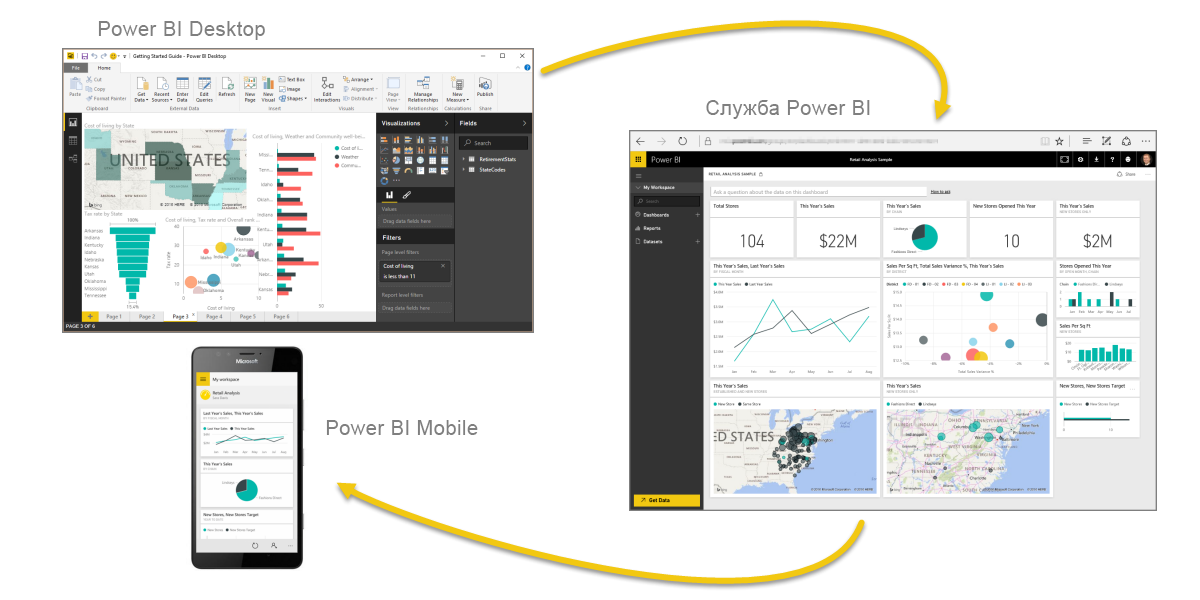
The overall workflow in Power BI begins with Power BI Desktop, where the report is generated. This report is then published in the Power BI service, after which users of Power BI Mobile mobile apps can work with this data.
Although this does not always happen in the manner described. But we will use just such an order to help you master the various components of Power BI and understand how they complement each other.
Now that you’ve got a general idea of the Power BI product and its three main elements in the module, let's take a look at how Power BI works.
Now that you know the basics of Microsoft Power BI, let's move on to practical knowledge and a step-by-step guide.
As you become familiar with the Power BI features, keep in mind that all of these actions and all the analysis in Power BI are usually performed in a common sequence. The general sequence of actions in Power BI is as follows:

As mentioned earlier, you can limit your use of the Power BI service to view visual items and reports that were created by other users. This is absolutely normal. Someone else on your team can spend all their time in Power BI Desktop, which is good too. We will present the full range of Power BI features to help you figure it out. Then you can decide how to use this tool most effectively.
So let's start to learn all this in practice. Companies first need to learn about the basic building blocks of Power BI, which will serve as the basis for studying the process of converting data into reports and visual elements in Power BI.
The following parts are available on our Microsoft learn site :
- How Power BI services and applications work together.
- How to improve business performance with PowerApps.
- How to create impressive visuals and reports.
Introduction
Whether your data is presented using a simple Microsoft Excel book or a collection of cloud and local hybrid data warehouses, Power BI makes it easy to connect to data sources, visualize (or identify) important aspects and share the results with everyone who needs it.
Power BI can work simply and quickly, creating a brief analytical information based on an Excel workbook or a local database. However, Power BI is also a reliable enterprise-level product that is suitable not only for large-scale real-time modeling, but also for developing individual solutions. Thus, it can act as your personal visualization and reporting tool, as well as serve as a subsystem of analytics and decision making for group projects, departments or entire organizations.
If you are just starting to get acquainted with Power BI, this module will help you get started. If you are already an experienced Power BI user, then this module will help to establish relationships between basic concepts and eliminate existing gaps in knowledge.
Power BI components
Power BI consists of the classic Microsoft Windows application — Power BI Desktop, a SaaS web service (software as a service) called the Power BI service, and Power BI mobile apps available on Windows smartphones and tablets, as well as on Apple iOS devices and Google Android.
These three elements (Desktop, Service, and Mobile Applications) allow people to create, use, and analyze analytical business information most effectively in terms of personal or business tasks.
Interconnecting Power BI with your role
The approach to using Power BI may depend on your role in the project or in a workgroup. Other people in other positions may use Power BI differently, and there is nothing to worry about.
For example, you can view reports and dashboards in the Power BI service, and perhaps this will limit your use of Power BI. And your colleague who processes numeric data and compiles business reports can actively use Power BI Desktop (and publish reports to Power BI, which you then view). Another colleague from the sales department may prefer the Power BI application for the phone, tracking the progress of his sales plan and studying new data on potential customers.
You can also use each of the Power BI elements at different times, depending on your goals and your role in the project or your efforts.
For example, you can view inventory and progress information using a real-time dashboard in a service, and you can also create statistical reports for your team on customer interaction in Power BI Desktop. The approach to using Power BI may depend on which component or which Power BI function is optimal in the current situation. In this case, you always have access to all components of Power BI, which makes this product so flexible and attractive.
Later we will take a closer look at each of these components: Desktop, service, and mobile applications. In subsequent blocks and modules, we will also create reports in Power BI Desktop, share them in the service and analyze them on your mobile device.
The sequence of work in Power BI
The overall workflow in Power BI begins with Power BI Desktop, where the report is generated. This report is then published in the Power BI service, after which users of Power BI Mobile mobile apps can work with this data.
Although this does not always happen in the manner described. But we will use just such an order to help you master the various components of Power BI and understand how they complement each other.
Now that you’ve got a general idea of the Power BI product and its three main elements in the module, let's take a look at how Power BI works.
Using Power BI
Now that you know the basics of Microsoft Power BI, let's move on to practical knowledge and a step-by-step guide.
As you become familiar with the Power BI features, keep in mind that all of these actions and all the analysis in Power BI are usually performed in a common sequence. The general sequence of actions in Power BI is as follows:
- transfer data to Power BI Desktop and create a report;
- Publish to Power BI, where you can create visualizations or dashboards
- sharing information panels with other users, especially those who are on the road;
- View and interact with common dashboards and reports in Power BI Mobile applications.
As mentioned earlier, you can limit your use of the Power BI service to view visual items and reports that were created by other users. This is absolutely normal. Someone else on your team can spend all their time in Power BI Desktop, which is good too. We will present the full range of Power BI features to help you figure it out. Then you can decide how to use this tool most effectively.
So let's start to learn all this in practice. Companies first need to learn about the basic building blocks of Power BI, which will serve as the basis for studying the process of converting data into reports and visual elements in Power BI.
The following parts are available on our Microsoft learn site :
- Power Bi building blocks
- General information about the Power Bi service and its use
- Results
- Knowledge check