10 tricks for advanced dashboarding in Splunk. Part 2

Good day!
Today we continue to share the secrets of advanced dashboards in Splunk. In this article, we will examine several cases of using JavaScript in order to make dashboards more convenient, readable and interactive. Read the details under the cut.
In the previous article, we sorted out the first 5 tricks and with simple examples we looked at how to adjust the dynamics on the dashboard without using js, how to find and add different templates and styles. Today we continue this story.
Before starting, I want to note that to debug scripts and in general in the process of creating complex dashboards, you should set up the developer mode by turning off caching and setting up an easy reboot. We also wrote about how to do this in the previous article .
6. Table tooltips
What if we have long values in certain fields? Of course, we would like to read them if necessary, but it is not necessary to constantly see them. To do this, we will do the following: we will shorten the message and set up the prompts as a whole message when you hover the cursor.


A ready-made code template for tooltips can be found on the resource Bootstrap , which we talked about earlier .
To apply the scripts on the dashboard, you need to place them in the directory ... / Splunk / etc / apps / dashboard_tips / appserver / static
And then specify the necessary css and js files in the XML code of the dashboard.

<formstylesheet="tooltip.css"script="tooltip.js">For this task, you will need a very simple CSS-code, which will specify the parameters of the message display.
.tooltip-inner {
    max-width: 800px;
    text-align: left;
    font-size: 14px;
    font-weight: normal;
}
And a JS-script in which it is indicated that if the size of the message is more than 48 characters, then we shorten the message and add a hint with the text of this message. You also need to specify to which table we want to apply the script. To do this, in the tag that defines the table, specify the ID, which is then referenced in the mvc.Components.get () function.
<tableid="tblTooltip">require([
'underscore',
'jquery',
'splunkjs/mvc',
'splunkjs/mvc/tableview',
'splunkjs/mvc/simplexml/ready!'
], function(_, $, mvc, TableView) {
var CustomTooltipRenderer = TableView.BaseCellRenderer.extend({
canRender: function(cell) {
return cell.field === 'Message';
},
render: function($td, cell) {
var message = cell.value;
var tip = cell.value;
if(message.length > 48) { message = message.substring(0,47) + "..." }
$td.html(_.template('<a href="#" data-toggle="tooltip" data-container="body" data-placement="top" title="<%- tip%>"><%- message%></a>', {
tip: tip,
message: message
}));
// This line wires up the Bootstrap tooltip to the cell markup
$td.children('[data-toggle="tooltip"]').tooltip();
}
});
mvc.Components.get('tblTooltip').getVisualization(function(tableView) {
// Register custom cell renderer
tableView.table.addCellRenderer(new CustomTooltipRenderer());
// Force the table to re-render
tableView.table.render();
});
});7. Conversion tables
Not always tables that are formed automatically by the splinter look good on dashboards. Sometimes you want to take data from the table and present it in a completely different form.
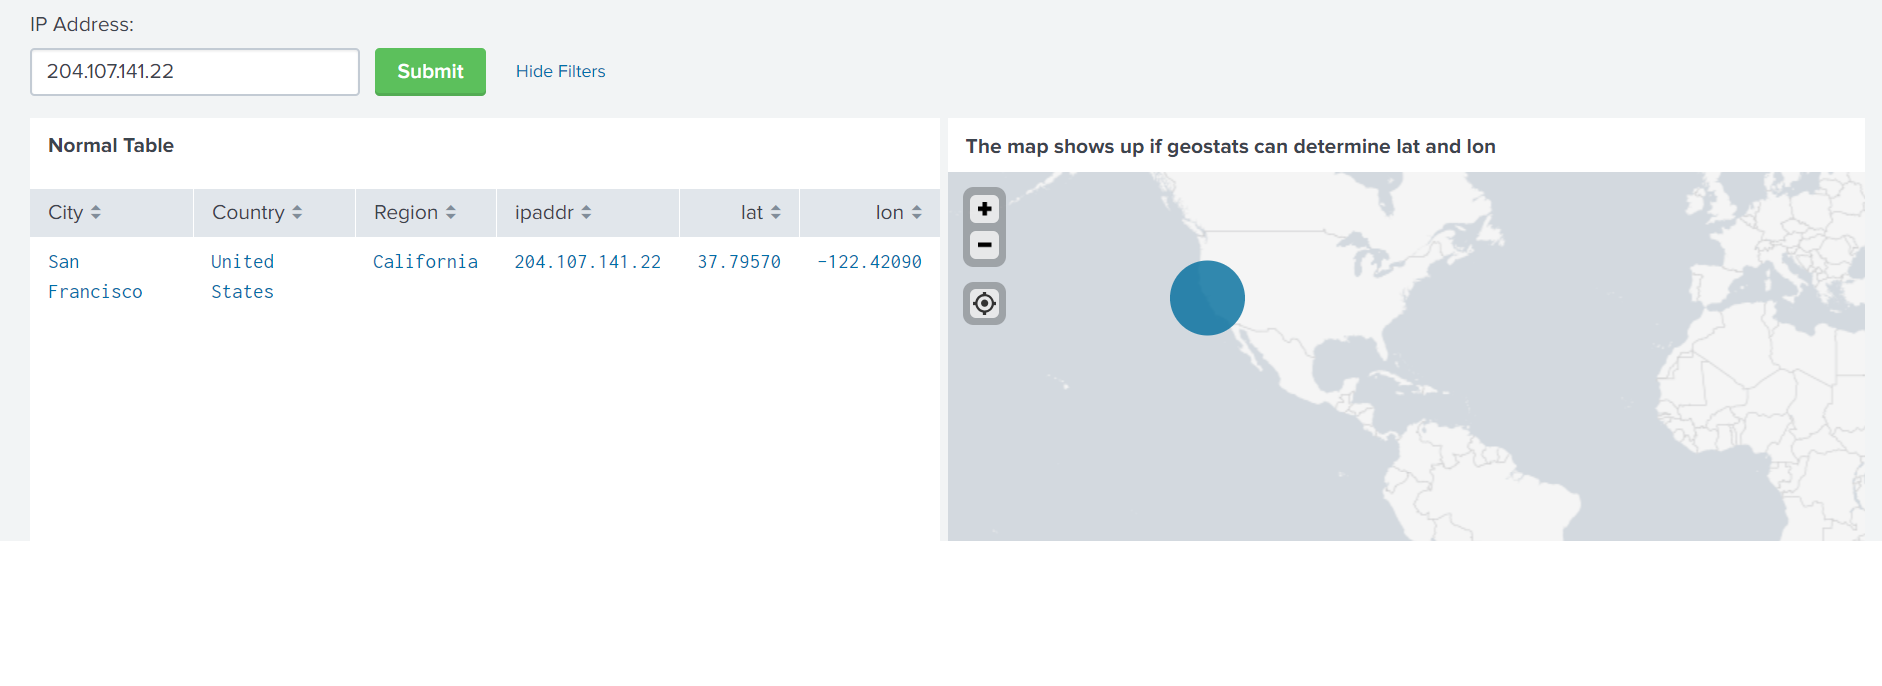
In the presented example, we will always have one line of the table and a fairly large map. The most obvious conversion option is to transpose the table. Of course, you can use the command | transpose , but now it's not about that, but about how to convert the data from the table through JS. By working further with CSS, you can do some really amazing things.
Let's see how to get such a table:
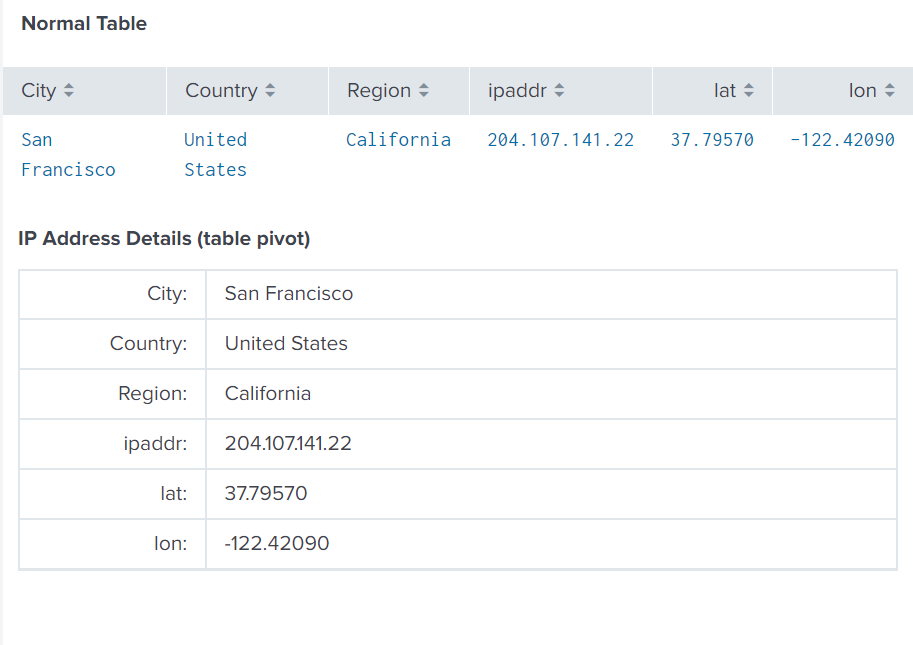
First, we need to add an ID to the query that interests us, which we will refer to in the JS script.
<searchid="map_search">Also in the XML dashboard code you need to refer to the .js file, which should be located in the directory ... / Splunk / etc / apps / dashboard_tips / appserver / static
<formscript="table2list.js">And of course, you need to bind to this script in the dashboard. To do this, inside the html tags, create a div object with the ID list-view, which will also be referenced in the script.
<html><h3class="dashboard-element-title">IP Address Details (table pivot)</h3><divid="list-view"/></html>The text of the script with which we convert the data:
require([
    'underscore',
    'jquery',
    'splunkjs/mvc',
    'splunkjs/mvc/dataview',
    'splunkjs/mvc/simplexml/ready!'
], function(_, $, mvc, DataView) {
	var templateString = "\
<%\
for(var i=0, l=results.length; i<l; i++) { \
	var line=results[i]; %> \
	<table id='list-view-template' class='table table-bordered'><tbody> \
	\
	<% for(var key in line) {\
		var attrName = key;\
		var attrValue = line[key];\
		%> \
		<tr>\
			<td width='100px' style='text-align: right'><%= attrName %>:</td>\
			<td><%= attrValue %></td>\
		</tr>\
	<% } %> \
    \
	</tbody></table> \
<% }%> \
";
	var dtview = newDataView({
		id: "dtview",
		managerid: "map_search",
		template: templateString,
		el: $("#list-view")
	}).render();
});
!!! When making changes to the dashboards, periodically the table disappears and you need to refresh the page to return it.
8. Interactive content change dashboard
In this section, we will discuss how you can make changes to dashboards not using tokens, but using code. This begs the question - why? With the help of the code it is possible to arrange it more flexibly and visually more interesting, and this does not require large and complex code, everything is extremely simple.
In our example, we want to customize the appearance of the table by clicking on the icon.
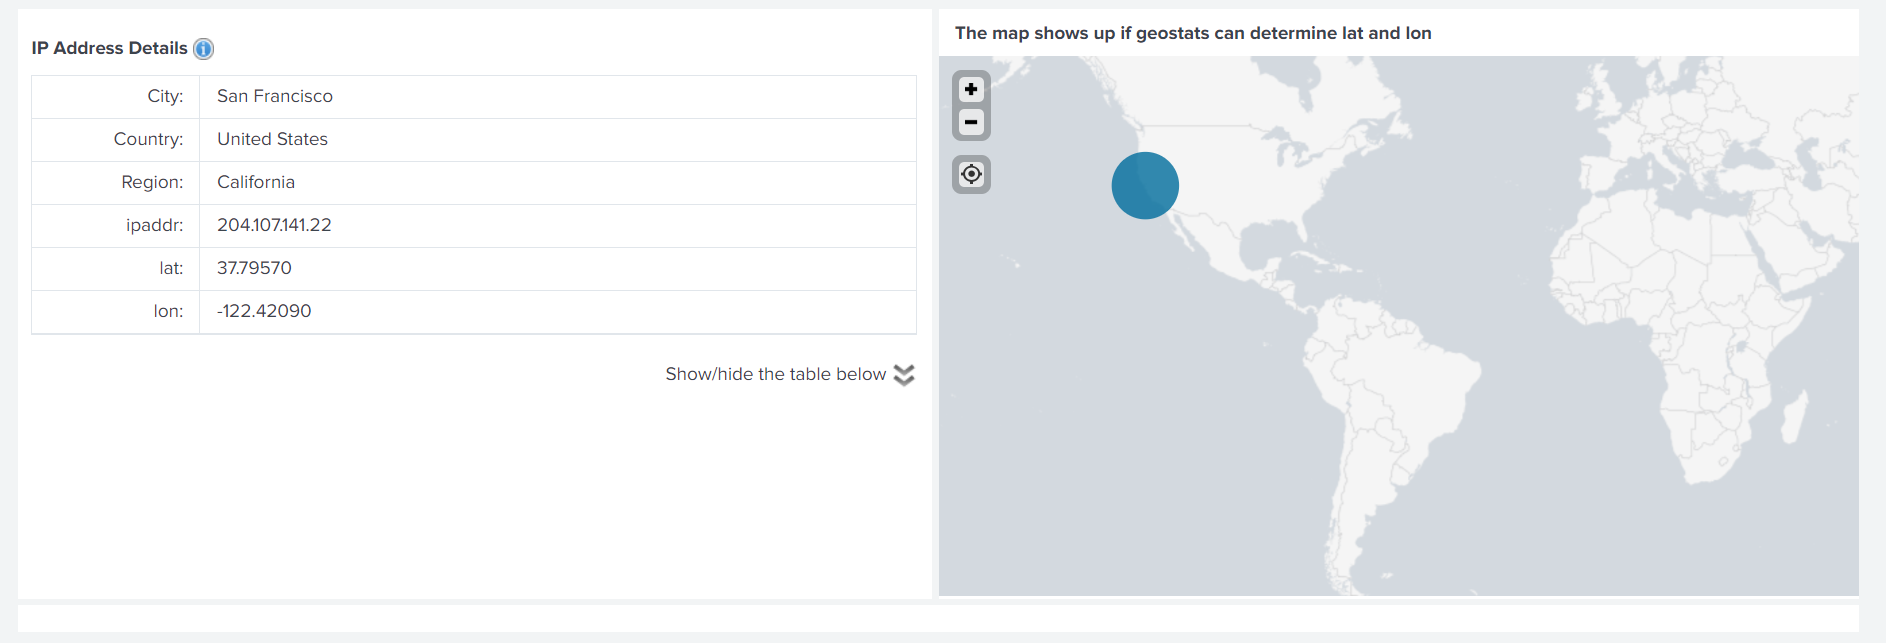
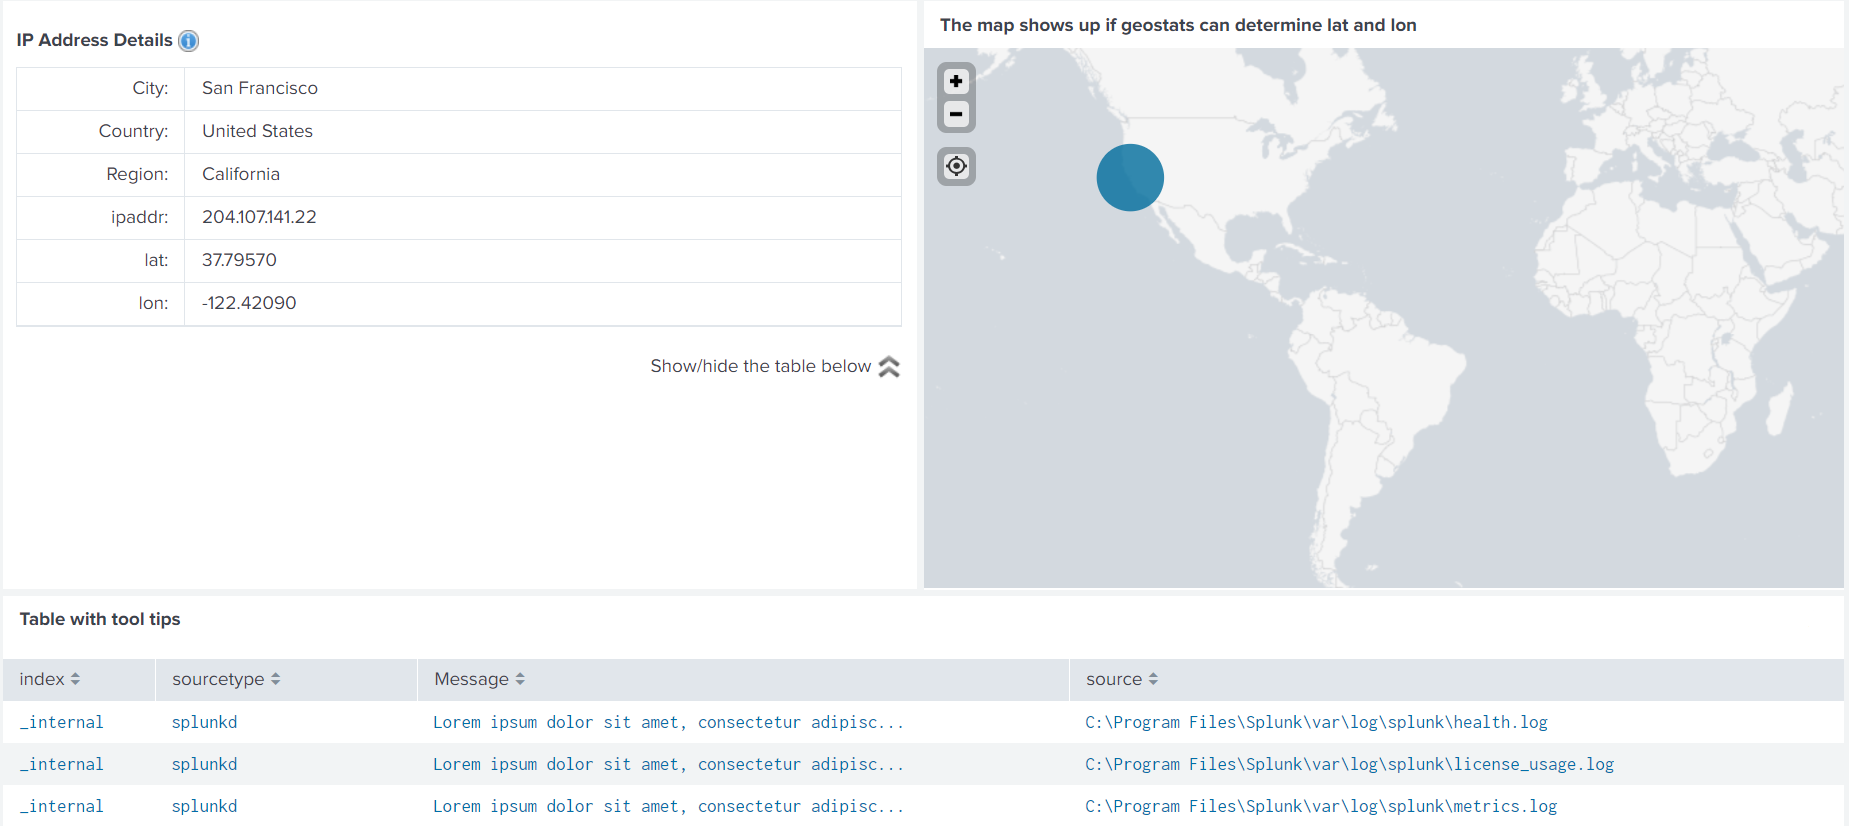
Note that in the dashboard shown in the pictures, quite a few scripts are already used, which we reviewed above.
It is not necessary to save all this in one CSS or JS code, you can leave it separate and specify them all separated by commas.
<formscript="table2list.js, toggle.js, tooltip.js"stylesheet="toggle.css, tooltip.css">If we use the icon, image, etc., then they should also be stored in the directory ... / Splunk / etc / apps / dashboard_tips / appserver / static
In order to configure this table that appears, we need:
HTML in the dashboard code:
<html><divstyle="float: right">
		      Show/hide the table below  <imgid="imgToggle1"class="toggle"title="Show/hide table below"src="/static/app/dashboard_tips/expand.png"/></div></html>
CSS - toggle.css
#tooltip_row {
    /*visibility: hidden;*/height: 0px;
    overflow: hidden;
}
JS - toggle.js
require.config({
    paths: {
        "app": "../app"
    }
});
require(['splunkjs/mvc/simplexml/ready!'], function(){
    require(['splunkjs/ready!'], function(){
		functiontoggle(button, target) {
			if(target.css("height") == "0px" ) {
				button.attr("src", "/static/app/dashboard_tips/collapse.png");
				target.css({
					"height": "auto"
				});
			}
			else
			{
				button.attr("src", "/static/app/dashboard_tips/expand.png");
				target.css({
					"height": "0px"
				});
			}
		}
		// Setup the click handlers for the toggle buttons
		$("#imgToggle1").click(function(){
			toggle($(this), $("#tooltip_row"));
		});
    });
});
Then we add tooltip_row to the dashboard code in front of the panel with the table we need.
<rowid="tooltip_row"><panel>
     таблица
    </panel></row>
8. Masks on Inputs

Using JavaScript, you can easily impose restrictions or custom rules on the inputs in dashboards. For example, in order to enter only an integer or date was selected from the calendar and so on.
For this, for each desired input, set the ID, which will be referenced in JS.
<inputtype="text"token="numbers"id="numbers_only"searchWhenChanged="true"><label>Numbers only</label><default>1</default></input><inputtype="text"token="numbers_0_100"id="numbers_0_100_step10"searchWhenChanged="true"><label>Numbers 0-100 step=10</label><default>0</default></input><inputtype="text"token="date"id="date"searchWhenChanged="true"><label>Date</label></input><inputtype="text"token="date_restrictions"id="date_restrictions"searchWhenChanged="true"><label>Date after 2018-08-01</label></input><inputtype="text"token="range"id="range"searchWhenChanged="true"><label>Range (0-10)</label><default>5</default></input>And add input rules for input in JS
require(["jquery", "splunkjs/mvc/simplexml/ready!"], function($) {
	$("[id^=numbers_only]")
		.find("input")
		.attr('type','number')
	$("[id^=numbers_0_100_step10]")
		.find("input")
		.attr('type','number')
		.attr('min','0')
		.attr('max','100')
		.attr('step','10')
	$("[id^=date]")
		.find("input")
		.attr('type','date')
	$("[id^=date_restrictions]")
		.find("input")
		.attr('type','date')
		.attr('min','2018-08-02')
	$("[id^=range]")
		.find("input")
		.attr('type','range')
		.attr('min','0')
		.attr('max','10')
});
10. Popup window with chart
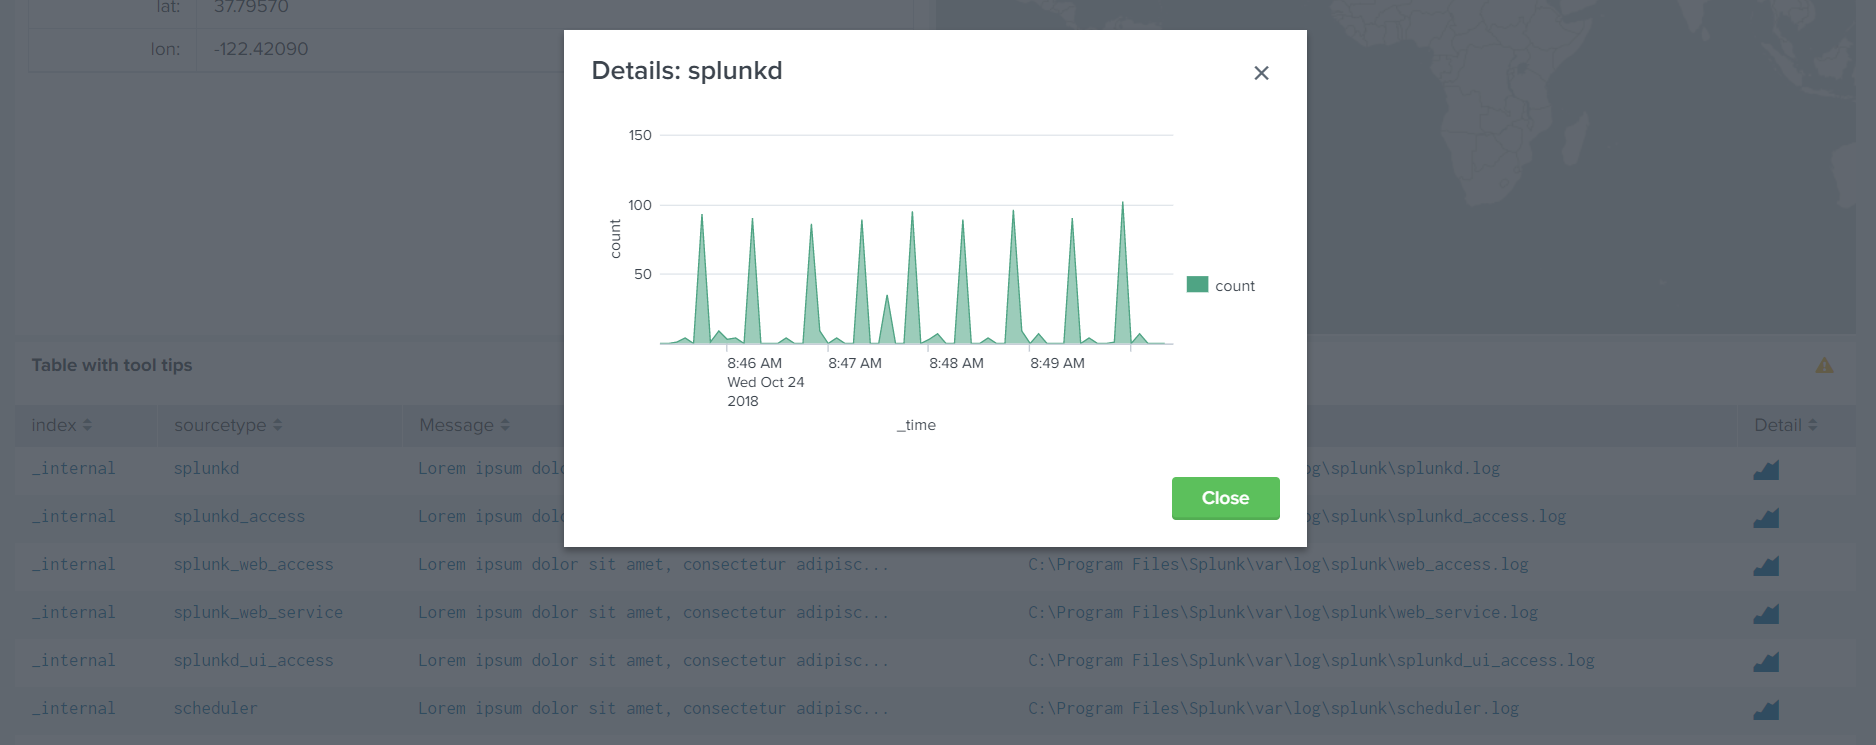
In this section we will analyze how to get such a pop-up window with a diagram that shows the number of events for a particular sourcetype, depending on which icon in the Detail field the user clicked.
To do this, you first need to create a query on which the chart will be based:
<searchid="chart_search"><query>
      index=_internal sourcetype=$chart_sourcetype$ | timechart count
    </query><earliest>rt-5m</earliest><latest>rtnow</latest></search>
The request depends on the token $ chart_sourcetype $, you need to add the assignment of the value to this token, and also configure the drilldown so that the values in the table are clickable. This is done in the "options" for the required table.
<optionname="drilldown">cell</option><drilldown><settoken="chart_sourcetype">$row.sourcetype$</set></drilldown>Then, using JS, we customize the icons in the Detail field and the chart view:
require([
    'underscore',
    'jquery',
    'splunkjs/mvc',
	'splunkjs/mvc/tableview',
	'splunkjs/mvc/chartview',
    'splunkjs/mvc/simplexml/ready!'
], function(_, $, mvc, TableView, ChartView) {
	var CustomIconRenderer = TableView.BaseCellRenderer.extend({
		canRender: function(cell) {
			return cell.field === 'Detail';
		},
		render: function($td, cell) {
			$td.html(('<i class="icon-chart-area" style="font-size:2em" />'));
		}
	});
	mvc.Components.get('tblTooltip').getVisualization(function(tableView) {
        // Register custom cell renderer
        tableView.table.addCellRenderer(new CustomIconRenderer());
        // Force the table to re-render
        tableView.table.render();
	});
	// Listen for token changesvar tokens = mvc.Components.get("default");
	tokens.on("change:chart_sourcetype", function(model, value, options) {
		$('#modalChart').modal();
		var areaChart = new ChartView({
			id: "chart-view",
			managerid: "chart_search",
			type: "area",
			"charting.chart.nullValueMode": "connect",
			el: $("#chartDetail")
		}).render();
	});
});
And we set up a pop-up window, just as we did in the previous article, only instead of the text we add a block with the identifier referenced by JS.
<divid="chartDetail"/><panel><html><!-- Modal Chart --><divclass="modal fade"id="modalChart"tabindex="-1"role="dialog"aria-labelledby="modalChartLabel"aria-hidden="true"><divclass="modal-dialog modal-lg"role="document"><divclass="modal-content"><divclass="modal-header"><h5class="modal-title"id="modalChartLabel">Details: $chart_sourcetype$</h5><buttontype="button"class="close"data-dismiss="modal"aria-label="Close"><spanaria-hidden="true"/></button></div><divclass="modal-body"><divid="chartDetail"/></div><divclass="modal-footer"><buttontype="button"class="btn btn-primary"data-dismiss="modal">Close</button></div></div></div></div></html></panel>Thus, for two articles, we have dismantled 10 interesting case studies on working with dashboards that go beyond basic user skills. But in general, all these stories are not so difficult to repeat and try to realize yourself.
To see all this closer and more clearly, you can download the application on GitHub , where you can find all the scripts, codes, click on dashboards and see how it all works.
You can also watch the video from the conference Splunk .conf18.
If you have not tried Splunk yet, then it's time to start, the free version up to 500MB per day is available to everyone. And if you have questions or problems with Splunk - you can ask them to us , and we will help.
We are the official Premier Splunk Partner .

