Built for ages: understanding earthquake-resistant construction
- Transfer
Translation of Yu-Sung Chang's post " Built to Last: Understanding Earthquake Engineering ".
The code given in the article (with all the mathematical models used) can be downloaded here .
I express my deep gratitude to Kirill Guzenko for help with the translation.
Last week, the world was shocked by the news of major earthquakes and devastating tsunamis in Japan. Events are still unfolding and may become one of the most tragic natural disasters in recent history.
Scientific understanding and modeling of complex physical phenomena and development based on this analysis are essential to prevent victims of natural disasters. In this post, we explore earthquakes from a scientific point of view in order to understand why they occur and how to better prepare for them.
Note : The dynamic examples in this post were created using Mathematica . Download a format file (CDF) for interacting with models and further exploring the topic.
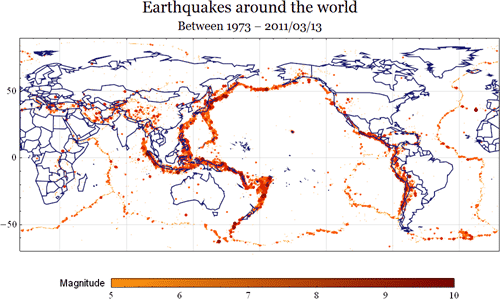
First, let's start with the locations. The following visualization is based on the US Geological Survey (USGS) earthquake database, which occurred between 1973 and early 2011, with magnitudes greater than 5. As you can see, the epicenters are concentrated in narrow areas, usually at the boundaries of tectonic plates. In particular, there is serious seismic activity around the Pacific Ocean, namely in the Ring of Fire. It so happened that Japan is located right in the middle of this very active area.
Earthquakes often form at the boundaries of tectonic plates, forming huge faults on the surface. When sufficiently large forces are applied in two different directions, they can overcome the rest friction force between the plate boundaries and cause a sudden movement. The phenomenon, also known as shear, is one of the many mechanisms that cause earthquakes. The following animation models the shear fault and the seismic waves caused by it.
The magnitude of an earthquake is measured by the amount of energy released during seismic activity. The magnitude scale is logarithmic. The following diagram shows the relationship between magnitude and energy released for the several earthquakes mentioned above.
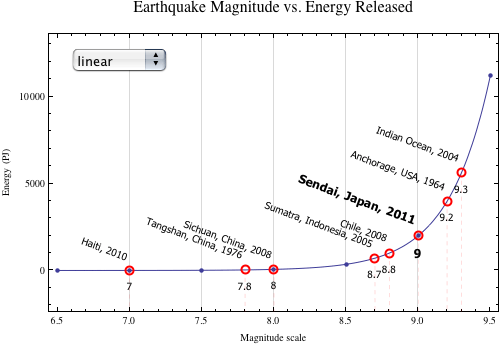
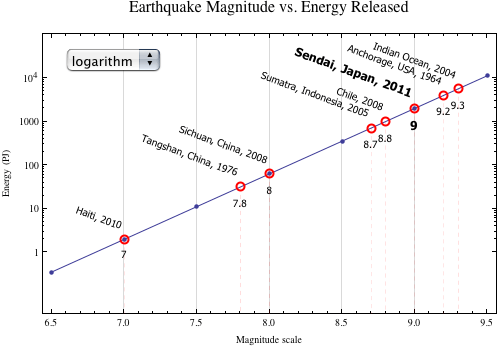
PJ or petajoule for many, perhaps, is not the most common form of determining the amount of energy. We can use Wolfram | Alpha to convert this value into more familiar measures, such as megatons of TNT explosive. The Sendai earthquake had a magnitude of 9, and the energy released was approximately 2,000 petajoules:

Purely, the most powerful atomic bomb ever tested is the 58 megaton Tsar bomb . We are talking about an earthquake with a magnitude in which more energy is released than when the most powerful atomic bomb explodes.
The magnitude scale has a logarithmic scale with a base of 10. For example, the difference in the released earthquake energies in Sendai (magnitude 9) and in Haiti in 2010 (magnitude 7):
Thus, the energy released during the Sendai earthquake turned out to be 1000 times larger than in Haiti.
How is the energy of earthquakes distributed? Most of the energy is converted into heat generated by friction, but part is spent on the creation of seismic waves. There are two types of seismic waves: bulk and surface.
Body waves travel through the earth, and they can be divided along the directions of oscillations during propagation. In P-waves, particle vibrations occur in the same direction in which the wave propagates - as in sound waves. In S-waves, particles oscillate perpendicular to the direction of wave propagation.
Surface waves travel only through the crust or surface of the Earth. However, they cause great damage due to a number of their properties. Again, two types can be distinguished in surface waves — Love and Rayleigh waves .
Love waves generate motions similar to S-waves, but in a horizontal plane. These horizontal movements are especially dangerous for the foundations of buildings.
Rayleigh waves propagate like waves on a water surface. During propagation, particles move along elliptical trajectories. Sometimes called earth waves, Rayleigh waves have a low frequency (less than 20 Hz) and usually people, unlike many other animals, do not feel them.
Understanding seismic waves is important to reduce or prevent structural damage to buildings during earthquakes. So the question is - what can be done about it?
If some external forces are applied to the building, it will begin to swing.
Structural dynamics is very complex and depends on a large number of parameters. However, as an example, I used the simple equation of damped oscillations to simulate the effect on the building in the animations below (the gray base of the building represents the base of the building):
Oscillations disperse the energy of seismic waves. Through material selection, structural design, and a range of building techniques, engineers are trying to minimize the effects of earthquakes on buildings. One such example is the inertial damper — a device mounted on buildings to suppress harmonic resonance.
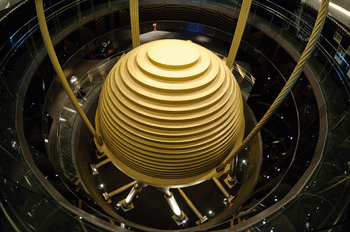
Inertial damper on display in Taipei 101. Photo provided by Armand du Plessis.
Another very relevant option today is the foundation (seismic) isolation. In an insulated shell, devices like a lead-rubber support are placed in the building foundation to isolate the building structure from vibration from earthquakes.
This method helps to significantly reduce structural stresses. It is also considered a good option for low buildings with high rigidity, or for upgrading existing structures. In fact, many historical sites in the US are already equipped with foundation insulation systems to reduce earthquake damage.
This post contains a downloadable CDF file . Most examples are dynamic and allow you to interact with models. You can use Mathematica or the free Wolfram CDF Player to explore the models in this article.
