Rapid reporting development in Java: downshifting with 1C: Enterprise
Greetings to dear readers.
As promised in the first article Fast CRUD development in Java: downshifting with "1C: Enterprise" , I continue the description of my OpenSource projects that implement similar functionality to 1C: Enterprise.
This time, it is SKD - a data composition system, and my development is FlexReporting ( link to GitHub ).
What is the essence of this mechanism? This is a kind of realtime - ROLAP tool, which on the fly transforms “flat” data into hierarchical reports.
In fact, there are many fans who argue that SKD is not an “OLAP”, but I would remind you that such a thing as aggregates that pre-calculate and store multidimensional data for all (or for given) combinations of measurements of reverse accumulation registers - and this weighty argument for using this abbreviation. However, I would very much like to avoid controversy over terminology.
The functions of the ACS (and my development) are to give the user a data source, and let him play as he wants with the report settings:
1. It determines in what order the data will be displayed, which groups will be vertical, which horizontally.
For example: warehouse, product, manager, etc.
2. Defines a set of indicators, and aggregate functions (amount, average, quantity, minimum, maximum, etc.) that will be applied to them.
For example: amount (cost), average (quantity_of goods), maximum (date of shipment).
In general, this can be achieved in Excel, using the functionality of pivot tables, but in the basic version it would be nice to have this in your own system if it is supposed to form flexible reports from it. Which I did, inventing another bike on freelance - as usual I couldn’t find a simple and functional solution for this task on the fly, and time was running out.
I'll tell you about the algorithms.
For starters, let's decide on the data. They can be anything - come from JDBC, ORM, through JSON or SOAP, the main thing is that they can be converted to an ArrayList. In the demo in the getData () function, a simple stub from several records.
The user sets the set of training groups that will be displayed in the report. Then 2 trees are built on them (horizontal and vertical groupings).
The problem is that the user may want to see a combination of fields at one group level (in example b and bb). This somewhat complicated the algorithm, before it was more readable.
Next, we establish a list of indicators, and the aggregate function that works on them (in the demo one indicator):
The recursive functions generate (vert, t, groupsFeildsList, 0), according to our data, form trees described by the simplest Node class:
Next, the indicators are calculated by tree levels, of course, also recursive - the public HashMap compute function (Node x, Node y, ArrayList t, ArrayList computeFeildsList) and the result is output in html at the same time.
All this miracle works under Spring and is inserted into the jsp template. There were a couple of slippery moments with him.
The report was supposed to be interactive. I found an example on the Internet - jsfiddle.net/NZaw4/10 .
Since I decided to use styles to collapse and expand lines a la Excel, they had to somehow load. There were problems with this, and in the end I stuck the text directly into the jsp template (style type = "text / css").
Another point: it turned out that different browsers work with checkboxes differently, as a result you can notice such a thing in the code:
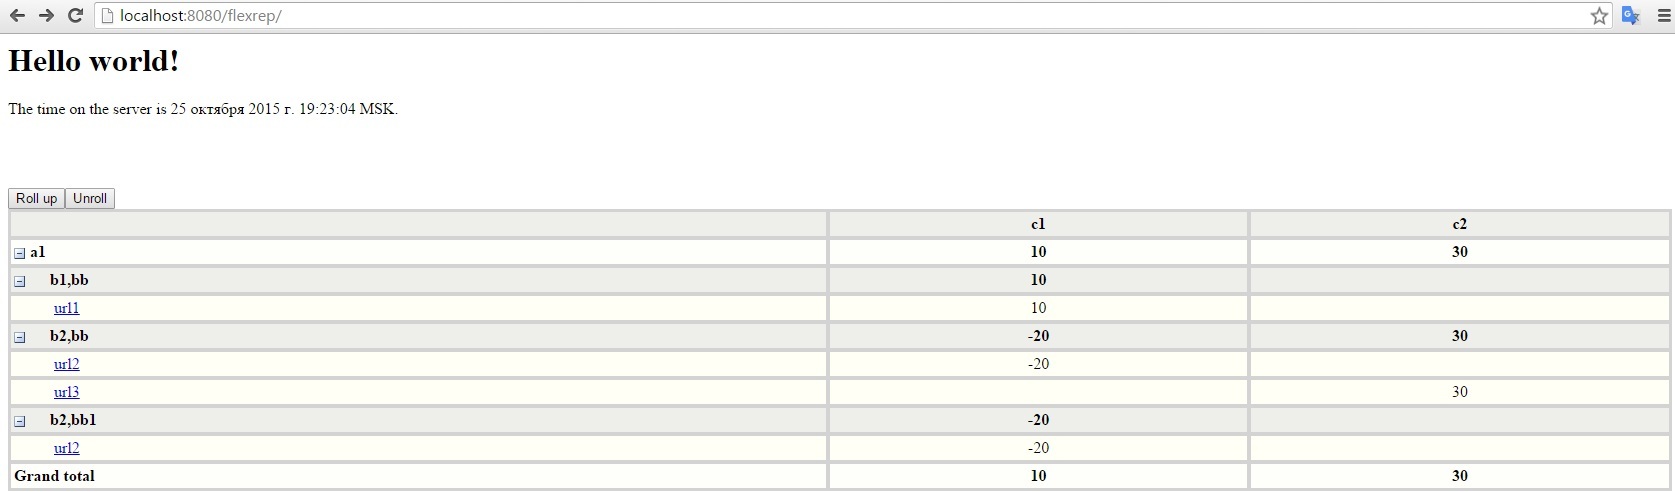
Actually, this is what I got in the end:
What I would like to add. In the first article, I received some practical advice, and links to resources that are worth exploring. Thank you very much for this.
But I got a bit of negativity, with the emphasis on the fact that, say, 1C will never catch up with these developments on the knee (and not push out the regulation reporting niche), and in general all this is only languor and vanity. Naturally not catch up! Therefore, the source code is open, because several other goals were set.
Nevertheless, I will report one interesting fact. That week I had the opportunity to speak at the INFOSTART EVENT 2015 CONNECTION conference at the Coliseum in St. Petersburg.
And what did I see there?
2 reports on open source projects with a similar focus:
1script
Metadata.js
Have a good working week!
As promised in the first article Fast CRUD development in Java: downshifting with "1C: Enterprise" , I continue the description of my OpenSource projects that implement similar functionality to 1C: Enterprise.
This time, it is SKD - a data composition system, and my development is FlexReporting ( link to GitHub ).
What is the essence of this mechanism? This is a kind of realtime - ROLAP tool, which on the fly transforms “flat” data into hierarchical reports.
In fact, there are many fans who argue that SKD is not an “OLAP”, but I would remind you that such a thing as aggregates that pre-calculate and store multidimensional data for all (or for given) combinations of measurements of reverse accumulation registers - and this weighty argument for using this abbreviation. However, I would very much like to avoid controversy over terminology.
This is how it looks in 1C ERP 2.0: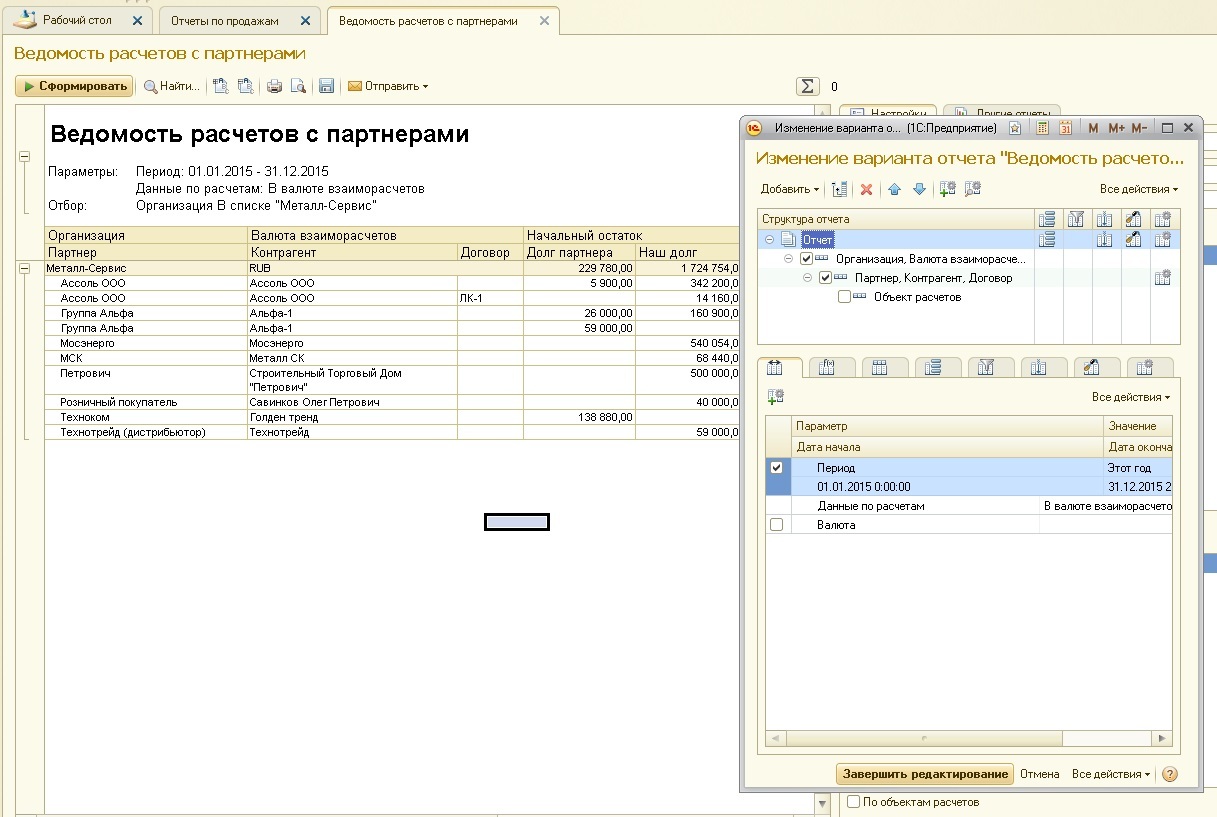
The functions of the ACS (and my development) are to give the user a data source, and let him play as he wants with the report settings:
1. It determines in what order the data will be displayed, which groups will be vertical, which horizontally.
For example: warehouse, product, manager, etc.
2. Defines a set of indicators, and aggregate functions (amount, average, quantity, minimum, maximum, etc.) that will be applied to them.
For example: amount (cost), average (quantity_of goods), maximum (date of shipment).
In general, this can be achieved in Excel, using the functionality of pivot tables, but in the basic version it would be nice to have this in your own system if it is supposed to form flexible reports from it. Which I did, inventing another bike on freelance - as usual I couldn’t find a simple and functional solution for this task on the fly, and time was running out.
I'll tell you about the algorithms.
For starters, let's decide on the data. They can be anything - come from JDBC, ORM, through JSON or SOAP, the main thing is that they can be converted to an ArrayList. In the demo in the getData () function, a simple stub from several records.
The user sets the set of training groups that will be displayed in the report. Then 2 trees are built on them (horizontal and vertical groupings).
groupsFeildsList.add ("a");
groupsFeildsList.add ("b, bb");
groupsFeildsList.add ("url");
columnFeildsList .add ("c");
The problem is that the user may want to see a combination of fields at one group level (in example b and bb). This somewhat complicated the algorithm, before it was more readable.
Next, we establish a list of indicators, and the aggregate function that works on them (in the demo one indicator):
computeFeildsList.add (newHashMap ("field, function", "d", "max"));
The recursive functions generate (vert, t, groupsFeildsList, 0), according to our data, form trees described by the simplest Node class:
public class Node implements Cloneable {
public ArrayList / Node / nodes;
public LinkedHashMap fields;
public HashMap additional;
public Node parent;
...
};
Next, the indicators are calculated by tree levels, of course, also recursive - the public HashMap compute function (Node x, Node y, ArrayList t, ArrayList computeFeildsList) and the result is output in html at the same time.
All this miracle works under Spring and is inserted into the jsp template. There were a couple of slippery moments with him.
The report was supposed to be interactive. I found an example on the Internet - jsfiddle.net/NZaw4/10 .
Since I decided to use styles to collapse and expand lines a la Excel, they had to somehow load. There were problems with this, and in the end I stuck the text directly into the jsp template (style type = "text / css").
Another point: it turned out that different browsers work with checkboxes differently, as a result you can notice such a thing in the code:
if (((ua.indexOf ('MSIE')! = -1) || (ua.indexOf ('Firefox')! = -1) || (ua.indexOf ('Mozilla')! = -1)) && (ua.indexOf ('Chrome') == -1)) {
row.querySelector ('td input'). checked =! row.querySelector ('td input'). checked;
newch =! row.querySelector ('td input'). checked;
}
Actually, this is what I got in the end:
What I would like to add. In the first article, I received some practical advice, and links to resources that are worth exploring. Thank you very much for this.
But I got a bit of negativity, with the emphasis on the fact that, say, 1C will never catch up with these developments on the knee (and not push out the regulation reporting niche), and in general all this is only languor and vanity. Naturally not catch up! Therefore, the source code is open, because several other goals were set.
Nevertheless, I will report one interesting fact. That week I had the opportunity to speak at the INFOSTART EVENT 2015 CONNECTION conference at the Coliseum in St. Petersburg.
And what did I see there?
2 reports on open source projects with a similar focus:
1script
This project is an alternative implementation of a virtual machine that runs scripts in 1C: Enterprise.
Moreover, the project is completely independent of 1C libraries and does not require a 1C: Enterprise system on the target machine.
Metadata.js
it is an alternative 1C lightweight javascript client that allows you to read and edit data located on a 1C server with a large number of connections (dealers or an online storefront with hundreds of anonymous or authorized external users).
So not only I have specific tastes, there are many of us.
Have a good working week!