Audit Linux system events
- Tutorial
One of the tools to improve Linux security is the audit subsystem. With its help, you can get detailed information about all system events.
It does not provide any additional protection, but provides detailed information about security breaches, on the basis of which specific measures can be taken. Features of working with the audit subsystem we will consider in this article.
Audit Subsystem: Architecture and Principle of Operation
An audit subsystem has been added to the Linux kernel since version 2.6. It is designed to track security-critical system events. The following can be cited as examples of such events (the list is far from complete):
- system startup and shutdown;
- reading, writing and changing file permissions;
- Initiation of network connections
- attempts of unsuccessful authorization in the system;
- change network settings;
- changing user and group information;
- start and stop applications;
- making system calls.
None of these events can happen without using kernel system calls. To track them, just intercept the appropriate system calls. This is exactly what the audit subsystem does:
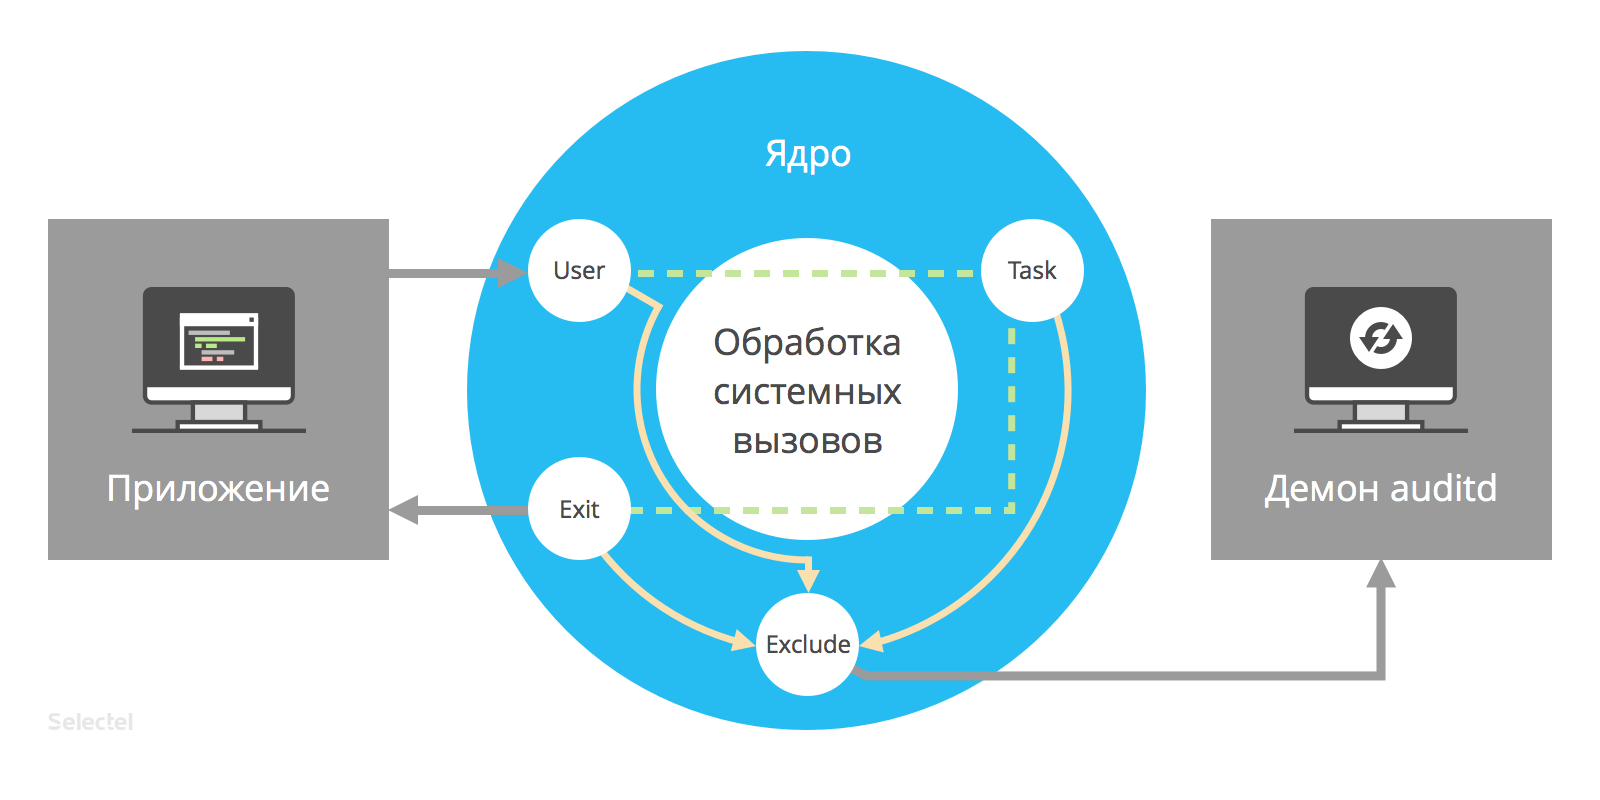
Having received a call from an application in user space, the audit subsystem passes it through one of the following filters: user, task, or exit (we will discuss them in more detail below). After that, the call is passed through the exclude filter, which, based on the audit rules, passes it to the auditd daemon for further processing.
Such a simple scheme allows you to quite effectively monitor any aspect of the OS, and in case of compromise of the system to identify suspicious actions and determine their cause.
Installation
To start working with the audit subsystem, you need to install the auditd package (here and below are examples of commands for OC Ubuntu 14.04):
$ sudo apt-get install auditd
This package includes the auditd daemon and several helper utilities:
- auditctl - auditd daemon management utility; allows you to get information about the current state of the audit subsystem, as well as add and remove rules;
- autrace - a utility for auditing events generated by processes (works on the same principle as strace);
- ausearch - utility for searching events in log files;
- aureport - a utility for generating reports on the work of the audit system.
Configuration
The settings of the audit subsystem are stored in the configuration file etc / audit / auditd.conf. It contains, among others, the following parameters:
- log_file - file in which the logs of the audit subsystem will be stored;
- log_format - format in which the logs will be saved;
- freq - the maximum number of protocol entries that can be stored in the buffer;
- flush - buffer synchronization mode with disk (none - do nothing, incremental - transfer data from the buffer to disk with the frequency specified in the freq parameter value; data - synchronize immediately, sync - synchronize both data and file metadata when writing to disk );
- max_log_file - the maximum size of the log file in megabytes;
- max_log_file_action - action when exceeding the maximum size of the log file;
- space_left - minimum free space in megabytes, upon reaching which the action specified in the next parameter should be performed;
- space_left_admin - indicates what to do when there is not enough free space on the disk (ignore - do nothing; syslog - send to syslog, email - send notification by mail; suspend - stop writing logs to disk; single - switch to single user mode; halt - turn off the car)
- disk_full_action - the action that must be taken when the disk is full (this parameter can take the same values as space_left_admin).
Create rules
The auditctl command is used to add and configure rules. Here is a list of its options:
- -l - list the available rules;
- -a - add a new rule;
- -d - remove the rule from the list;
- -D - delete all available rules.
To create a new rule, you need to run a command of the form:
$ auditctl -a <list>, <action> -S <system call name> -F <filters>
First, after the option -a, the list to which you want to add the rule is indicated. In total there are 5 such lists:
- task - events related to the creation of new processes;
- entry - events that occur when entering a system call;
- exit - events that occur when leaving a system call;
- user - events that use user space parameters;
- exclude - used to exclude events.
Then it is indicated what needs to be done after the event. Two options are possible here: always (events will be recorded in the log) and never (will not).
After the -S option is the name of the system call at which the event needs to be intercepted (open, close, etc.).
After the -F option, additional filtering options are indicated. For example, if we need to audit file accesses from the / etc directory, the rule will look like this:
$ auditctl -a exit, always -S open -F path = / etc /
You can install an additional filter:
$ auditctl -a exit, always -S open -F path = / etc / -F perm = aw
The abbreviation aw means the following: a - attribute change (attribute change), w - write (write). The wording perm = aw indicates that for the / etc directory all the facts of changing the attributes (а - attribute change) and w (w - write) should be monitored.
When setting up tracking for individual files, you can omit the -S option, for example:
$ auditctl -a exit, always -F path = / etc / -F perm = aw
Rule files
Rules can be set not only through the command line, but also written in the file etc / audit / audit.rules.
This file begins with the so-called meta-rules, in which the general logging settings are set:
# delete all previously created rules
-D
# set the number of buffers in which messages will be stored
-b 320
# indicate what to do in a critical situation (for example, when buffer overflows):
0 - do nothing; 1 - send a message to dmesg, 2 - send the kernel in a panic
-f 1
The following are user rules. Their syntax is extremely simple: just list the appropriate options for the auditctl command. Consider an example of a typical rule file:
# track unlink () and rmdir () system calls
-a exit, always -S unlink -S rmdir
# track open () system calls from a user with UID 1001
-a exit, always -S open -F loginuid = 1001
# track access to password and group files and attempts to change them:
-w / etc / group -p wa
-w / etc / passwd -p wa
-w / etc / shadow -p wa
-w / etc / sudoers -p wa
# track access to the following directory:
-w / etc / my_directory -pr
# close access to the configuration file to prevent changes
-e 2
Configuration changes will take effect after restarting the auditd daemon:
$ sudo service auditd restart
Log file analysis: aureport utility
All log files are saved in the / var / log / audit directory in a machine-readable format. They can be made human-readable using the aureport utility.
If you enter the aureport command without arguments, we will see general system statistics (number of system users, total number of system calls, number of open terminals, etc.):
$ sudo aureport
Summary Report
========================
Range of time in logs: 07/31/2015 14: 04: 23.870 - 08/04/2015 09: 37: 13.200
Selected time for report: 07/31/2015 14:04:23 - 08/04/2015 09: 37: 13.200
Number of changes in configuration: 0
Number of changes to accounts, groups, or roles: 3
Number of logins: 0
Number of failed logins: 0
Number of authentications: 0
Number of failed authentications: 61205
Number of users: 2
Number of terminals: 5
Number of host names: 73
Number of executables: 6
Number of files: 0
Number of AVC's: 0
Number of MAC events: 0
Number of failed syscalls: 0
Number of anomaly events: 0
Number of responses to anomaly events: 0
Number of crypto events: 0
Number of keys: 0
Number of process IDs: 17858
Number of events: 61870
It has no special practical value. Of much greater interest are specialized reports. Here, for example, you can view information about all system calls:
$ sudo aureport -s
Syscall report
=========================================
# date time syscall pid comm auid event
=========================================
08/03/2015 15:45:03 313 10285 modprobe -1 52501
08/03/2015 15:45:03 313 10290 modprobe -1 52502
03/08/2015 15:45:03 54 10296 iptables -1 52503
04/08/2015 15:45:03 54 10302 iptables -1 52504
05/08/2015 15:45:03 54 10305 iptables -1 52505
6/08/2015 15:45:03 54 10313 iptables -1 52506
07/08/2015 15:45:03 54 10325 iptables -1 52507
08/03/2015 15:45:03 54 10329 iptables -1 52508
09/03/2015 15:45:03 54 10343 iptables -1 52509
08/10/03/2015 15:45:03 54 10345 iptables -1 52510
08/11/2013 15:45:03 54 10349 iptables -1 52511
Using the -au (or −−auth) option, you can view information about all login attempts:
$ sudo aureport -au
Authentication Report
==============================================
# date time acct host term exe success event
==============================================
08/31/2015 18:00:19 ubnt static-166-6-249-80.stalowa.pilicka.pl ssh / usr / sbin / sshd no 333
08/31/2015 18:01:38 root 59.63.188.31 ssh / usr / sbin / sshd no 334
08/31/2015 18:01:41 root 59.63.188.31 ssh / usr / sbin / sshd no 335
04/08/2015 18:01:45 root 59.63.188.31 ssh / usr / sbin / sshd no 336
05/08/2015 18:01:53 root 59.63.188.31 ssh / usr / sbin / sshd no 337
06/08/2015 18:01:57 root 59.63.188.31 ssh / usr / sbin / sshd no 338
07/08/2015 18:01:59 root 59.63.188.31 ssh / usr / sbin / sshd no 339
Aureport supports filtering by date and time:
$ sudo aureport -s --start 07/31/15 12:00 --end 07/31/15 13:00
You can specify both specific time and date, and special human-readable constructions:
- now - current moment;
- yesterday - yesterday;
- recent - 10 minutes ago;
- this-week (or this-month, this-year) - current week (month, year).
Using aureport, you can view information about the actions of any system user. To do this, you first need to find out the id of this user:
$ id user
uid = 1000 (user) gid = 1000 (andrei) groups = 1000 (andrei), 27 (sudo)
and then run the following command:
$ sudo ausearch -ui 1000 --interpret
Ausearch: event search and analysis
To view detailed information about the event, the ausearch utility is used:
$ sudo ausearch -a <event number>
The output of the above command looks like this: Consider its structure in more detail. The type field indicates the type of record; type = syscall means that the record was made after making a system call. The msg field indicates the time of the event in Unix Timestamp format and its unique identification number. The arch field contains information about the system architecture used (c000003e means x86_84), presented in encoded hexadecimal format. To display it in human-readable form, you can use the -i or −−interpret option. The syscall field indicates the type of system call - in our case it is 2, that is, an open call. The success parameter reports whether the call was processed successfully or not. In our example, the call was processed unsuccessfully (success = no).
type=SYSCALL msg=audit(1364481363.243:24287): arch=c000003e syscall=2 success=no exit=-13 a0=7fffd19c5592 a1=0 a2=7fffd19c4b50 a3=a items=1 ppid=2686 pid=3538 auid=500 uid=500 gid=500 euid=500 suid=500 fsuid=500 egid=500 sgid=500 fsgid=500 tty=pts0 ses=1 comm="cat" exe="/bin/cat" subj=unconfined_u:unconfined_r:unconfined_t:s0-s0:c0.c1023 key="sshd_config"
For each call, the report also lists individual parameters; You can read more about them in the official guide . To output information about any parameter in human-readable form to the console, use the -i or −−interpret option mentioned above, for example:
$ sudo ausearch --interpet --exit -13
The -sc option allows you to list events related to the specified system call, for example:
$ sudo ausearch -sc ptrace
The -ui option is used to search for events by user ID:
$ ausearch -ui 33
Search by daemon name is done using the -tm option:
$ ausearch -x -tm cron
You can also use keys to search for the necessary events, for example:
$ sudo auditctl -k root-actions
The above command will list all the actions performed as root. Filtering by date and time is also supported, similar to the one described above. A list of failed events can be displayed using the −−failed option.
Process analysis using the autrace utility
In some cases, it may be useful to obtain information about events related to one particular process. For this purpose, you can use the autrace utility. Suppose we need to track the date process and find out what system calls and files it uses. Run the command:
$ sudo autrace / bin / date
The following text will appear on the console:
Waiting to execute: / bin / date
Mon Aug 31 17:06:32 MSK 2015
Cleaning up ...
Trace complete. You can locate the records with 'ausearch -i -p 29234'
Let's pay attention to the last line of output: it indicates a command with which you can get more detailed information. Run this command and pass the output to the aureport utility, which converts it to a human-readable format:
$ sudo ausearch -p 29215 --raw | aureport -f -i
As a result, we get the following report:
File report
=================================================
# date time file syscall success exe auid event
=================================================
01/08/2015 16:52:16 / bin / date execve yes / bin / date root 25
08/31/2015 16:52:16 /etc/ld.so.nohwcap access no / bin / date root 27
08/31/2015 16:52:16 /etc/ld.so.preload access no / bin / date root 29
04/08/2015 16:52:16 /etc/ld.so.cache open yes / bin / date root 30
05/08/2015 16:52:16 /etc/ld.so.nohwcap access no / bin / date root 34
06/08/2015 16:52:16 /lib/x86_64-linux-gnu/libc.so.6 open yes / bin / date root 35
07/08/2015 16:52:16 / usr / lib / locale / locale-archive open yes / bin / date root 52
08/08/2015 16:52:16 / etc / localtime open yes / bin / date root 56
Centralized log storage
To send the logs of the audit subsystem to the centralized storage, the audisp-remote plugin is used. It is included in the audisp-plugins package, which must be installed additionally:
$ sudo apt-get install audisp-plugins
The configuration files of all plugins are stored in the /etc/audisp/plugins.d directory.
Remote logging settings are specified in the configuration file /etc/audisp/plugins.d/audisp-remote.conf. By default, this file looks like this:
active = no
direction = out
path = / sbin / audisp-remote
type = always
#args =
format = string
To activate sending logs to the remote storage, replace the value of the active parameter with yes. Then open the file etc / audisp / audisp-remote.conf and specify the letter or IP address of the server where the logs will be stored as the value of the remote_server parameter.
To receive logs from remote hosts and save them on the server, the following parameters must be specified in the /etc/audit/auditd.conf file:
tcp_listen_port = 60

tcp_listen_queue = 5

tcp_max_per_addr = 1

##tcp_client_ports = 1024-65535 #optional

tcp_client_max_idle = 0
Conclusion
In this article, we have outlined the basics of working with the Linux auditing subsystem. We examined the principle of the audit system, learned to formulate rules, read logs and use auxiliary utilities.
For those who want to study the topic in more detail, here are some useful links:
- complete list of record types Audit ;
- a complete list of possible events ;
- An article about using audit capabilities to investigate kernel attacks .
Readers who are not able to post comments here are welcome to join our blog .