Intel System Studio Developer Notes: Debugging the Android Linux Kernel with Intel JTAG Debugger and MinnowBoard MAX
- Transfer
 Debugging tools are needed by every developer. However, there are no universal solutions suitable for those who create user-level applications and those who write low-level programs, such as hardware drivers. The closer to hardware, the more hardcore in debugging and testing.
 In this article, you will learn how to debug code and analyze exceptions at the Linux kernel level of the Android Android OS in systems based on the Intel architecture. Namely, we will look at the JTAG Debugger debugging tool, which is part of the Intel System Studio Ultimate Edition package. We will talk about the JTAG standard, the aforementioned Intel JTAG debugger, exception handling. As an example, we will use the MinnowBoard MAX mini-computer with Intel Atom on board.
JTAG Review
JTAG (pronounced "jay tag", "jay-tag") is an acronym for Joint Test Action Group. Usually, when they say "JTAG", they mean the IEEE 1149.1-1990 standard (IEEE Standard Test Access Port and Boundary-Scan Architecture). This standard establishes rules for debugging and testing single-chip systems (SoC, System on Chip) and microprocessor software (Microprocessor Software).
JTAG debugging uses a set of tools consisting of three parts: a software JTAG debugger installed on the host computer, a hardware JTAG adapter (sensor), and an in-circuit debugger (OCD, On Chip Debug), which is equipped with the chip under test.
Software JTAG Debugger
JTAG debugger is a software tool installed on the host computer. It receives data and address information from the JTAG adapter and displays it in the user interface. The developer, in turn, can send commands to the JTAG adapter, which is connected to the main computer via USB or using another interface.
Using this tool, you can monitor program execution and debug it at the source code level. This is realized thanks to symbol files that correspond to binary images downloaded to the target systems. These tools give the developer the following features: start (run) and stop (stop) the execution of the code, execute during debugging a step with a bypass (step over) and a step with a step in (step into), specifying breakpoints (breakpoints), access to memory.
Using the above tools, the programmer can debug the program part of the target system, examine the system memory and registers.
The Intel JTAG Debugger (known as XDB) is part of the Intel System Studio Ultimate Edition. XDB is the same JTAG debugging tool that must be installed on the host computer.
Hardware JTAG adapter
A JTAG adapter is a device that converts JTAG signals into a format suitable for transmission to a computer. To pair adapters and PCs, such interfaces as USB, parallel port, RS-232, Ethernet are used. USB is the most popular among them. It is it that is used to connect many JTAG adapters with computers. The standard provides a minimum number of JTAG contacts for connecting target devices to JTAG adapters, however, in practice, a variety of interfaces are used. For example, these are 10- and 20-pin connectors for ARM, 14-pin for ST, 16-pin for OCDS.
The bundle from the Intel JTAG debugger and MinnowBoard MAX, which is discussed in this article, uses a 60-pin connector to connect the target device. The JTAG adapter for MinnowBoard MAX uses Intel ITP-XDP3. The Intel JTAG debugger is also compatible with third-party JTAG adapters. For example, with Macraigor Systems usb2Demon and OpenOCD.
Intracircuit debugger (target microchip)
The main components of the in-circuit debugger are TAP (Test Access Point, test port) and TDI (Test Data In, test data input) / TDP (Test Data Out, test data output). Using TAP, you can reset, read and write the status of registers, use the BYPASS instruction. The main technology used in JTAG is the so-called Boundary Scan using TDI / TDO signal lines.
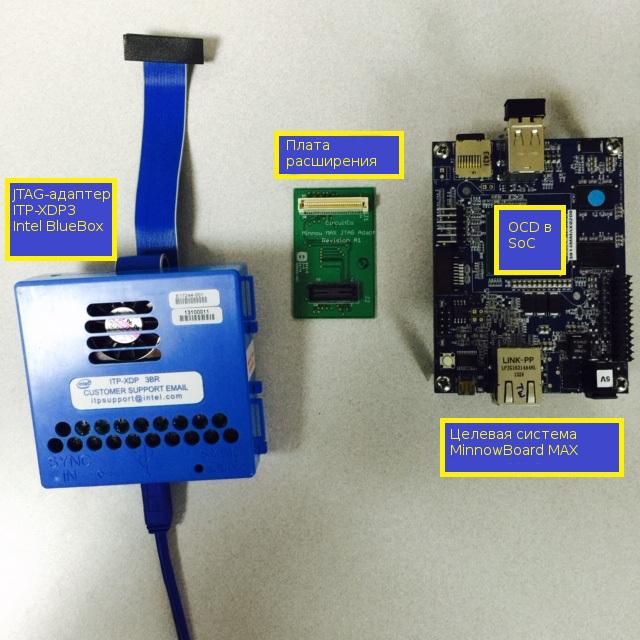
Configuration from JTAG adapter and target system. It also shows the expansion card used to connect Intel ITP-XDP3 and MinnowBoard MAX.
Intel Architecture Exceptions Overview
An exception is a synchronous event that is generated when the processor, upon executing instructions, detects one or more predefined conditions. The IA-32 architecture provides three classes of exceptions: fault, trap, and abort. Usually, in the event of failures and traps, it is possible to continue interrupted operation, while in case of accidents - not. When an exception occurs, it is handled in the same way that interrupts are handled. This means that after stopping and saving the current process, the system switches to the exception handler, and after the handler has completed work, it returns to the previously executed task.
Protected Mode Exceptions and Interrupts
| Vector | Abbreviated name | Description | A type | Error code | A source |
| 0 | #DE | Division error | Renouncement | Not | DIV and IDIV instructions |
| 1 | #DB | Reserved | Failure / Trap | Not | Intel Use Only |
| 2 | - | NMI interruption | Interrupt | Not | External non-maskable interrupt |
| 3 | #BP | Breakpoint | Trap | Not | INT 3 instruction |
| 4 | #OF | Overflow | Trap | Not | INT0 instruction |
| 5 | #BR | Out of Range | Renouncement | Not | BOUND instruction |
| 6 | #UD | Invalid (undefined) opcode | Renouncement | Not | UD2 instruction or reserved operation code |
| 7 | #NM | Device unavailable (No math coprocessor) | Renouncement | Not | Floating-point instructions or WAIT / FWAIT instructions |
| 8 | #DF | Double failure | Crash | Yes (zero) | Any instruction that can throw an exception, NMI or INTR |
| 9 | Going beyond the limits of a coprocessor segment (reserved) | Renouncement | Not | Floating point instruction | |
| 10 | #TS | Invalid TSS | Renouncement | Yes | Task switching or access to TSS |
| eleven | #NP | No segment | Renouncement | Yes | Download segment registers or access to system segments |
| 12 | #SS | Stack Segment Failure | Renouncement | Yes | Stack Operations and SS Register Loading |
| thirteen | #GP | General security error | Renouncement | Yes | Errors related to memory, security checks |
| 14 | #PF | Page Failure | Renouncement | Yes | Work with memory |
| fifteen | - | Intel reserved, not intended for use | Not | ||
| 16 | #MF | X87 FPU floating point error (calculation error) | Renouncement | Not | X87 FPU floating point calculations or WAIT / FWAIT instructions |
| 17 | #AC | Alignment Check Error | Renouncement | Yes (zero) | Work with data in memory |
| 18 | #MC | Hardware error | Crash | Not | Error codes (if any) and their source are hardware dependent |
| 19 | #XM | SIMD Floating Point Exceptions | Renouncement | Not | SSE, SSE2, SSE3 floating point instructions |
| 20 | #VE | Virtualization Exception | Renouncement | Not | EPT violations |
| 21 - 31 | - | Intel reserved, not intended for use | |||
| 32 - 255 | - | Developer-defined interrupts (not reserved) | Interrupt | External interrupts or instructions INT n. |
Preparing MinnowBoard MAX and Intel ITP-XDP3 for USB Connection to a Host Computer
First you need to install Android OS on MinnowBoard MAX. In order to do this, refer to the article “ Intel System Studio Developer 's Article: Configuring, Building, and Profiling Android Linux Kernel Using VTune ”. It contains instructions for building, installing, and configuring Android on the MinnowBoard MAX.
After installing the OS, connect MinnowBoard MAX to the Intel ITP-XDP3 JTAG adapter using an expansion card. We connect the JTAG adapter to the PC via USB. The host computer must have Intel System Studio Ultimate Edition installed, which includes a USB driver for Intel ITP-XDP3.
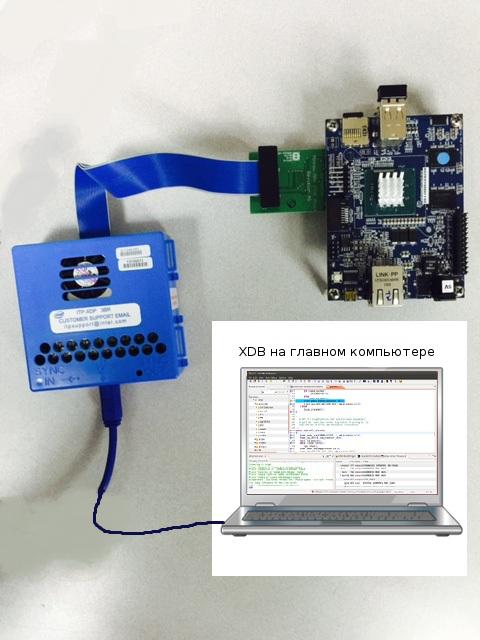
MinnowBoard MAX is connected to the Intel ITP-XDP3 JTAG adapter, which, in turn, is connected to the host computer with Intel JTAG debugger (XDB) installed on it
Using Intel JTAG Debugger (XDB) to Debug Android Kernel on MinnowBoard MAX
Consider the step-by-step procedure for using XDB in debugging the Android Linux kernel.
1. Run the Intel JTAG debugger. To do this, go to the folder where it is installed and run the batch file (for example, start_xdb_legacy_products.bat).
2. Connect to the target device. To do this, in the interface of the JTAG debugger, execute the command File> Connect and select, firstly, the hardware JTAG adapter. In our case, this is Intel ITP-XPD3. Secondly, you need to specify the target platform. We are interested in Intel Atom Processor E38xx, Z3680, X37xx - 2 cores (ValleyView).
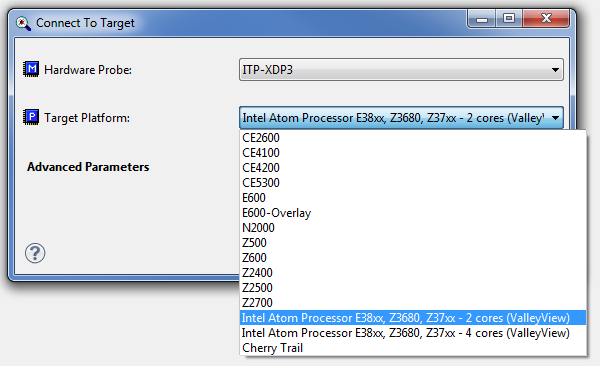
Choosing a hardware JTAG adapter and target platform in XDB
3.Download the symbol files and indicate the directory of the source code files. To do this, execute the File> Load / Unload Symbol command in the Intel JTAG debugger and specify the symbol files. For source code files, you need to execute the command Options> Source Directories and specify the rules for matching source code files and symbol files, as well as the corresponding directories. The rules allow you to configure the correspondence of the paths in the symbol file that are recorded at compile time with the current locations of the source code files.
4. Find the entry-file in which there is an exception handler. Use the menu command of the Intel View> Source files JTAG debugger and open the entry_64.S file.
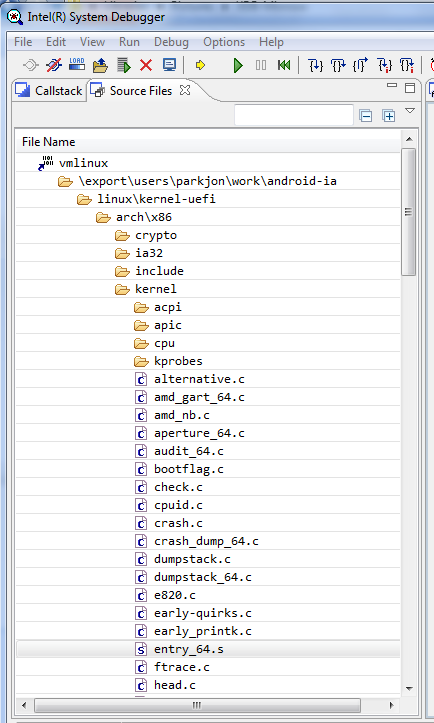
Search for entry_64.S file
5.Set a breakpoint on the entry point of the exception. To do this, find the line ENTRY (error_entry), which is the entry point of the exception with the error code in the RAX register. Each exception handler is defined as a zeroentry or errorentry macro. Thus, you can set a breakpoint in error_entry or in some specific handler. In this article we use for testing "zeroentry invalid_op do_invalid_op".
ENTRY(error_entry)
	XCPT_FRAME
	CFI_ADJUST_CFA_OFFSET 15*8
	/* oldrax contains error code */
	cld
	movq_cfi rdi, RDI+8
	movq_cfi rsi, RSI+8
	movq_cfi rdx, RDX+8
	movq_cfi rcx, RCX+8
	movq_cfi rax, RAX+8
	movq_cfi  r8,  R8+8
	movq_cfi  r9,  R9+8
	movq_cfi r10, R10+8
	movq_cfi r11, R11+8
	movq_cfi rbx, RBX+8
	movq_cfi rbp, RBP+8
	movq_cfi r12, R12+8
	movq_cfi r13, R13+8
	movq_cfi r14, R14+8
	movq_cfi r15, R15+8
	xorl %ebx,%ebx
	testl $3,CS+8(%rsp)
	je error_kernelspace
error_swapgs:
	SWAPGS
error_sti:
	TRACE_IRQS_OFF
	ret
<....>
zeroentry divide_error do_divide_error
zeroentry overflow do_overflow
zeroentry bounds do_bounds
zeroentry invalid_op do_invalid_op
zeroentry device_not_available do_device_not_available
paranoiderrorentry double_fault do_double_fault
zeroentry coprocessor_segment_overrun do_coprocessor_segment_overrun
errorentry invalid_TSS do_invalid_TSS
errorentry segment_not_present do_segment_not_present
zeroentry spurious_interrupt_bug do_spurious_interrupt_bug
zeroentry coprocessor_error do_coprocessor_error
errorentry alignment_check do_alignment_check
zeroentry simd_coprocessor_error do_simd_coprocessor_error
Now, as an example, we will throw an exception, and check if the handler on which we set the breakpoint worked. Set the breakpoint to “zeroentry invalid_op do_invalid_op” and call the code block BUG (), which executes the ud2 instruction, which causes the error “Invalid operation code”.
#define BUG()							\
do {								\
	asm volatile("ud2");					\
	unreachable();						\
} while (0)
Call BUG ()
The BUG () macro must be added to the kernel-level native test code so that an exception is thrown. In this example, we added it to keyboard.c so that an exception is thrown when special sequences of characters entered from the keyboard appear.
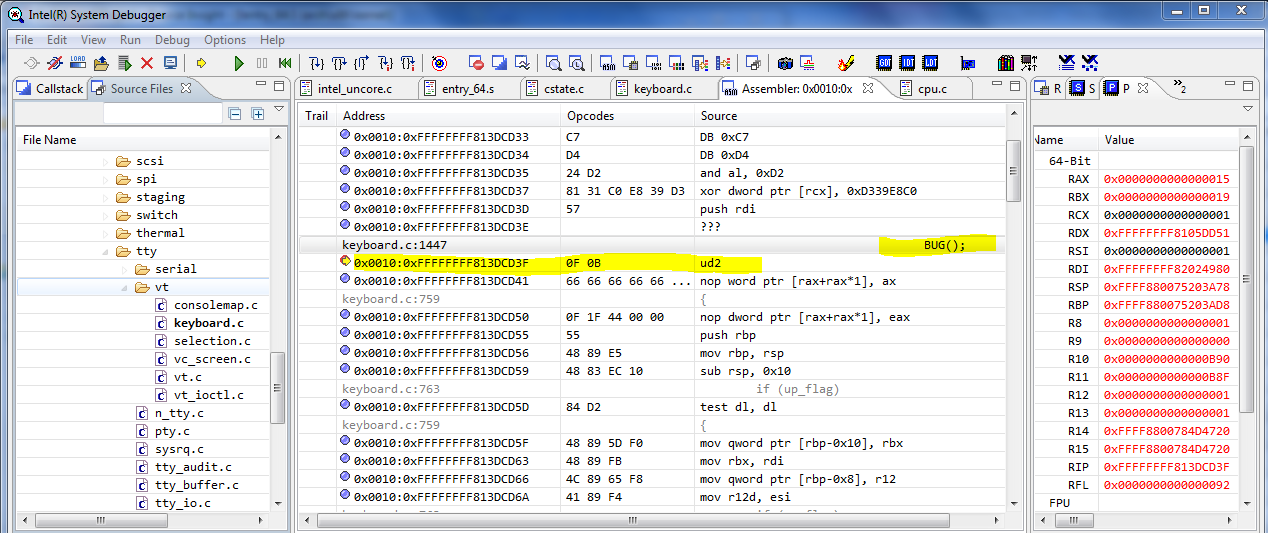
The result of the macro call BUG ()
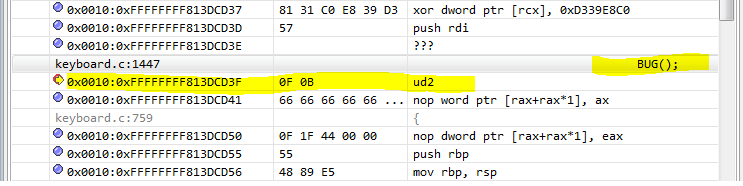
The result of the macro call BUG (), enlarged fragment of the screen copy
Stop at breakpoint Invalid_op
If you set a breakpoint in the “Invalid Operation Code” exception handler or at the entrance to the exception handler, you can see the exception message and, during debugging, get to the place where the error occurred.
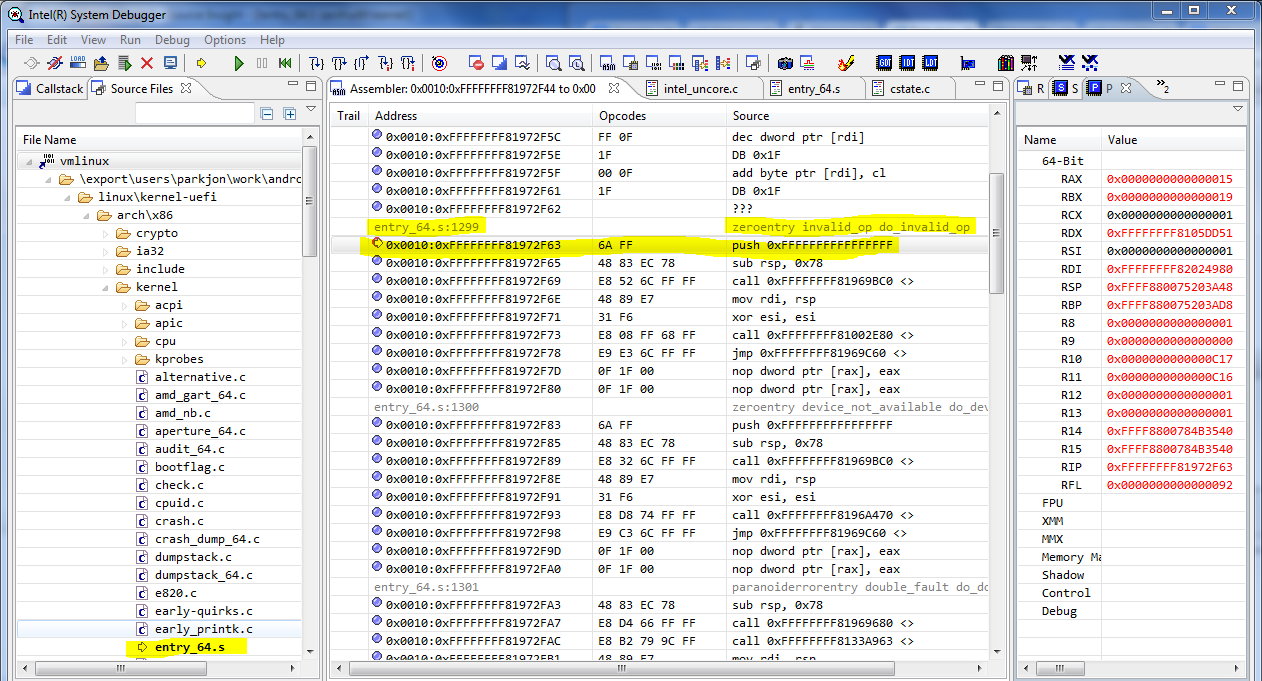
Breakpoint in the Exception Handler for the Invalid Operation Code Exclusion
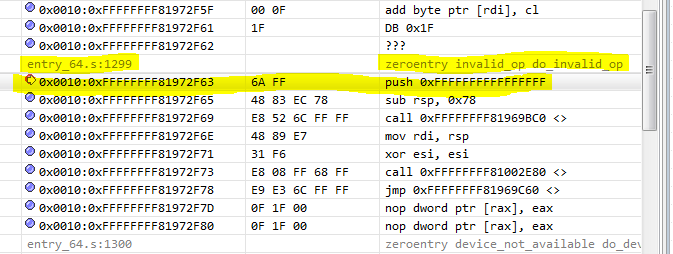
Point for the Exception Handler for the Invalid Operation Code, enlarged fragment of the screen copy
Conclusion
Some exceptions are critical errors in the system hardware and software. Therefore, it is very important to know how, why, and where they occur. Using the Intel JTAG debugger, such errors are easy to detect and get to the cause of their occurrence. All this is possible because this debugger provides the developer with powerful features. Among them - easy access to compiled and source code, viewing a stack of calls and registers.
useful links
Intel 64 and IA-32 Architectures Software Developer's Manual
JTAG Tutorial: IEE 1149.x and Software Debug