A simple plan-fact analysis in Power BI Desktop. Part One - Data Consolidation and Cleansing
- From the sandbox
- Tutorial
UPD: Updated publications in connection with the release of Power BI Desktop from the Preview stage on July 24.
Today I want to talk about building a simple dashboard with a plan-fact analysis of income and expenses in Power BI Desktop and Power BI . In the first part, we consider working with queries, learn how to combine data from several sources and perform their cleaning.
Initial data: several Excel files which store information on the company's income and expense indicators for some time. Since the form of reports and accounting articles have changed several times, the information sheets have a similar, but not quite identical structure. At the exit, you need to get something that will allow managers to get an idea of what is happening with the company's finances.
Let's see how Power BI Desktop allows you to combine data and visualize it.

Figure 1. Power BI Desktop start window
When starting Power BI Desktop asks you to specify a data source or select one of recent sources. By the way, regarding sources - it is possible to connect to a large number of them, including online and local sources. For example, Google Analytics. In our case, all reports are stored in one folder, so we will select “Folder” as the source. Such a choice will allow further adding new reports to this folder and loading their data for analysis by clicking the Refresh button.
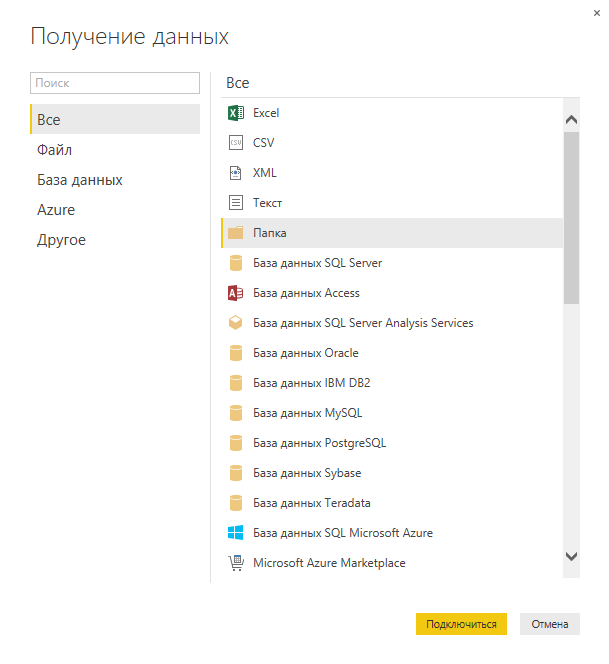
Figure 2. Choosing a data source
After clicking the "Connect" button, a preview window of the results of the query to the data source is displayed. You can load the data “as is” or switch to the query editing mode by clicking on the “Change” button. In most cases, the query results need to be processed.
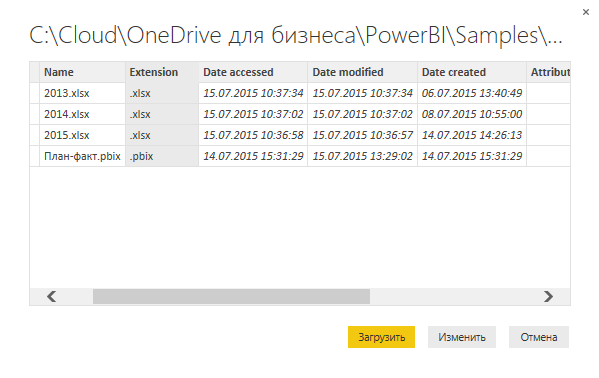
Figure 3. Preview of the query results
After clicking the “Change” button, the “Query Editor” window automatically opens, in which you can and should perform data cleaning and preparation.
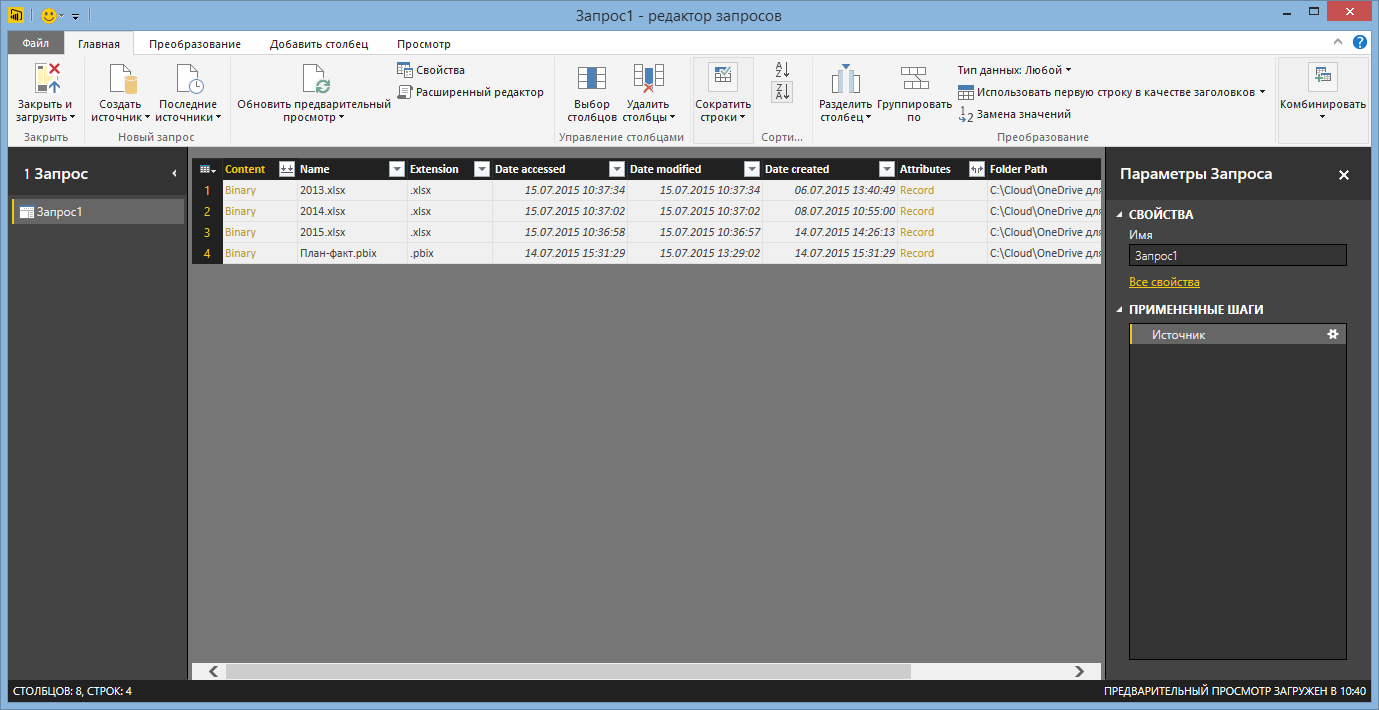
Figure 4. The query editor window
As you can see in the screenshot, Power BI Desktop uploaded files from the folder and the main meta-information. Delete all columns except “Content”, “Name” and “Extension”. Since the file name shows which year the corresponding report belongs to, we use it for this.
If you click on any row in the “Content” column, Power BI Desktop will open the contents of the corresponding workbook. Please note that in the "Request Parameters" section, all completed steps are recorded and can be changed or deleted. If you open the “Advanced Editor” window, a window will open in which the program code for all the actions performed will be visible. Yes, Power BI Desktop has its own programming language “M” and this is very cool.
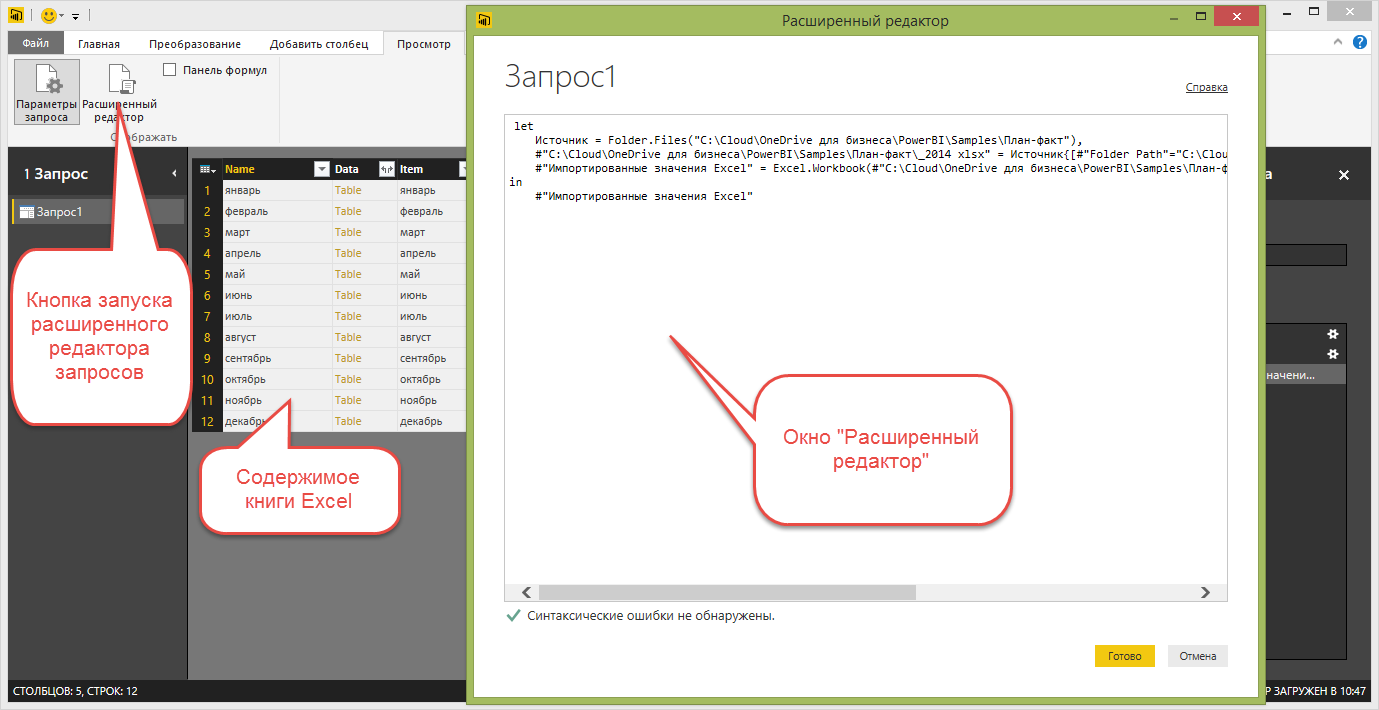
Figure 5. Advanced query editor
Since the report requires the contents of all Excel files in the folder, and not just one, I will delete the last two steps and use some functions of the “M” language to parse the contents of Excel books from the folder.
Before further processing the data, you also need to consider that not only Excel files can be loaded into the folder. Therefore, you need to apply a filter to the “Extension” column, which will eliminate unnecessary file types.
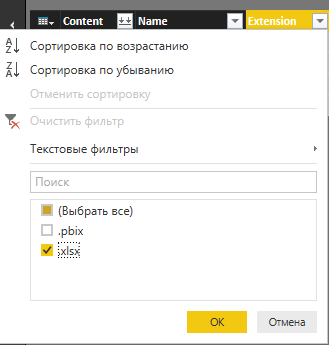
Figure 6. Filter application
Now you need to “extract” the contents of the Excel workbooks. To do this, I will add a new column using the Excel.Workbook function, which allows you to “extract” the contents of Excel workbooks. The new column contains the values of the "Table" type, which allows you to "expand" its contents into several other columns. When “deploying”, you can choose which columns will be displayed. In this case, the “Data” and “Item” columns bear the semantic load.
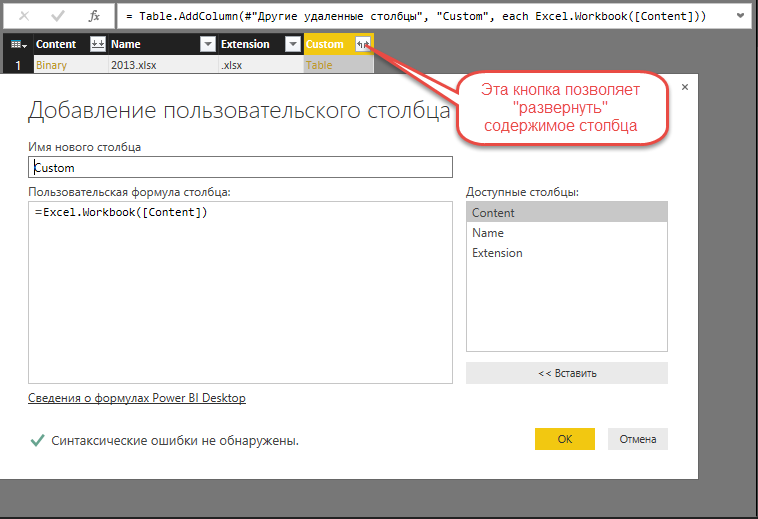
Figure 7. Adding a custom column.
The “Data” column contains data from Excel worksheets, and in the future I use “Name” and “Item” for timestamps.
Since the “Name” column contains data of the form yyyy.xlsx, where yyyy is the year of the report, we perform a simple operation to separate the data in the column. Separation can be performed both by the number of characters and by the separator. In this case, the column must be divided by the separator.
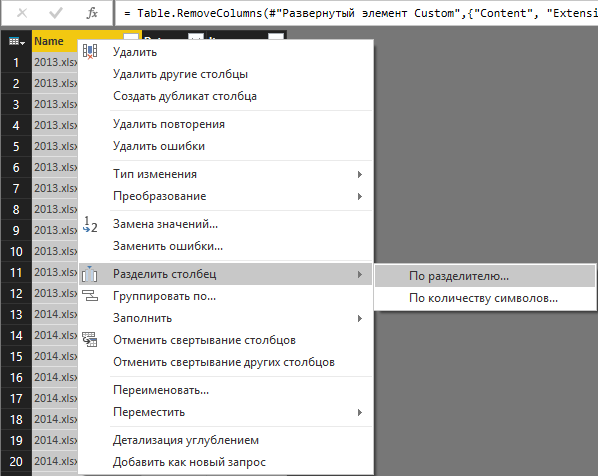
Figure 8. Column split
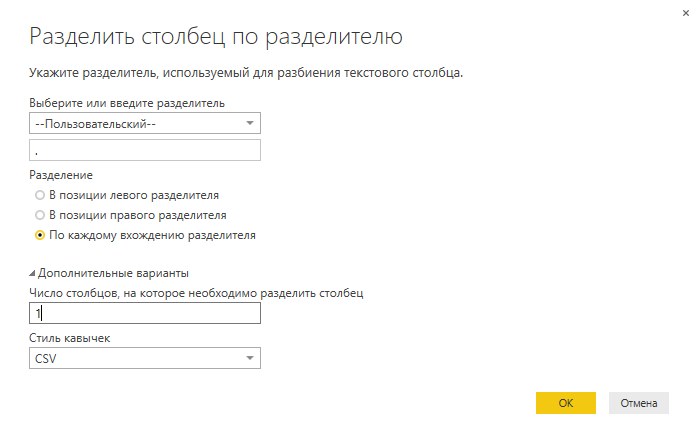
Figure 9. Column split settings window
After you split a column, you will need to rename it.
Figure 9. The column splitting settings window
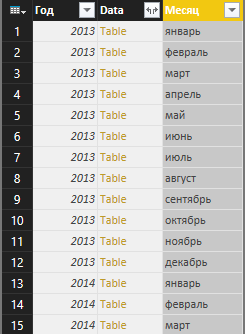
Figure 10. The query prepared for “deployment” query
Then I “expand” the Data column and see the contents of all Excel files and sheets, in a form that is not suitable for building the final reporting. But I can use the Power BI Desktop features to clear the data.
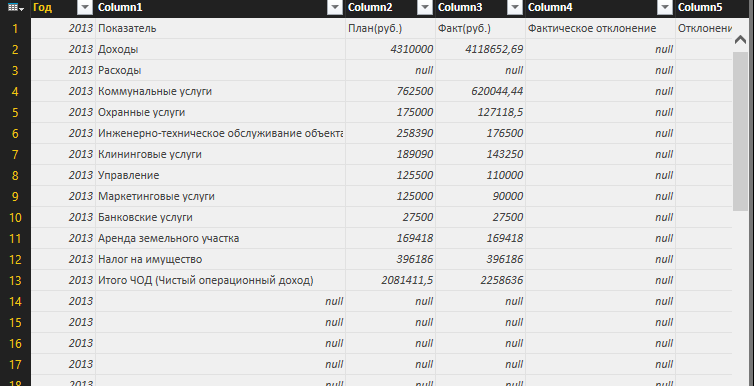
Figure 11. A query after “deploying” the contents of the files
1. I use the top rows as headers and then rename the columns. I will delete the columns "Actual deviation" and "Deviation in%". We will recount them later.
2. I will delete the lines that contain empty values and the “Indicator” value in the “Indicator” column, applying filtering. In the same way, I delete the lines that contain the total values, for example, “Total CHOD”, “Total”, etc.
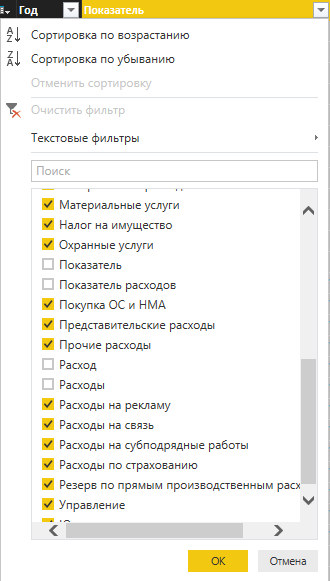
Figure 12. Filtering data menu
3. Using the “Replace Values” function, I will replace synonyms, for example, “Income” and “Income”.
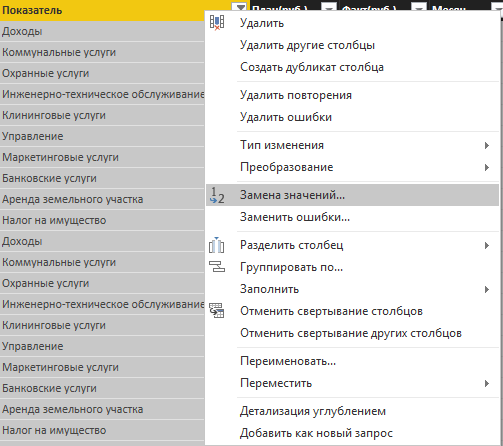
Figure 13. Replacing Values
4. Having examined the contents of the “Indicator” column a little more, I find that all of my income relates to the “Income” or “Income” indicator. Everything else relates to costs, which greatly facilitates the task. For the convenience of further processing and filtering, we will create a “Category” column, which will contain the value “Income” if the word “Income” is present in the column “Indicator”, and in all other cases takes the value “Expense”.

Figure 14. Adding the “Category” column
5. Next, I need to indicate that the type of values in the “Plan” and “Fact” columns is a decimal number. But before that, I need to remove spaces from the contents of these columns.
6. After the operation is completed, I check the columns for errors and negative values. Since in our case the presence of a negative value means an input error, using the value conversion function I highlight the absolute value in the “Plan” and “Fact” columns. This completes the basic data cleansing.
7. In order to display indicators with a time reference, you must specify a date for each record. The table contains the month in text form and the year. For convenience, we assume that the data is displayed at the end of each month. Here we are faced with a problem - the language "M" does not currently allow us to convert the names of months into dates. Therefore, you will need to take several intermediate steps.
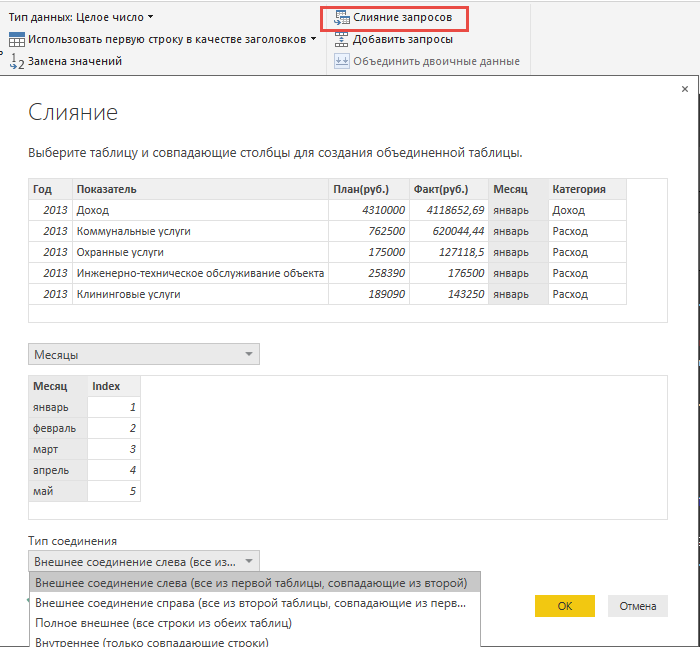
8. Create a new query that will contain the names of the months and their numbers. To do this, create an empty request, open the advanced editor and paste the following code: Figure 15. Adding an empty request 9. I go to the Plan-Fact request and merge the requests by selecting the desired type of association. Figure 16. Consolidation of queries 10. The data from the query “Months” was added as a new column. I open it and now we have all the data for the formation of the date. I create a new column called “Date” using the formula: = Date.EndOfMonth (#date ([Year], [Index], 1)) The column is added and it contains the last day of each month. In order for Power BI Desktop to be able to group dates by months and years, you will need to explicitly set the type to “Date”. Figure 17. Adding the “Date” column


11. Delete the columns Index, Year and Month. We don’t need them anymore. Then you need to click on the “Close and Download” button to proceed to the modeling and visualization of the data.
This completes the basic part of data processing and you can proceed to visualization. The possibilities of data visualization in Power BI Desktop will be discussed in the next part .
Today I want to talk about building a simple dashboard with a plan-fact analysis of income and expenses in Power BI Desktop and Power BI . In the first part, we consider working with queries, learn how to combine data from several sources and perform their cleaning.
Initial data: several Excel files which store information on the company's income and expense indicators for some time. Since the form of reports and accounting articles have changed several times, the information sheets have a similar, but not quite identical structure. At the exit, you need to get something that will allow managers to get an idea of what is happening with the company's finances.
Let's see how Power BI Desktop allows you to combine data and visualize it.
Figure 1. Power BI Desktop start window
When starting Power BI Desktop asks you to specify a data source or select one of recent sources. By the way, regarding sources - it is possible to connect to a large number of them, including online and local sources. For example, Google Analytics. In our case, all reports are stored in one folder, so we will select “Folder” as the source. Such a choice will allow further adding new reports to this folder and loading their data for analysis by clicking the Refresh button.
Figure 2. Choosing a data source
After clicking the "Connect" button, a preview window of the results of the query to the data source is displayed. You can load the data “as is” or switch to the query editing mode by clicking on the “Change” button. In most cases, the query results need to be processed.
Figure 3. Preview of the query results
After clicking the “Change” button, the “Query Editor” window automatically opens, in which you can and should perform data cleaning and preparation.
Figure 4. The query editor window
As you can see in the screenshot, Power BI Desktop uploaded files from the folder and the main meta-information. Delete all columns except “Content”, “Name” and “Extension”. Since the file name shows which year the corresponding report belongs to, we use it for this.
If you click on any row in the “Content” column, Power BI Desktop will open the contents of the corresponding workbook. Please note that in the "Request Parameters" section, all completed steps are recorded and can be changed or deleted. If you open the “Advanced Editor” window, a window will open in which the program code for all the actions performed will be visible. Yes, Power BI Desktop has its own programming language “M” and this is very cool.
Figure 5. Advanced query editor
Since the report requires the contents of all Excel files in the folder, and not just one, I will delete the last two steps and use some functions of the “M” language to parse the contents of Excel books from the folder.
Before further processing the data, you also need to consider that not only Excel files can be loaded into the folder. Therefore, you need to apply a filter to the “Extension” column, which will eliminate unnecessary file types.
Figure 6. Filter application
Now you need to “extract” the contents of the Excel workbooks. To do this, I will add a new column using the Excel.Workbook function, which allows you to “extract” the contents of Excel workbooks. The new column contains the values of the "Table" type, which allows you to "expand" its contents into several other columns. When “deploying”, you can choose which columns will be displayed. In this case, the “Data” and “Item” columns bear the semantic load.
Figure 7. Adding a custom column.
The “Data” column contains data from Excel worksheets, and in the future I use “Name” and “Item” for timestamps.
Since the “Name” column contains data of the form yyyy.xlsx, where yyyy is the year of the report, we perform a simple operation to separate the data in the column. Separation can be performed both by the number of characters and by the separator. In this case, the column must be divided by the separator.
Figure 8. Column split
Figure 9. Column split settings window
After you split a column, you will need to rename it.
Figure 9. The column splitting settings window
Figure 10. The query prepared for “deployment” query
Then I “expand” the Data column and see the contents of all Excel files and sheets, in a form that is not suitable for building the final reporting. But I can use the Power BI Desktop features to clear the data.
Figure 11. A query after “deploying” the contents of the files
1. I use the top rows as headers and then rename the columns. I will delete the columns "Actual deviation" and "Deviation in%". We will recount them later.
2. I will delete the lines that contain empty values and the “Indicator” value in the “Indicator” column, applying filtering. In the same way, I delete the lines that contain the total values, for example, “Total CHOD”, “Total”, etc.
Figure 12. Filtering data menu
3. Using the “Replace Values” function, I will replace synonyms, for example, “Income” and “Income”.
Figure 13. Replacing Values
4. Having examined the contents of the “Indicator” column a little more, I find that all of my income relates to the “Income” or “Income” indicator. Everything else relates to costs, which greatly facilitates the task. For the convenience of further processing and filtering, we will create a “Category” column, which will contain the value “Income” if the word “Income” is present in the column “Indicator”, and in all other cases takes the value “Expense”.
Figure 14. Adding the “Category” column
5. Next, I need to indicate that the type of values in the “Plan” and “Fact” columns is a decimal number. But before that, I need to remove spaces from the contents of these columns.
6. After the operation is completed, I check the columns for errors and negative values. Since in our case the presence of a negative value means an input error, using the value conversion function I highlight the absolute value in the “Plan” and “Fact” columns. This completes the basic data cleansing.
7. In order to display indicators with a time reference, you must specify a date for each record. The table contains the month in text form and the year. For convenience, we assume that the data is displayed at the end of each month. Here we are faced with a problem - the language "M" does not currently allow us to convert the names of months into dates. Therefore, you will need to take several intermediate steps.
8. Create a new query that will contain the names of the months and their numbers. To do this, create an empty request, open the advanced editor and paste the following code: Figure 15. Adding an empty request 9. I go to the Plan-Fact request and merge the requests by selecting the desired type of association. Figure 16. Consolidation of queries 10. The data from the query “Months” was added as a new column. I open it and now we have all the data for the formation of the date. I create a new column called “Date” using the formula: = Date.EndOfMonth (#date ([Year], [Index], 1)) The column is added and it contains the last day of each month. In order for Power BI Desktop to be able to group dates by months and years, you will need to explicitly set the type to “Date”. Figure 17. Adding the “Date” column
let

 Source = {"январь", "февраль", "март", "апрель", "май", "июнь", "июль", "август", "сентябрь", "октябрь", "ноябрь", "декабрь"},

 #"Converted to Table" = Table.FromList(Source, Splitter.SplitByNothing(), null, null, ExtraValues.Error),

 #"Added Index" = Table.AddIndexColumn(#"Converted to Table", "Index", 0, 1),

 #"Added to Column" = Table.TransformColumns(#"Added Index", {{"Index", each List.Sum({_, 1})}}),

 #"Renamed Columns" = Table.RenameColumns(#"Added to Column",{{"Column1", "Месяц"}})

in

 #"Renamed Columns"
11. Delete the columns Index, Year and Month. We don’t need them anymore. Then you need to click on the “Close and Download” button to proceed to the modeling and visualization of the data.
This completes the basic part of data processing and you can proceed to visualization. The possibilities of data visualization in Power BI Desktop will be discussed in the next part .