Pitfalls of A / B testing or why 99% of your split tests are carried out incorrectly?

The “hot” and often discussed topic of conversion optimization has led to the unconditional popularization of A / B testing, as the only objective way to find out the truth about the performance of certain technologies / solutions related to increasing economic efficiency for online businesses.
Behind this popularity lies the almost complete lack of culture in organizing, conducting and analyzing experimental results. At Retail Rocket, we have gained great expertise in evaluating the cost-effectiveness of personalization systems in e-commerce. For two years, the ideal process for conducting A / B tests was rebuilt, which we want to share in the framework of this article.
Two words about the principles of A / B testing
In theory, everything is incredibly simple:
- We hypothesize that some kind of change (for example, personalization of the main page ) will increase the conversion of the online store.
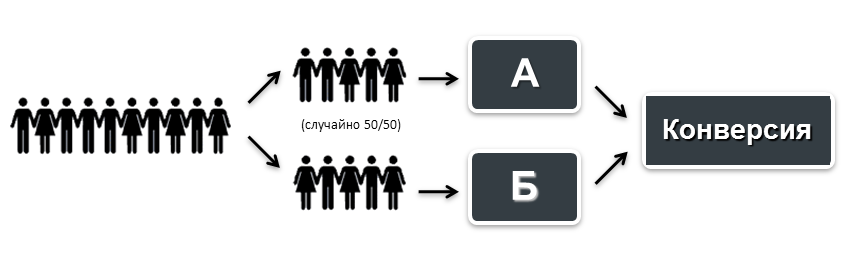
- We create an alternative version of the site “B” - a copy of the original version “A” with the changes, from which we expect the site to grow in efficiency.
- All visitors to the site are randomly divided into two equal groups: one group shows the original version, the second - alternative.
- At the same time, we measure the conversion for both versions of the site.
- We determine the statistically significantly winning option.
The beauty of this approach is that any hypothesis can be verified using numbers. There is no need to argue or rely on the opinion of pseudo-experts. We started the test, measured the result, and moved on to the next test.
Example in numbers
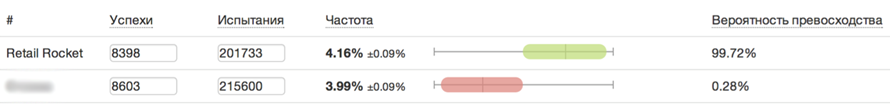
For example, imagine that we made a change to the site, launched an A / B test and received the following data:
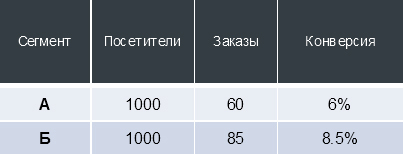
Conversion is not a static value, depending on the number of “trials” and “successes” (in the case of an online store - visits to the site and placed orders, respectively), the conversion is distributed in a certain interval with an estimated probability.

For the table above, this means that if we bring 1000 more users to the version of the site “A” under constant external conditions, then with a probability of 99% these users will place 45 to 75 orders (that is, they will be converted to customers with a ratio from 4.53% to 7.47 %).
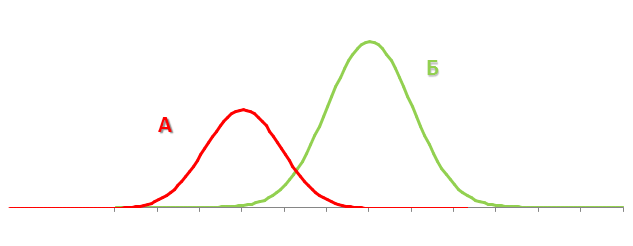
This information alone is not very valuable, however, when conducting an A / B test, we can get 2 conversion distribution intervals. Comparison of the intersection of the so-called “confidence intervals” of conversions received from two segments of users interacting with different versions of the site allows us to make a decision and state that one of the tested versions of the site is statistically significantly superior to the other. Graphically, this can be represented as follows:
Why are 99% of your A / B tests wrong?
So, the majority of people are already familiar with the above-described concept of conducting experiments, they talk about it at industry events and write articles. In Retail Rocket , 10-20 A / B tests are simultaneously taking place, over the past 3 years we have encountered a huge number of nuances that often go unnoticed.
There is a huge risk in this: if the A / B test is carried out with an error, then the business is guaranteed to make the wrong decision and receive hidden losses. Moreover, if you previously performed A / B tests, then most likely they were carried out incorrectly.
Why? We will analyze the most common mistakes that we encountered in the process of conducting many post-test analyzes of the results of experiments when introducing Retail Rocket into our customers ’online stores.
Audience Share in Test
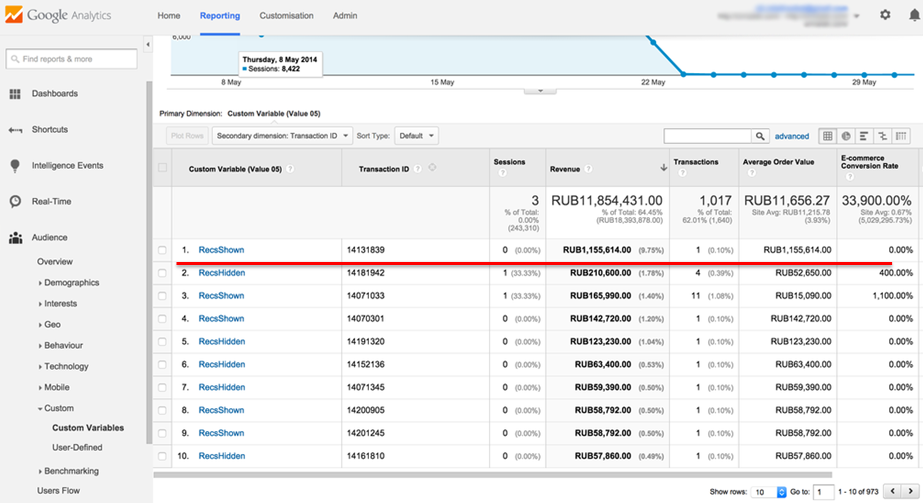
Perhaps the most common mistake is that when you start testing, it is not verified that the entire audience of the site is involved in it. A pretty common life example (screenshot from Google Analytics):
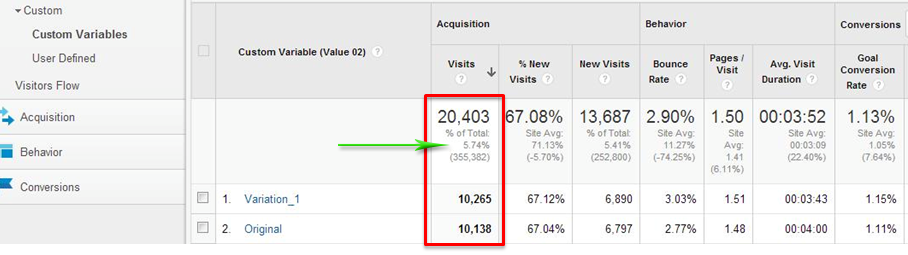
The screenshot shows that in total a little less than 6% of the audience took part in the test. It is imperative that the entire audience of the site belong to one of the test segments, otherwise it is impossible to assess the impact of the change on the business as a whole.
The uniformity of the distribution of the audience between the tested variations
It is not enough to distribute the entire audience of the site into test segments. It is also important to do this evenly across all slices. Consider the example of one of our customers:
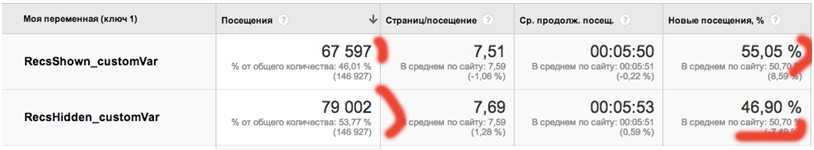
We are faced with a situation in which the audience of the site is divided unevenly between segments of the test. In this case, a 50/50 traffic division was set in the tool settings for testing. Such a picture is a clear sign that the tool for traffic distribution is not working as expected.
In addition, pay attention to the last column: it is clear that the second segment gets more repeated, and therefore more loyal, audience. Such people will make more orders and distort test results. And this is another sign of incorrect testing tool.
To eliminate such errors a few days after the start of testing, always check the uniformity of traffic division across all available slices (at least by city, browser and platform).
Filtering employees online store
The next common problem is associated with employees of online stores, who, having got into one of the test segments, place orders received by phone. Thus, employees form additional sales in one segment of the test, while callers are in all. Of course, such anomalous behavior will ultimately distort the final results.
Call center operators can be identified using a report on networks in Google Analytics:

 The screenshot is an example from our experience: a visitor 14 times visited a website from a network called "Electronics Shopping Center on Presnya" and placed an order 35 times - this is a clear behavior of a store employee who, for some reason, placed orders through a basket on the website, and not through the store admin panel.
In any case, you can always upload orders from Google Analytics and assign them the property “issued by the operator” or “issued by the operator”. Then build a pivot table as in the screenshot, reflecting another situation that we encounter quite often: if we take the revenue of the RR and Not RR segments (“a site with Retail Rocket” and “without”, respectively), then a “site with Retail Rocket” brings less money than without. But if we single out orders placed by call-center operators, it turns out that Retail Rocket gives a 10% increase in revenue.
What indicators should you pay attention to in the final evaluation of the results?
Last year, an A / B test was conducted, the results of which were as follows:
- + 8% to conversion in the “site with Retail Rocket” segment.
- The average check practically did not change (+ 0.4% - at the level of error).
- Revenue growth + 9% in the “Website with Retail Rocket” segment.
After reporting the results, we received the following letter from the client:
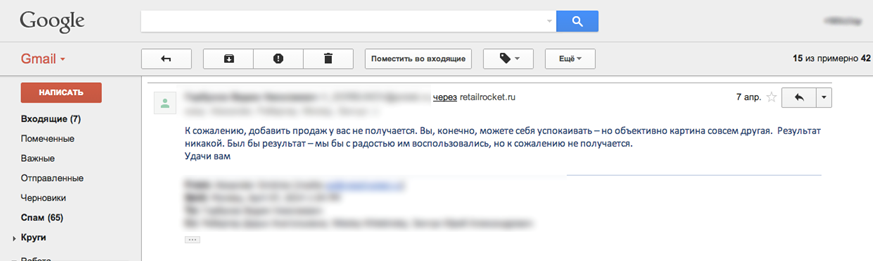
The manager of the online store insisted that if the average check has not changed, then there is no effect from the service. At the same time, the fact of total revenue growth due to the recommendation system is completely ignored.
So what indicator should you focus on? Of course, the most important thing for business is money. If in the framework of the A / B test traffic was divided evenly between segments of visitors, then the necessary indicator for comparison is revenue for each segment.
In life, not a single tool for randomly dividing traffic gives absolutely equal segments, there is always a difference in the percentage percentage, therefore it is necessary to normalize revenue by the number of sessions and use the “revenue per visit” metric.
This is a recognized KPI in the world, which we recommend focusing on when conducting A / B tests.
It is important to remember that the revenue from orders placed on the site and the “completed” revenue (revenue from actually paid orders) are completely different things.
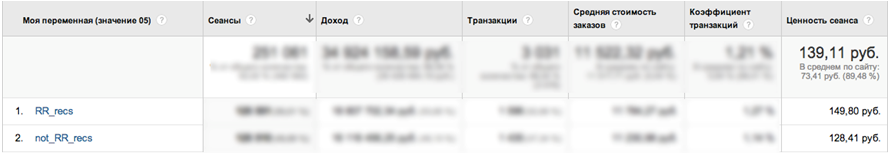
Here is an example of an A / B test in which the Retail Rocket system was compared with another recommendation system:

The non-Retail Rocket segment wins in all respects. However, in the next stage of the post-test analysis, call-center orders and canceled orders were excluded. Results:

Post-test analysis of results - a must when conducting A / B testing!
Data slices
Working with different data slices is an extremely important component in post-test analysis.
Here is another Retail Rocket test case at one of the largest online stores in Russia:
At first glance, we got an excellent result - revenue growth + 16.7%. But if you add an additional data slice “Device Type” to the report , you can see the following picture:
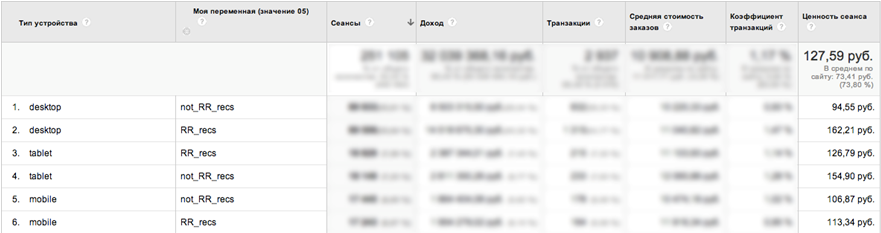
- Desktop traffic revenue growth of almost 72%!
- On tablets in the Retail Rocket segment, drawdown.
As it turned out after testing, the Retail Rocket recommendation blocks were not displayed correctly on the tablets.
It is very important in the framework of the post-test analysis to build reports at least in the context of the city, browser and user platform, so as not to miss such problems and maximize results.
Statistical Reliability
The next topic to be addressed is statistical validity. Making a decision about introducing changes to the site is possible only after achieving statistical reliability of superiority.
To calculate the statistical reliability of a conversion, there are many online tools, for example, htraffic.ru/calc/ :
But conversion is not the only indicator that determines the economic efficiency of a site. The problem with most A / B tests today is that only the statistical validity of the conversion is checked, which is insufficient.
Average check
The online store’s revenue is built from conversion (the share of people who buy) and from the average check (purchase size). It is more difficult to calculate the statistical reliability of the change in the average check, but without this in any way, otherwise incorrect conclusions are inevitable.
The screenshot shows another example of the Retail Rocket A / B test, in which an order worth more than a million rubles fell into one of the segments:
This order is almost 10% of the total revenue for the test period. In this case, when the statistical reliability of the conversion is achieved, can the revenue results be considered reliable? Of course not.
Such huge orders significantly distort the results, we have two approaches to post-test analysis in terms of the average bill:
- Complicated. " Bayesian statistics ", which will be discussed in future articles. In Retail Rocket, we use it to assess the reliability of the average check of internal tests for optimizing recommendation algorithms.
- Plain. Cutting off several percentiles of orders above and below (usually 3-5%) of a list sorted in descending order amount.
Test time
And finally, always pay attention to when you run the test and how long it lasts. Try not to run the test a few days before major gender holidays and on holidays / weekends. Seasonality is also seen at the level of salaries: as a rule, this stimulates sales of expensive goods, in particular, electronics.
In addition, there is a proven relationship between the average check in a store and the time it takes to make a decision before buying. Simply put, the more expensive the goods - the longer they choose. The screenshot shows an example of a store in which 7% of users think for 1 to 2 weeks before buying:
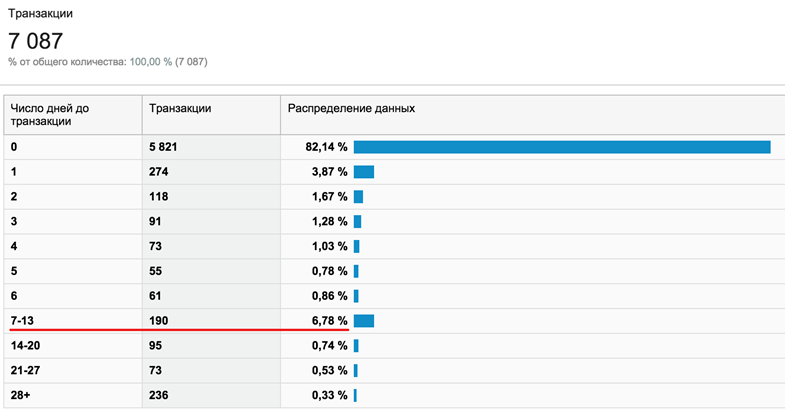
If you conduct an A / B test in such a store for less than a week, then about 10% of the audience will not fall into it and the impact of a change on the site on the business cannot be clearly estimated.
Instead of output. How to conduct a perfect A / B test?
So, to eliminate all the problems described above and conduct the correct A / B test, you need to perform 3 steps:
1. Split traffic
50/50 Difficult: using a traffic balancer.
Simple: Use the open source Retail Rocket Segmentator library , which is supported by the Retail Rocket team. For several years of testing, we were not able to solve the problems described above in tools like Optimizely or Visual Website Optimizer.
The goal in the first step:
- Get an even distribution of the audience across all available sections (browsers, cities, traffic sources, etc.).
- 100% of the audience should get into the test.
2. Carry out an A / A test
Without changing anything on the site, transfer to Google Analytics (or another web analytics system that you like) different user segment identifiers (in the case of Google Analytics - Custom var / Custom dimension).
The goal in the second step: not to get a winner, i.e. in two segments with the same version of the site there should be no difference in key indicators.
3. Post-test analysis
- Exclude company employees.
- Cut off extreme values.
- Check the significance of the conversion value, use data on the execution and cancellation of orders, i.e. consider all cases mentioned above.
The goal in the last step: make the right decision.
Share your A / B test cases in the comments!