Illusion of deception: visual-optical illusion based on retro-prediction
The human brain is often called the most complex biological computer in the world. Scientists from all over the world continue to study this incredibly mysterious body, discovering more and more new features, functions, capabilities, and so on. As we know, many sciences, and therefore their research, are related to each other. Therefore, the study of the human brain allows you to improve and technology is not associated with its anatomy. Today we look at a new study of the brain, in which scientists are experiencing new ways of cheating. We perceive the world around us at the expense of information processed by the brain. Everything that we see, hear, smell, taste and touch consists of a certain set of signals that our senses perceive, and the brain processes. But what if these signals are false, or rather they will not be at all, and the brain will be sure that what are they? This is what will be discussed in today's study. Go.
The basis of the study
We are all familiar with the concept of optical illusion. This phenomenon can be associated with both physical phenomena (the refraction of light: a spoon in a glass of water) and errors in the perception of information by our brain. Let us leave physics aside, although it is present everywhere and always (as in the DMB film: “Do you see a gopher? And I don’t see, but he is”). Erroneous perception of the data of the surrounding world is of different forms and types. Most often, of course, we hear and read precisely about visual illusions. The researchers claim that one of the main reasons for most illusions is such a thing as retrocasting, when the brain predicts the past, so to speak. It sounds a little strange to predict what has already happened. But here neurobiology comes to light and explains everything to us. In the relatively recent 2000, David Eagleman, a neuroscientist at Stanford University,
A little easier to understand this phenomenon is possible by the example of the illusion with flash, which you see below.

Another version of the same illusion, but in the video
Take a close look at the animation. Do not hurry. What do you see? More precisely, where do you see? Does the green square appear parallel to the red or deviate slightly from it? If you see both squares parallel to each other when green appears, congratulations, you are from the planet Krypton.
Eagleman and Seinowski argue that perception (perception, who loves more elaborate terms) does not occur before the event (the appearance of a green square) or during the event, but after 80 ms after the event. In this case, the brain should perceive two “signals”: the position of the red square and the position of the emerging green. The theory of reverse masking states that the perception of a visual stimulus deteriorates due to the masking stimulus that appears immediately after the main one. That is, the appearance of a green square prevents our brain from fully determining the position of red, due to which it turns out that they are not parallel to each other. This theory confirms the phenomenon of retro-prediction.
These illusions are based, as we have already understood, solely on the errors in the perception of visual information by our brain. In the study we are discussing today, the scientists decided to add sound, in addition to visual stimuli, in order to understand whether reverse masking can be applied when the main and masking stimuli do not fall into a general category.
Preparation for the study
During the study, two types of experiments were conducted. The first type is the illusion of a visual stimulus, and the second is the suppression of the visual stimulus.
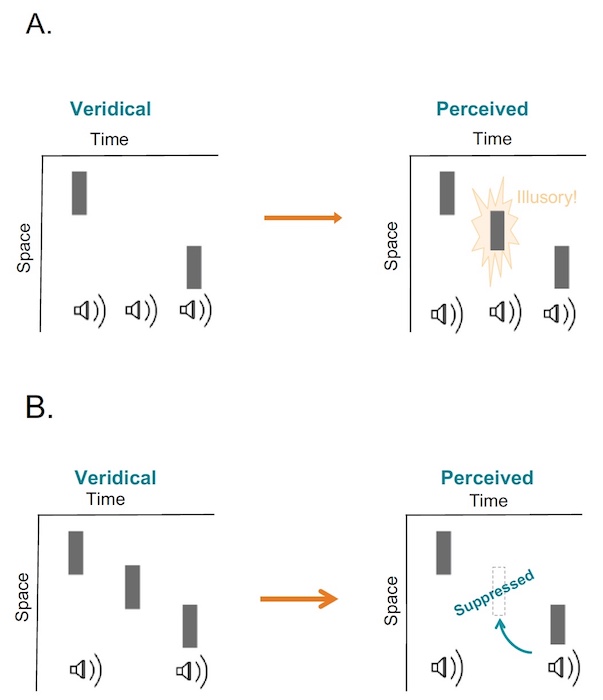
Image No. 1
The images above show a schematic representation of incoming stimuli (left) and perceived by the subjects (right). Gray rectangles are light flashes that appear at the same time as a sound signal.
Option AThis is the first type of experiment. As you can see, there are 2 flashes and 3 beeps, but the subjects see 3 flashes.
Option B is the second type of experiment. There are 3 flashes and only 2 beeps, and the subjects see only 2 flashes.
As guinea pigs (sorry for cynicism), there were 13 people: 4 men and 9 women. The researchers note that they did not tell the subjects all the details of the experiments, but only asked to count how many flashes they see. Thus, scientists wanted to increase the degree of objectivity and accuracy of the results.
The setup of the experiment was quite simple. The subjects sat in front of the monitor with a refresh rate of 60 Hz at a distance of 57 cm. Their head was located on a chin rest, in order to ensure a relatively equal position in front of the monitor. The lighting in the room was muffled, which also accompanied a more efficient perception of visual stimuli appearing on the monitor during the experiments.

The setup of experiments
The difference between the screen background and visual stimuli (flashes of gray rectangles) is in brightness: the background is 30%, and the rectangles are 80%. Each of the visual flashes appeared on the screen at exactly 17 ms.
Sound stimuli were reproduced through two speakers on the sides of the monitor. The duration of the audio signals (800 Hz) was 7 ms.
A 23-second interval was established between the audible signals and the visuals in order to level the possible difference in the speed of perception in different subjects.
In their report, the researchers present each experiment in the form of NbMf, where Nb is the number of audio signals, and Mf is the number of flashes. That is, 2b4f is 2 beeps and 4 flashes.
The experiments with the subjects were divided into several main stages:
Stage I : counting flares.
Participation was attended by 7 subjects, who were given 6 experience options:
- 0b2f — вспышка слева, пауза, вспышка справа;
- 2b2f — вспышка слева + звук, пауза, вспышка справа + звук;
- 3b2f — вспышка слева + звук, звук, вспышка справа + звук;
- 0b3f — вспышка слева, вспышка по центру, вспышка справа;
- 2b3f — вспышка слева + звук, вспышка по центру, вспышка справа + звук;
- 3b3f — вспышка слева + звук, вспышка по центру + звук, вспышка справа + звук.
Each of the variants of the experiment was carried out 25 times. The subjects were supposed to record the number of flashes that they saw in each of the experiments.
Stage II : Determination of the position of an illusory flash.
Only 8 participants and 4 variants of experiences:
- 0b2f — вспышка слева, пауза, вспышка справа;
- 2b2f — вспышка слева + звук, пауза, вспышка справа + звук;
- 3b2f — вспышка слева + звук, звук, вспышка справа + звук;
- 3b3f — вспышка слева + звук, вспышка по центру + звук, вспышка справа + звук.
In a random order, a total of 100 such experiments were carried out. The subjects also recorded the number of flashes, and also indicated the position of each of the flashes perceived by them on the monitor. In this way, it was possible to determine the subjects' perception of non-existent (illusory) flashes.
Stage III : preliminary knowledge of the location of incentives and their directions. Also, 8 participants were randomly selected, and the options for the experiments were again six
(three in the direction from left to right and vice versa, from right to left):
- 0b2f — вспышка слева, пауза, вспышка справа;
- 2b2f — вспышка слева + звук, пауза, вспышка справа + звук;
- 3b2f — вспышка слева + звук, звук, вспышка справа + звук;
At this stage, 15 experiments were carried out for each of the directions, with the first flash always being in the center of the screen, while the others appeared either to the right or to the left in a random order. Subjects again recorded the number of flashes and their direction.
Stage IV : eccentricity. Participation was 5 subjects.
Variations of the experiment was 6:
- 0b2f — вспышка слева, пауза, вспышка справа;
- 2b2f — вспышка слева + звук, пауза, вспышка справа + звук;
- 3b2f — вспышка слева + звук, звук, вспышка справа + звук;
- 0b3f — вспышка слева, вспышка по центру, вспышка справа;
- 2b3f — вспышка слева + звук, вспышка по центру, вспышка справа + звук;
- 3b3f — вспышка слева + звук, вспышка по центру + звук, вспышка справа + звук.
Each of the above options was run 25 times, while there was a different eccentricity angle (angle from the center of the eye): 4 °, 10 ° and 16 °. Changing this parameter allows you to determine the dependence of the appearance of an illusion on the viewing angle of the subject.
Stage V: degree of confidence. At this stage there were 8 participants and 6 variants of experience (see above). In addition to recording the number of flashes they saw, the subjects had to choose one of 4 options for the degree of confidence in their response. In this way, it was possible to determine the effect of cognitive distortion on the experiment. This phenomenon can be equated with the concept of subjectivism, when a person makes a choice or gives an answer depending on his own convictions, emotional or physical condition, etc. In other words, you remember how many tests related to psychoanalysis, in the beginning ask you not to think about the question and your answer, but to say the first thing that comes to mind. This is roughly the leveling of cognitive distortion.
Stage VI : retrocasting.
8 participants and three options of experiences:
- 1b2f — вспышка слева + звук, вспышка по центру;
- 2b3f — вспышка слева + звук, вспышка по центру, вспышка справа + звук;
- 2b3f — вспышка слева + звук, вспышка по центру + звук, вспышка справа.
As we can see, the second and third options are the same in terms of the number of beeps and flashes - 2b3f, but they differ in their position. All variants were tested 25 times each. This stage is aimed at determining the degree of importance of retrocasting in the process of perception of information.
Stage VII : suppression.
Eight participants passed this stage, and there were 4 options for the experience:
- 0b3f — вспышка слева, вспышка по центру, вспышка справа;
- 2b2f — вспышка слева + звук, вспышка справа + звук;
- 2b3f — вспышка слева + звук, вспышка по центру, вспышка справа + звук;
- 3b3f — вспышка слева + звук, вспышка по центру + звук, вспышка справа + звук.
A total of 100 experiments at this stage were carried out at random. Test participants recorded how much they saw the outbreaks and indicated their positions. This stage is necessary in order to understand whether one of the flashes is hiding or whether it merges with the next one.
Demonstration of an illusory audio-visual signal (subtitles added for convenience).
Demonstration of a suppressed (hidden) audio-visual signal (for added convenience, added subtitles).
Experimental Results

Graphs of the results of experiments with an illusory audio-visual signal.
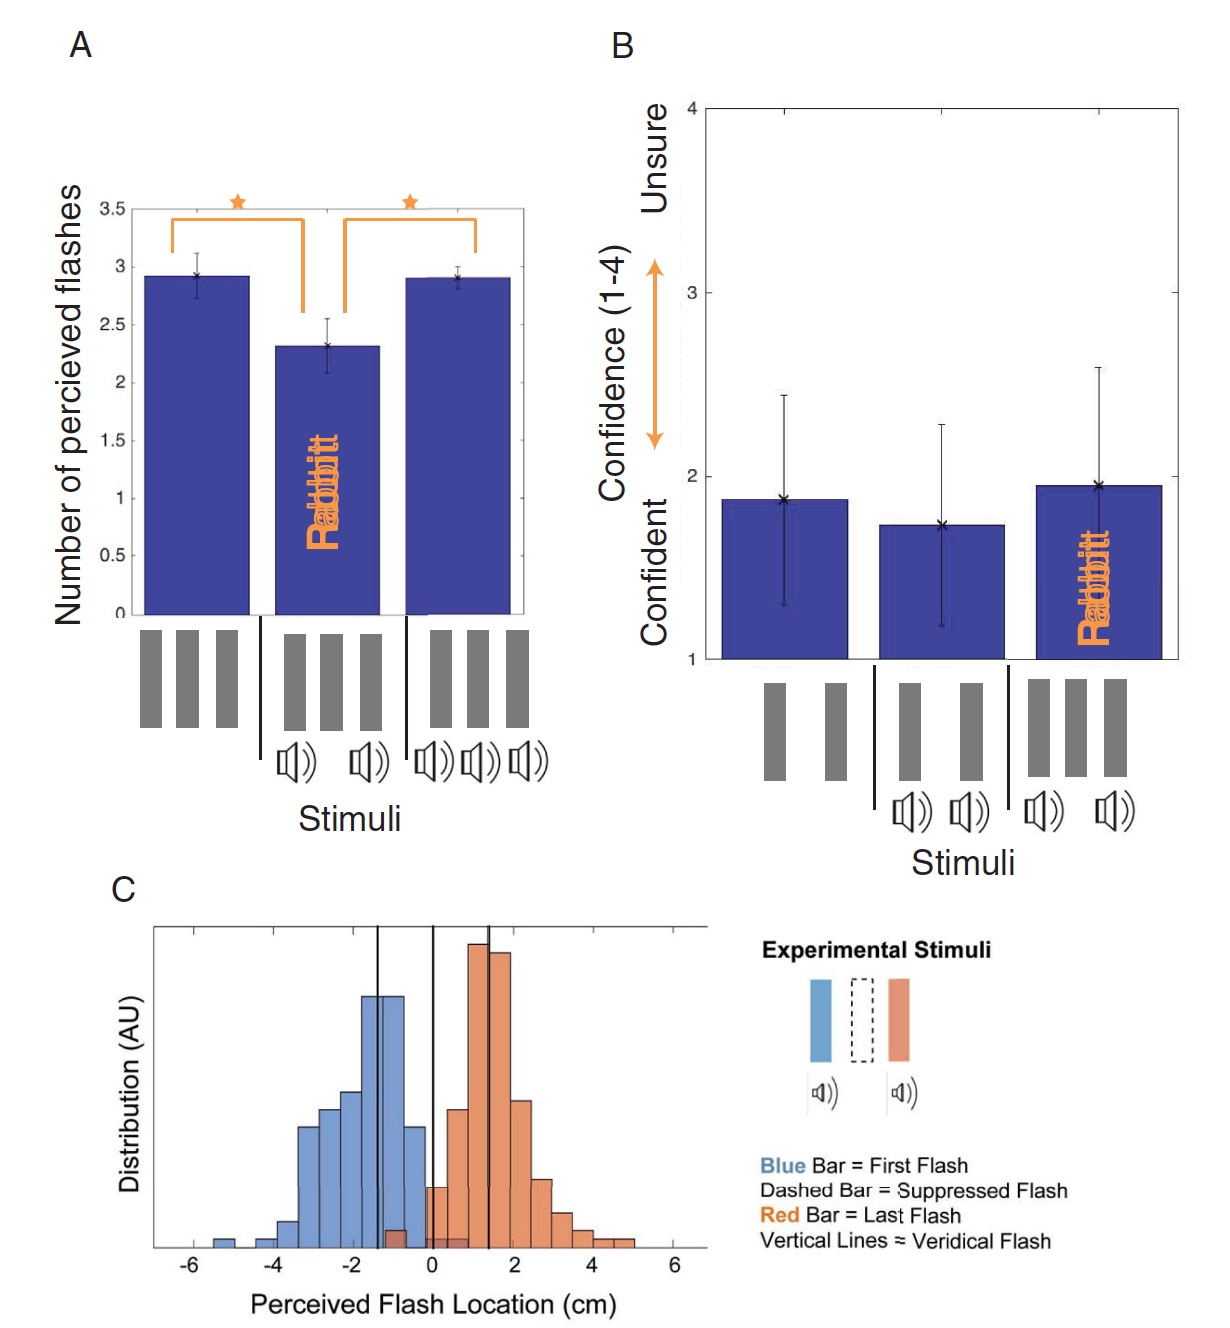
In graph A, we can see how many flashes were perceived by participants in experiments related to stage I. When the 3b2f model was used (3 beeps and 2 flashes), most of the subjects saw more flashes than when using the 2b2f model (2 beeps and only 2 real flashes). This suggests that an additional sound signal pushed the subjects to the fact that there were supposedly 3 flashes, when in reality there were only 2 of them.
The researchers also note that this result does not depend on the number of tests performed. That is, the results of the subjects in the first 50 visits and in the last 50 visits practically did not differ. Therefore, they did not adapt to the conditions of the tests, no matter how many times they repeated.
Schedule B shows the degree of confidence in his answers among the subjects. As we can see, regardless of the source data (the number of flashes and sound signals, as well as variations of their combination), the degree of confidence in all cases is about the same.
Finally, Schedule C. It demonstrated how the subjects distributed the outbreaks, that is, where they appeared in their opinion (right or left). The results say that the perception of outbreaks also depends on which side they appear (from left to right or from right to left). When the subjects saw three flashes, most of them indicated that the first and the third were far away from each other, and the second was located relatively centrally. Although, naturally, there was no second flash in reality at all. And the distance between the real did not change during the experiments. That is, the presence of an illusory flash pushed the two real ones further away from each other.
Graphs of the results of experiments hidden (suppressed) audio-visual signal.
Above are the graphs of the results of the reverse experiment, when the subjects did not perceive the real flash. In the case of the 2b3f model (2 beeps and 3 flashes), the vast majority of the subjects saw only 2 flashes, whereas with the 0b3f model - all three flashes. This suggests that the beep, as a masking stimulus, blocks one of the flashes, which prevents its normal perception by the brain. Whereas, in the absence of sound signals, nothing distracts the brain to fully perceive all real flashes. As can be seen from graph A , the results of the subjects for models 2b3f, 3b3f and 0b3f are almost identical.
Schedule B also speaks of a fairly high degree of confidence in his answers among the subjects.
An analysis of the results of the 2b3f model (2 beeps and 3 flashes) among the subjects who saw only 2 flashes (instead of the real three) showed that most participants saw the first and third flashes where they were in reality (Graph C ).
It turns out that the presence of a non-existent flash pushes real flares away from their real positions in opposite directions. In the case of suppression of the perception of the second flash, the perceived position of the flashes does not differ from their actual position.
For more detailed acquaintance with the study, in particular with statistical data of experiments, I recommend to get acquainted with the report of the research group, available here .
Epilogue
This study showed that sound signals can serve as masking stimuli that overlap the perception of a real stimulus. At the same time, the use of sound signals can lead to the perception of illusory visual stimuli that are absent in reality.
The human brain stores and processes a huge amount of data. All actions (from the flap of a hand to the birth of a new cell), all that we see, hear, smell, and touch this information that needs to be processed before responding. Sometimes the brain can be deceived. And today, researchers have shown a new method to achieve this. Such studies, despite their fun at first glance, are very important for expanding the boundaries of man’s knowledge of himself. For the brain and to this day remains very little studied "object", along with the depths of the oceans and expanses of the universe.
Thank you for staying with us. Do you like our articles? Want to see more interesting materials? Support us by placing an order or recommending friends30% discount for users of Habr on a unique analogue of entry-level servers that we invented for you: The whole truth about VPS (KVM) E5-2650 v4 (6 Cores) 10GB DDR4 240GB SSD 1Gbps from $ 20 or how to share the server? (Options are available with RAID1 and RAID10, up to 24 cores and up to 40GB DDR4).
VPS (KVM) E5-2650 v4 (6 Cores) 10GB DDR4 240GB SSD 1Gbps until December for free if you pay for a period of six months, you can order here .
Dell R730xd 2 times cheaper? Only we have 2 x Intel Dodeca-Core Xeon E5-2650v4 128GB DDR4 6x480GB SSD 1Gbps 100 TV from $ 249 in the Netherlands and the USA! Read aboutHow to build the infrastructure of the building. class c using servers Dell R730xd E5-2650 v4 worth 9000 euros for a penny?