June 8, 2015 at 16:27
Big Data and Machine Learning Stock Prediction
- Transfer
Translator’s note: In our blog, we already talked about tools for creating trading robots and even analyzed the dependencies between the name of a company’s stock ticker and the success of its shares. Today we bring to your attention a translation of an interesting article, the author of which developed a system that analyzes changes in stock prices in the past and, using machine learning, tries to predict the future stock price.
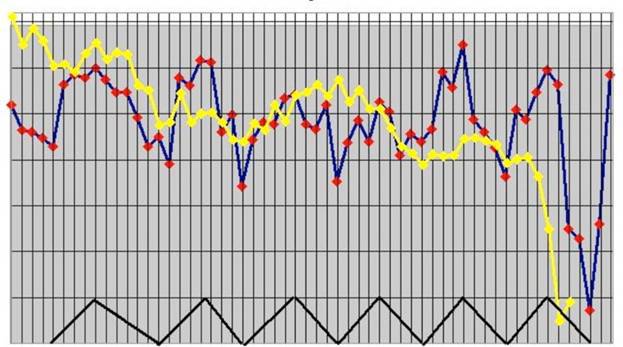
This post is based on an article entitled “Modeling the Dynamics of a High-Frequency Portfolio of Limit Orders by the Reference Vector Method”. Roughly speaking, I implement the ideas presented in this article step by step using Spark and Spark MLLib . The authors use abbreviated examples, but I will use the full order journal from the New York Stock Exchange ( NYSE ) (sample data is available on NYSE FTP ), since working with Spark I can easily do this. Instead of using the support vector method, I will use the decision tree algorithm for classification, since Spark MLLib initially supports multiclass classification.
If you want to better understand the problem and the proposed solution, you need to read that article. I will conduct a full review of the problem in one or two sections, but in a less scientific language.
Predictive modeling is the process of selecting or creating a model whose purpose is to most accurately predict the possible outcome.
The authors propose a framework for extracting feature vectors from an unformatted order journal, which can be used as a set of input data for a classification method (for example, the support vector method or constructing a decision tree) to predict a change in the price of securities (it will increase, decrease, and will not change). Based on a set of test data with labels assigned to them (price change), the classification algorithm builds a model that places new instances in one of the predefined categories.
In the table, each line represents a trading operation, which reflects the receipt of the order, the cancellation of the order or its execution. Arrival times are counted from midnight in seconds and nanoseconds, the price is in US dollars and the volume is in the number of shares. Ask means that I sell and ask for the indicated price for my part of the shares, Bid means that I want to buy at the indicated price.
From this magazine, it is very easy to restore the state of the order portfolio after each completed operation. You can learn more about the orders portfolio (order book) and portfolio limit orders to Investopedia. I will not go into details. The general idea is very simple and straightforward.
This is an electronic list of sell and buy orders for a particular security or financial instrument, sorted by price level.
After the order portfolios are restored from the order journal, we can extract the attributes and form the feature vectors that will be used as input for
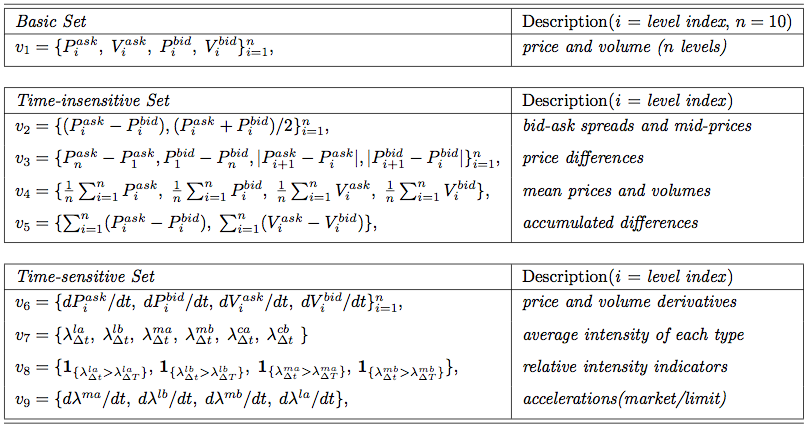
Attributes are divided into three categories: basic, time-insensitive and time-sensitive. Each of the categories can be calculated directly on the basis of the data obtained. Basic attributes are prices and volumes, both with the ask flag and the bid flag, in the amount of n = 10 different levels (they are the price levels of the order portfolio at a given moment), which can be directly obtained from the order portfolio. Time-insensitive attributes can be easily calculated at a single point in time using the attributes of the base set. This includes the bid-ask spread and the average price of the spread, price ranges, as well as the average price and volume at various price levels, which are calculated in the sets of signs
The preparation of test data for machine learning requires the labeling of each point in time within which a change in the value of the shares is observed (1 second, for example). This is a simple task that requires only two order portfolios: the current order portfolio and the order portfolio, formed after some time.
I will use a label
I will use NYSE TAQ OpenBook order magazines and parse them using the Scala OpenBook library . A free dataset for two trading days is available for download on the NYSE FTP - it is very easy to get.
The TAQ (Trades and Quotes) databases provide time-varying values of the price glass in the T + 1 basis for closed markets. The results of TAQ data processing are used in the development and testing of trading strategies, analysis of market trends on real data and market research for the purpose of monitoring or conducting an audit.
I use tools
As defined in the original article, we have three sets of attributes. The values of the first two of them are calculated on the basis of the data
And here is the calculation of signs:
To extract labeled data from orders, I use
and this is how it can be improved with the help of a builder:
In a “real” application, I use 36 attributes from all 3 sets. Tests are run with examples of data downloaded from NYSE FTP:
Classification results by the decision tree construction method for a single ticker
As you can see, this fairly simple model was able to successfully classify approximately 70% of the data.
Note : Despite the fact that the model works very well, this does not mean that it can be successfully used to build a profitable automated trading strategy. First, I do not check whether my model predicts any price changes with an accuracy of an average of 70% with a 95% probability. The model does not measure the “intensity” of the dynamics of securities prices, in addition, in reality, the model should work efficiently enough to cover transaction costs. Not to mention other details that are important for building a real trading system.
In fact, much can be done to improve the system and verify the results. Unfortunately, it is very difficult to get enough data: the data for two trading days is not enough to draw conclusions and begin to create a system that can make all the money in the world. However, I think this is a pretty good starting point.
I relatively easily conducted a rather complex research project on a larger scale than the one described in the original article.
Recent technologies in the field of big data allow you to create models using all available information without the use of samples. Using all the information helps to create the best models and highlight all the details from the complete data set.
Short review
This post is based on an article entitled “Modeling the Dynamics of a High-Frequency Portfolio of Limit Orders by the Reference Vector Method”. Roughly speaking, I implement the ideas presented in this article step by step using Spark and Spark MLLib . The authors use abbreviated examples, but I will use the full order journal from the New York Stock Exchange ( NYSE ) (sample data is available on NYSE FTP ), since working with Spark I can easily do this. Instead of using the support vector method, I will use the decision tree algorithm for classification, since Spark MLLib initially supports multiclass classification.
If you want to better understand the problem and the proposed solution, you need to read that article. I will conduct a full review of the problem in one or two sections, but in a less scientific language.
Predictive modeling is the process of selecting or creating a model whose purpose is to most accurately predict the possible outcome.
Model architecture
The authors propose a framework for extracting feature vectors from an unformatted order journal, which can be used as a set of input data for a classification method (for example, the support vector method or constructing a decision tree) to predict a change in the price of securities (it will increase, decrease, and will not change). Based on a set of test data with labels assigned to them (price change), the classification algorithm builds a model that places new instances in one of the predefined categories.
Time(sec)            Price($)   Volume      Event Type      Direction
- - - - - - - - - - - - - - - - - - - - - - - - - - - - - - - - - - -
34203.011926972      598.68     10          submission      ask
34203.011926973      594.47     15          submission      bid
34203.011926974      594.49     20          submission      bid
34203.011926981      597.68     30          submission      ask
34203.011926991      594.47     15          execution       ask
34203.011927072      597.68     10          cancellation    ask
34203.011927082      599.88     12          submission      ask
34203.011927097      598.38     11          submission      ask
In the table, each line represents a trading operation, which reflects the receipt of the order, the cancellation of the order or its execution. Arrival times are counted from midnight in seconds and nanoseconds, the price is in US dollars and the volume is in the number of shares. Ask means that I sell and ask for the indicated price for my part of the shares, Bid means that I want to buy at the indicated price.
From this magazine, it is very easy to restore the state of the order portfolio after each completed operation. You can learn more about the orders portfolio (order book) and portfolio limit orders to Investopedia. I will not go into details. The general idea is very simple and straightforward.
This is an electronic list of sell and buy orders for a particular security or financial instrument, sorted by price level.
Extract feature vectors and prepare test data
After the order portfolios are restored from the order journal, we can extract the attributes and form the feature vectors that will be used as input for
классификационной модели.Attributes are divided into three categories: basic, time-insensitive and time-sensitive. Each of the categories can be calculated directly on the basis of the data obtained. Basic attributes are prices and volumes, both with the ask flag and the bid flag, in the amount of n = 10 different levels (they are the price levels of the order portfolio at a given moment), which can be directly obtained from the order portfolio. Time-insensitive attributes can be easily calculated at a single point in time using the attributes of the base set. This includes the bid-ask spread and the average price of the spread, price ranges, as well as the average price and volume at various price levels, which are calculated in the sets of signs
v2, v3andv5respectively. Kit v5 is needed to track the cumulative difference in price and volume of shares between ask and bid. Then, given the significance of the data in previous periods, we calculate the parameters of the time-sensitive category. You can read more about attribute calculations in the original article .Test Data Markup
The preparation of test data for machine learning requires the labeling of each point in time within which a change in the value of the shares is observed (1 second, for example). This is a simple task that requires only two order portfolios: the current order portfolio and the order portfolio, formed after some time.
I will use a label
MeanPriceMovethat can take values Stationary, Upor Down(will not change, grow, decrease).trait Label[L] extends Serializable { label =>
def apply(current: OrderBook, future: OrderBook): Option[L]
}
sealed trait MeanPriceMove
object MeanPriceMove {
case object Up extends MeanPriceMove
case object Down extends MeanPriceMove
case object Stationary extends MeanPriceMove
}
object MeanPriceMovementLabel extends Label[MeanPriceMove] {
private[this] val basicSet = BasicSet.apply(BasicSet.Config.default)
def apply(current: OrderBook, future: OrderBook): Option[MeanPriceMove] = {
val currentMeanPrice = basicSet.meanPrice(current)
val futureMeanPrice = basicSet.meanPrice(future)
val cell: Cell[MeanPriceMove] =
currentMeanPrice.zipMap(futureMeanPrice) {
(currentMeanValue, futureMeanValue) =>
if (currentMeanValue == futureMeanValue)
MeanPriceMove.Stationary
else if (currentMeanValue > futureMeanValue)
MeanPriceMove.Down
else
MeanPriceMove.Up
}
cell.toOption
}
}
Order Logs
I will use NYSE TAQ OpenBook order magazines and parse them using the Scala OpenBook library . A free dataset for two trading days is available for download on the NYSE FTP - it is very easy to get.
The TAQ (Trades and Quotes) databases provide time-varying values of the price glass in the T + 1 basis for closed markets. The results of TAQ data processing are used in the development and testing of trading strategies, analysis of market trends on real data and market research for the purpose of monitoring or conducting an audit.
Test data preparation
OrderBook represents two sorted tables, where the key is the price and the value is the number of shares.case class OrderBook(symbol: String,
buy: TreeMap[Int, Int] = TreeMap.empty,
sell: TreeMap[Int, Int] = TreeMap.empty)
Parameter sets
I use tools
Cellfrom the library Framian to visualize the extracted characteristic values: Value, NAor NM. As defined in the original article, we have three sets of attributes. The values of the first two of them are calculated on the basis of the data
OrderBook, while the latter requires the creation of a table OrdersTrail, which is essentially an unformatted order journal, over which the window Fourier transform was performed.sealed trait BasicAttribute[T] extends Serializable { self =>
def apply(orderBook: OrderBook): Cell[T]
def map[T2](f: T => T2): BasicAttribute[T2] = new BasicAttribute[T2] {
def apply(orderBook: OrderBook): Cell[T2] = self(orderBook).map(f)
}
}
sealed trait TimeInsensitiveAttribute[T] extends Serializable { self =>
  def apply(orderBook: OrderBook): Cell[T]
  def map[T2](f: T => T2): TimeInsensitiveAttribute[T2] = new TimeInsensitiveAttribute[T2] {
    def apply(orderBook: OrderBook): Cell[T2] = self(orderBook).map(f)
  }
}
trait TimeSensitiveAttribute[T] extends Serializable { self =>
  def apply(ordersTrail: Vector[OpenBookMsg]): Cell[T]
  def map[T2](f: T => T2): TimeSensitiveAttribute[T2] = new TimeSensitiveAttribute[T2] {
    def apply(ordersTrail: Vector[OpenBookMsg]): Cell[T2] = self(ordersTrail).map(f)
  }
}
And here is the calculation of signs:
class BasicSet private[attribute] (val config: BasicSet.Config) extends Serializable {
  private[attribute] def askPrice(orderBook: OrderBook)(i: Int): Cell[Int] = {
    Cell.fromOption {
      orderBook.sell.keySet.drop(i - 1).headOption
    }
  }
  private[attribute] def bidPrice(orderBook: OrderBook)(i: Int): Cell[Int] = {
    Cell.fromOption {
      val bidPrices = orderBook.buy.keySet
      if (bidPrices.size >= i) {
        bidPrices.drop(bidPrices.size - i).headOption
      } else None
    }
  }
  private def attribute[T](f: OrderBook => Cell[T]): BasicAttribute[T] = new BasicAttribute[T] {
    def apply(orderBook: OrderBook): Cell[T] = f(orderBook)
  }
  def askPrice(i: Int): BasicAttribute[Int] = attribute(askPrice(_)(i))
  def bidPrice(i: Int): BasicAttribute[Int] = attribute(bidPrice(_)(i))
 val meanPrice: BasicAttribute[Double] = {
    val ask1 = askPrice(1)
    val bid1 = bidPrice(1)
    BasicAttribute.from(orderBook =>
      ask1(orderBook).zipMap(bid1(orderBook)) {
        (ask, bid) => (ask.toDouble + bid.toDouble) / 2
      })
  }
}
Labeling Test Data
To extract labeled data from orders, I use
LabeledPointsExtractor:class LabeledPointsExtractor[L: LabelEncode] {
def labeledPoints(orders: Vector[OpenBookMsg]): Vector[LabeledPoint] = {
log.debug(s"Extract labeled points from orders log. Log size: ${orders.size}")
// ...
}
}
and this is how it can be improved with the help of a builder:
val extractor = {
    import com.scalafi.dynamics.attribute.LabeledPointsExtractor._
    (LabeledPointsExtractor.newBuilder()
      += basic(_.askPrice(1))
      += basic(_.bidPrice(1))
      += basic(_.meanPrice)
      ).result(symbol, MeanPriceMovementLabel, LabeledPointsExtractor.Config(1.millisecond))
  }
Extractorwill prepare the marked points, using MeanPriceMovementLabelwith three characteristics: asking price (ask price), set price (bid price) and average price (mean price).Launch Classification Model
In a “real” application, I use 36 attributes from all 3 sets. Tests are run with examples of data downloaded from NYSE FTP:
EQY_US_NYSE_BOOK_20130403to train the model and EQY_US_NYSE_BOOK_20130404to verify proper operation.object DecisionTreeDynamics extends App with ConfiguredSparkContext with FeaturesExtractor {
private val log = LoggerFactory.getLogger(this.getClass)
case class Config(training: String = "",
validation: String = "",
filter: Option[String] = None,
symbol: Option[String] = None)
val parser = new OptionParser[Config]("Order Book Dynamics") {
// ....
}
parser.parse(args, Config()) map { implicit config =>
val trainingFiles = openBookFiles("Training", config.training, config.filter)
val validationFiles = openBookFiles("Validation", config.validation, config.filter)
val trainingOrderLog = orderLog(trainingFiles)
log.info(s"Training order log size: ${trainingOrderLog.count()}")
// Configure DecisionTree model
val labelEncode = implicitly[LabelEncode[MeanPriceMove]]
val numClasses = labelEncode.numClasses
val categoricalFeaturesInfo = Map.empty[Int, Int]
val impurity = "gini"
val maxDepth = 5
val maxBins = 100
val trainingData = trainingOrderLog.extractLabeledData(featuresExtractor(_: String))
val trainedModels = (trainingData map { case LabeledOrderLog(symbol, labeledPoints) =>
log.info(s"$symbol: Train Decision Tree model. Training data size: ${labeledPoints.count()}")
val model = DecisionTree.trainClassifier(labeledPoints, numClasses, categoricalFeaturesInfo, impurity, maxDepth, maxBins)
val labelCounts = labeledPoints.map(_.label).countByValue().map {
case (key, count) => (labelEncode.decode(key.toInt), count)
}
log.info(s"$symbol: Label counts: [${labelCounts.mkString(", ")}]")
symbol -> model
}).toMap
val validationOrderLog = orderLog(validationFiles)
log.info(s"Validation order log size: ${validationOrderLog.count()}")
val validationData = validationOrderLog.extractLabeledData(featuresExtractor(_: String))
// Evaluate model on validation data and compute training error
validationData.map { case LabeledOrderLog(symbol, labeledPoints) =>
val model = trainedModels(symbol)
log.info(s"$symbol: Evaluate model on validation data. Validation data size: ${labeledPoints.count()}")
log.info(s"$symbol: Learned classification tree model: $model")
val labelAndPrediction = labeledPoints.map { point =>
val prediction = model.predict(point.features)
(point.label, prediction)
}
val trainingError = labelAndPrediction.filter(r => r._1 != r._2).count().toDouble / labeledPoints.count
log.info(s"$symbol: Training Error = " + trainingError)
}
}
}
Learning errors
Classification results by the decision tree construction method for a single ticker
ORCL:ORCL: Train Decision Tree model. Training data size: 64064
ORCL: Trained model in 3740 millis
ORCL: Label counts: [Stationary -> 42137, Down -> 10714, Up -> 11213]
ORCL: Evaluate model on validation data. Validation data size: 54749
ORCL: Training Error = 0.28603262160039455
As you can see, this fairly simple model was able to successfully classify approximately 70% of the data.
Note : Despite the fact that the model works very well, this does not mean that it can be successfully used to build a profitable automated trading strategy. First, I do not check whether my model predicts any price changes with an accuracy of an average of 70% with a 95% probability. The model does not measure the “intensity” of the dynamics of securities prices, in addition, in reality, the model should work efficiently enough to cover transaction costs. Not to mention other details that are important for building a real trading system.
In fact, much can be done to improve the system and verify the results. Unfortunately, it is very difficult to get enough data: the data for two trading days is not enough to draw conclusions and begin to create a system that can make all the money in the world. However, I think this is a pretty good starting point.
results
I relatively easily conducted a rather complex research project on a larger scale than the one described in the original article.
Recent technologies in the field of big data allow you to create models using all available information without the use of samples. Using all the information helps to create the best models and highlight all the details from the complete data set.
Github Application Code