May 9, 2015 at 02:27
ExpvarMon - console monitoring of services on Go
For Go-programs, there is the most convenient standard expvar package , which allows connecting the output of debug information in JSON format with one line. And in order to monitor the current status as quickly and clearly as possible, the Expvarmon console program was written, requiring a minimum of configuration for displaying metrics and debug information for your Go-services.
Functions:
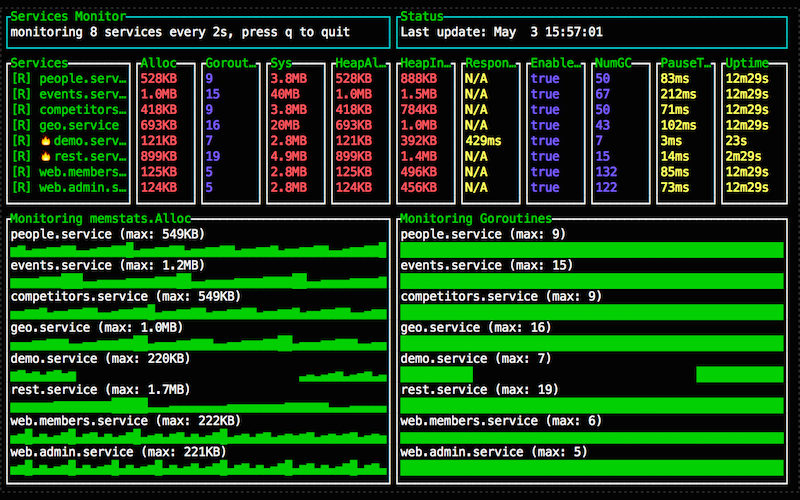
The Go standard library has a very useful expvar package that allows you to add a single-line output of debug information in json format at the address / debug / vars. By default, data on memory usage and the work of the garbage collector (GC) is displayed, and any metrics / counters / variables are easily added. Usually this data is collected by a separate process, which is put into some time-series database, and then it turns into convenient and beautiful dashboards.
But often, even during development or debugging sessions, you just want to monitor the status of the program, to be sure that the resources are used adequately for the loads, there are no memory leaks or goroutines, and so on. Raising an entire monitoring infrastructure for this is often expensive and unjustified, and raw json is not very presentable.
It was for such cases that a program was written over the weekend to monitor expvar variables directly in the terminal, which requires an almost zero configuration and does not use any third-party databases and resources. The program uses the excellent TermUI package from the gizak terminal lover (see its home page !).
Installing a program, like any other program on Go, is extremely simple:
I hope you have $ GOPATH / bin in $ PATH.
If you are not familiar with the expvar package , then a brief explanation and instruction.
The init () function of this package says the following:
The first line registers the handler for processing the URL "/ debug / vars" for the standard http.DefaultServeMux from the standard net / http package. If you don’t yet know how net / http works, this may be a separate article, but now you only need to know that if your program starts a standard http server (say http.ListenAndServe (": 1234", nil) ), then she will automatically get a GET request handler at / debug / vars. And the response of this request will by default contain approximately the following JSON:
This is a JSON representation of two variables defined by the following two lines - the command line and the current values of runtime.Memstats . The latter contains a lot of details about the current memory usage and the work of the garbage collector, most of which are too detailed. Typically, the monitoring values are Alloc, Sys, HeapAlloc - the actually used memory requested from the OS, the used memory on the heap, respectively.
Since init () calls automatically when importing a package, it is enough to add one line in the program:
This program is extremely simple - it reads this JSON for the specified service or services with the specified interval and displays it in a convenient form for monitoring, while showing sparkline-graphs for numerical values. All she needs to run is the port or “host: port” of the service (s) that you want to monitor. For example:
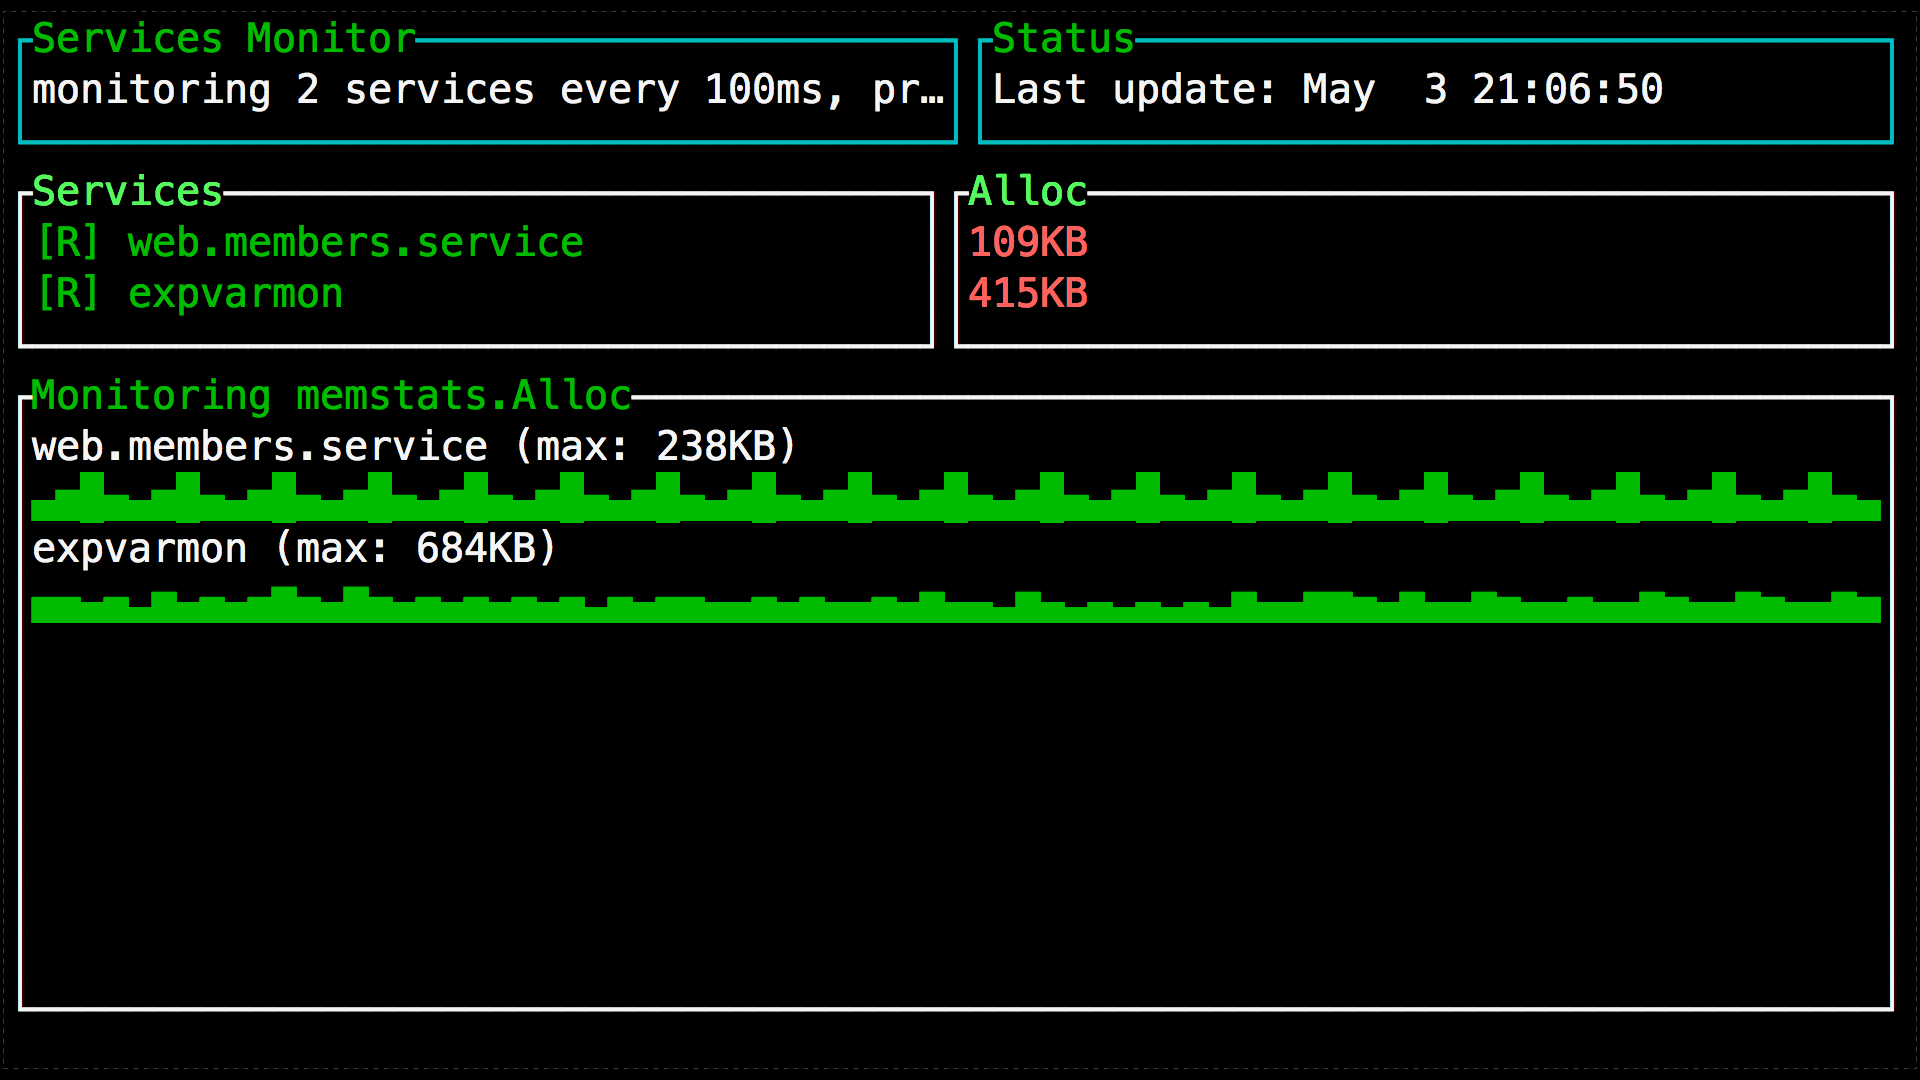
You can specify either one or 30+ ports / services - how much terminal size you have.
The program can also monitor itself:
The default interval is 5 seconds, but you can specify less or more. Keep in mind that a too short interval is not recommended, since even updating memstats affects the garbage collector and increases pauses. If your application runs under heavy load, a very short interval (100ms) can affect productivity.
By default, the following variables are monitored:
The values of the variables are taken in the form in which they are in JSON, with writing through a dot. Modifiers “mem:”, “duration:”, “str:” are optional, and affect formatting / display. If you specify variables without a modifier, they will be displayed as is. The “mem:” modifier will convert values to the “KB, MB, etc” view, and “duration:” will convert the int64 value to time.Duration (“ns, ms, s, m, etc”). The str: modifier simply says that the value is not digital, and you do not need to draw a sparkline chart for this variable.
For example:
Again, you can specify either one variable or a couple of dozen, as long as you have enough terminal size.
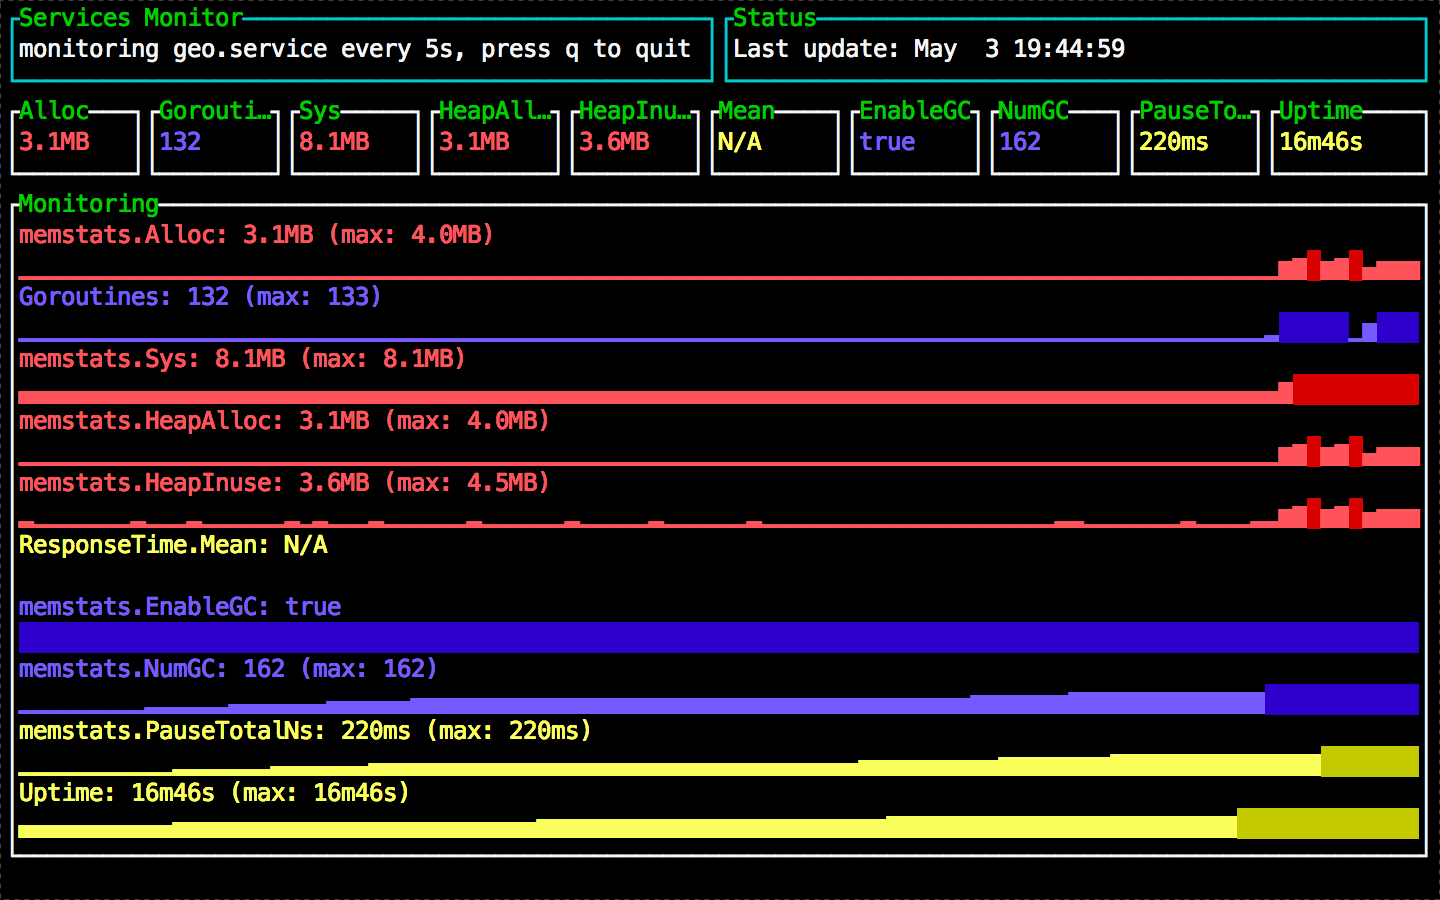
The program has two modes - for one service and for several services. In the first case, the graphs are displayed for all variables, in the second - only for the first two, in the order in which they are indicated. For graphs, the maximum values that were observed during the monitoring session are displayed.
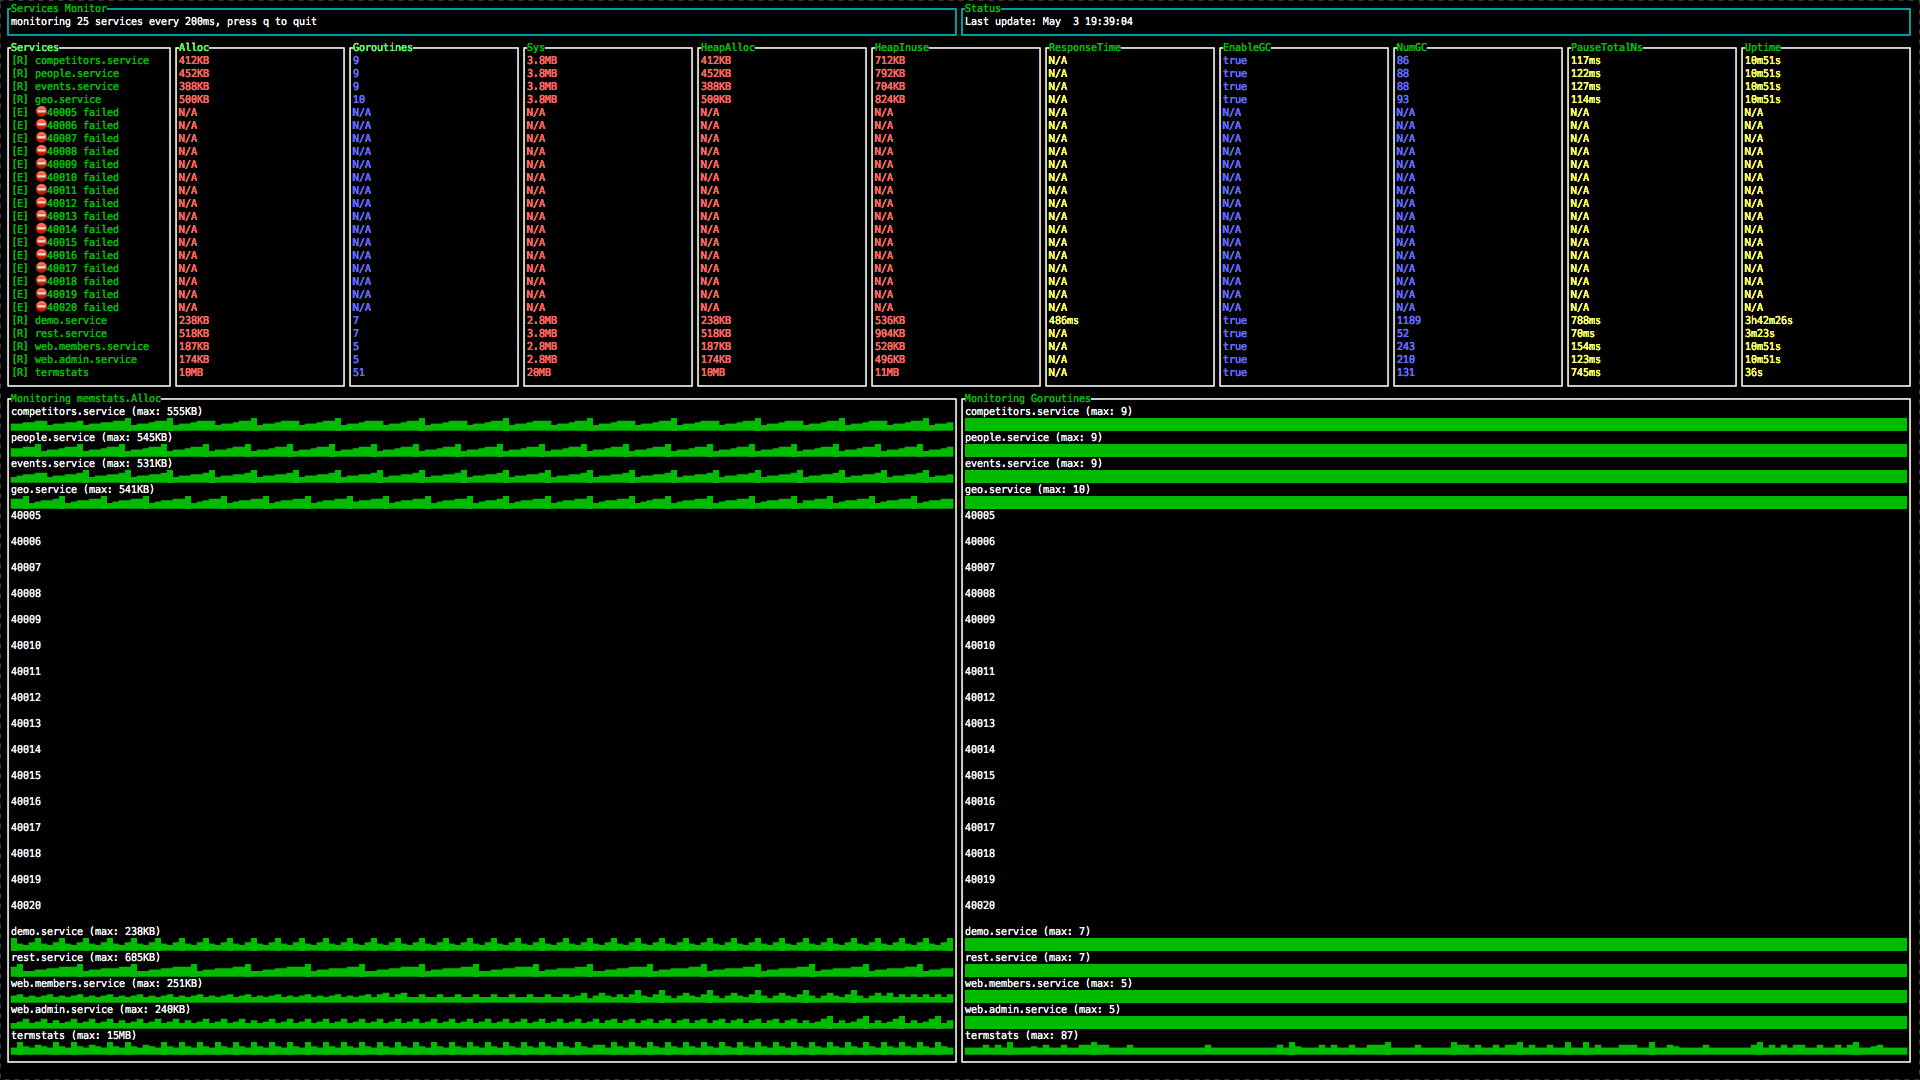
Expvarmon displays icons of services that have fallen and which are currently lying. Unfortunately, if the polling interval is longer than the service fall / restart time, the program will not catch the service drop.
It is also important to understand that data is not recorded or stored anywhere. The latest values are shown on the charts - and the scale of the charts depends on the interval and size of the terminal. No zoom, no history, no time search here. This solution is for a simpler task - instant monitoring of current values.
Thanks to the capabilities of TermUI, the program dynamically resizes all widgets when changing the font size or terminal window.
Personally, I’m missing two things in the standard expvar variable list - the number of running goroutines and the uptime of the service. Here is a demo wrapper that will export three additional variables. Just plug it into your program, with one import.
Many Go web services are written using additional web frameworks or more advanced http routers. expvar will not work with them out of the box. For it, you will need to start the standard http.ListenAndServer () on another port. And this is even better, since opening out / debug / vars is highly discouraged when it comes to public web services.
If you use standard net / http, but want expvar to be on a different port, the easiest way to do this. The "main" ServeMux run as follows:
and / debug / vars hang on standard

Github: github.com/divan/expvarmon
Expvar docs: golang.org/pkg/expvar
runtime.Memstats: golang.org/pkg/runtime/#MemStats
Functions:
- single- and multi-services modes
- monitoring local and remote programs
- arbitrary number of services and variables
- support of values for memory, time intervals, bool and arbitrary numbers / lines
- sparkline graphics
- display of maximum values
- display of fallen / restarted services
- auto-resize when resizing a font or window
Introduction
The Go standard library has a very useful expvar package that allows you to add a single-line output of debug information in json format at the address / debug / vars. By default, data on memory usage and the work of the garbage collector (GC) is displayed, and any metrics / counters / variables are easily added. Usually this data is collected by a separate process, which is put into some time-series database, and then it turns into convenient and beautiful dashboards.
But often, even during development or debugging sessions, you just want to monitor the status of the program, to be sure that the resources are used adequately for the loads, there are no memory leaks or goroutines, and so on. Raising an entire monitoring infrastructure for this is often expensive and unjustified, and raw json is not very presentable.
It was for such cases that a program was written over the weekend to monitor expvar variables directly in the terminal, which requires an almost zero configuration and does not use any third-party databases and resources. The program uses the excellent TermUI package from the gizak terminal lover (see its home page !).
Installation
Installing a program, like any other program on Go, is extremely simple:
go get github.com/divan/expvarmonI hope you have $ GOPATH / bin in $ PATH.
Using
expvar
Short explanation
import _ "expvar"Long explanation
If you are not familiar with the expvar package , then a brief explanation and instruction.
The init () function of this package says the following:
func init() {
	http.HandleFunc("/debug/vars", expvarHandler)
	Publish("cmdline", Func(cmdline))
	Publish("memstats", Func(memstats))
}
The first line registers the handler for processing the URL "/ debug / vars" for the standard http.DefaultServeMux from the standard net / http package. If you don’t yet know how net / http works, this may be a separate article, but now you only need to know that if your program starts a standard http server (say http.ListenAndServe (": 1234", nil) ), then she will automatically get a GET request handler at / debug / vars. And the response of this request will by default contain approximately the following JSON:
$ curl -s http://localhost:1234/debug/vars | json_pp | head
{
   "cmdline" : [
      "./expvar.demo",
      "-bind=:1234",
   ],
   "memstats" : {
      "NumGC" : 5,
      "Alloc" : 114016,
      "DebugGC" : false,
      "HeapObjects" : 519,
      "HeapSys" : 868352,
      "StackInuse" : 180224,
This is a JSON representation of two variables defined by the following two lines - the command line and the current values of runtime.Memstats . The latter contains a lot of details about the current memory usage and the work of the garbage collector, most of which are too detailed. Typically, the monitoring values are Alloc, Sys, HeapAlloc - the actually used memory requested from the OS, the used memory on the heap, respectively.
Since init () calls automatically when importing a package, it is enough to add one line in the program:
import _ "expvar"expvarmon
This program is extremely simple - it reads this JSON for the specified service or services with the specified interval and displays it in a convenient form for monitoring, while showing sparkline-graphs for numerical values. All she needs to run is the port or “host: port” of the service (s) that you want to monitor. For example:
expvarmon -ports="80"
expvarmon -ports="23000-23010,80"
expvarmon -ports="80,remoteapp.corp.local:80-82"
You can specify either one or 30+ ports / services - how much terminal size you have.
The program can also monitor itself:
expvarmon -selfThe default interval is 5 seconds, but you can specify less or more. Keep in mind that a too short interval is not recommended, since even updating memstats affects the garbage collector and increases pauses. If your application runs under heavy load, a very short interval (100ms) can affect productivity.
expvarmon -self -i 5m
expvarmon -self -i 30s
By default, the following variables are monitored:
- mem: memstats.Alloc
- mem: memstats.Sys
- mem: memstats.HeapAlloc
- mem: memstats.HeapInuse
- memstats.EnableGC
- memstats.NumGC
- duration: memstats.PauseTotalNs
The values of the variables are taken in the form in which they are in JSON, with writing through a dot. Modifiers “mem:”, “duration:”, “str:” are optional, and affect formatting / display. If you specify variables without a modifier, they will be displayed as is. The “mem:” modifier will convert values to the “KB, MB, etc” view, and “duration:” will convert the int64 value to time.Duration (“ns, ms, s, m, etc”). The str: modifier simply says that the value is not digital, and you do not need to draw a sparkline chart for this variable.
For example:
expvarmon -ports="80" -vars="mem:memstats.Alloc,duration:Response.Mean,Goroutines,str:Uptime"Again, you can specify either one variable or a couple of dozen, as long as you have enough terminal size.
The program has two modes - for one service and for several services. In the first case, the graphs are displayed for all variables, in the second - only for the first two, in the order in which they are indicated. For graphs, the maximum values that were observed during the monitoring session are displayed.
Additionally
Expvarmon displays icons of services that have fallen and which are currently lying. Unfortunately, if the polling interval is longer than the service fall / restart time, the program will not catch the service drop.
It is also important to understand that data is not recorded or stored anywhere. The latest values are shown on the charts - and the scale of the charts depends on the interval and size of the terminal. No zoom, no history, no time search here. This solution is for a simpler task - instant monitoring of current values.
Thanks to the capabilities of TermUI, the program dynamically resizes all widgets when changing the font size or terminal window.
Additional variables
Personally, I’m missing two things in the standard expvar variable list - the number of running goroutines and the uptime of the service. Here is a demo wrapper that will export three additional variables. Just plug it into your program, with one import.
package myexpvars
import (
	"expvar"
	"math/rand"
	"runtime"
	"time"
)
var (
	startTime = time.Now().UTC()
)
// goroutines is an expvar.Func compliant wrapper for runtime.NumGoroutine function.
func goroutines() interface{} {
	return runtime.NumGoroutine()
}
// uptime is an expvar.Func compliant wrapper for uptime info.
func uptime() interface{} {
	uptime := time.Since(startTime)
	return int64(uptime)
}
// responseTime fake var.
func responseTime() interface{} {
	resp := time.Duration(rand.Intn(1000)) * time.Millisecond
	return int64(resp)
}
func init() {
	expvar.Publish("Goroutines", expvar.Func(goroutines))
	expvar.Publish("Uptime", expvar.Func(uptime))
	expvar.Publish("MeanResponse", expvar.Func(responseTime))
}
What to do if a third-party http router is used instead of the standard one
Many Go web services are written using additional web frameworks or more advanced http routers. expvar will not work with them out of the box. For it, you will need to start the standard http.ListenAndServer () on another port. And this is even better, since opening out / debug / vars is highly discouraged when it comes to public web services.
If you use standard net / http, but want expvar to be on a different port, the easiest way to do this. The "main" ServeMux run as follows:
mux := http.NewServerMux()
server := &http.Server{Addr: “:80”, Handler: mux}
server.ListenAndServe()
and / debug / vars hang on standard
http.ListenAndServe(":1234", nil)Screenshots
References
Github: github.com/divan/expvarmon
Expvar docs: golang.org/pkg/expvar
runtime.Memstats: golang.org/pkg/runtime/#MemStats