Code Quality Visualization with PhpMetrics
- Transfer
Recently I came across a great tool for analyzing PHP code. I publish a translation of an article with an overview of this tool.
PhpMetrics uses D3 and several sophisticated algorithms to scan your application code and produce sophisticated results reports.

It’s a little difficult to discuss without a good example, so let's install and run the utility, and then look at every detail.
For experiments, we need an isolated environment. As usual, we will use our faithful Homestead Improved Vagrant Box so that all readers have the same experimental environment.
As with any modern PHP project, the installation is very simple. We perform the installation globally, making it available to all projects on the machine.
We will test PhpMetrics on two heavy projects: Laravel and Symfony, we will consider frameworks, not projects. This means that we will not use the Composer create-project command, but will examine the source code for each framework.
We do our best to stay away from code that is not related to the framework.
Now that we have downloaded the projects, let's run PhpMetrics on them.
Never mind that we use the “Laravel” directory for reports, it’s just registered in the default settings of Homestead and we can use them for our small example to reduce the number of steps for setting up. This allows us to easily access reports at the following addresses.
Here's what we see in the Laravel report:

and here's what we get for Symfony analysis:

PhpMetrics offers many metrics. Let's clarify the essence of these circles and graphs and find out what exactly we are looking at!
After reviewing the report’s manual, we can immediately note that for Symfony there is more orange-red, while for Laravel there is more green. We note an important point - how many files Symfony has in relation to Laravel - you can clearly see this by comparing the density of circles.
PhpMetrics takes into account people with vision problems. The “color blind” checkbox changes the color of the circles from green, yellow, and orange to stripes at different angles.

If you look closely, it becomes clear that the circles are indicators of CC and MI, and, as the documentation says, large red circles are likely to be very difficult to maintain.
Both terms are easy to google, but let me rid you of this and explain on the fingers.
Cyclomatic complexity essentially shows the number of various paths along which you can go through the script logic. The more paths, the higher the complexity of the file. A good way to avoid high CC is to make the code as modular and atomic as possible, this happens naturally when observing SOLID principles.
According to Wikipedia, the support index is calculated according to certain formulas based on the following metrics - the number of lines of code, McCabe, Halstead. The number of lines of code - self-evidently - literally counts the number of lines of code. McCabe's metric is actually the second name for cyclomatic complexity. The complexity of Halstead is a set of formulas that try to look into the syntax of the code and derive such properties as the complexity of coding, a set of unique program commands, the complexity of understanding the program, etc. If you are interested in specific formulas, check out Wikipedia.
Taking all this into account, circles are given the size and color, reflecting the sum of all standard metrics of complexity and code support.
If you want to see all the data in a tabular form, you can select the “Explore” item in the report menu.

This table will include all of the above and moreover - from the number of lines of code to the number of classes and moreover - information for both the directory and the file. This incredibly detailed report you need to search for very accurate information throughout the code in one place.
The middle area in the report contains a custom graph.

In the example above, we compare the ratio of CC (mentioned above) and Lcom (for how many methods are not related to each other through properties) for each file, but you can easily switch the values of the X and Y axes to something else. For example, here is a comparison of complexity with the number of lines of code - you can note that the trend for Laravel is more proportional - the more Loc, the more complexity. while for Symfony the picture is more blurry for some files.

For example, the Symfony BinaryMode.php file has a very high complexity with 150 lines of code, and the Response.php file with 1275 lines has a very low complexity level. Explore files that give interesting results and see what you can get from these observations.
This graph is very well explained here , but in short, the middle diagonal line is called the balance or the main sequence. The goal is to keep your classes as close to the line as possible, because it means that they are balanced - quite abstract and concrete enough.
Note translator: for some reason, the author was unable to build this schedule. To make it clear what I mean, I give an example for Yii2.

Evaluation refers to a graph that reflects the average values of various indicators of the entire project. These values are not absolute, but are given in comparison with modern projects considered by the tool at the moment. On the report page there is a reservation, they say, the schedule is purely cosmetic, does not reflect the objective picture.

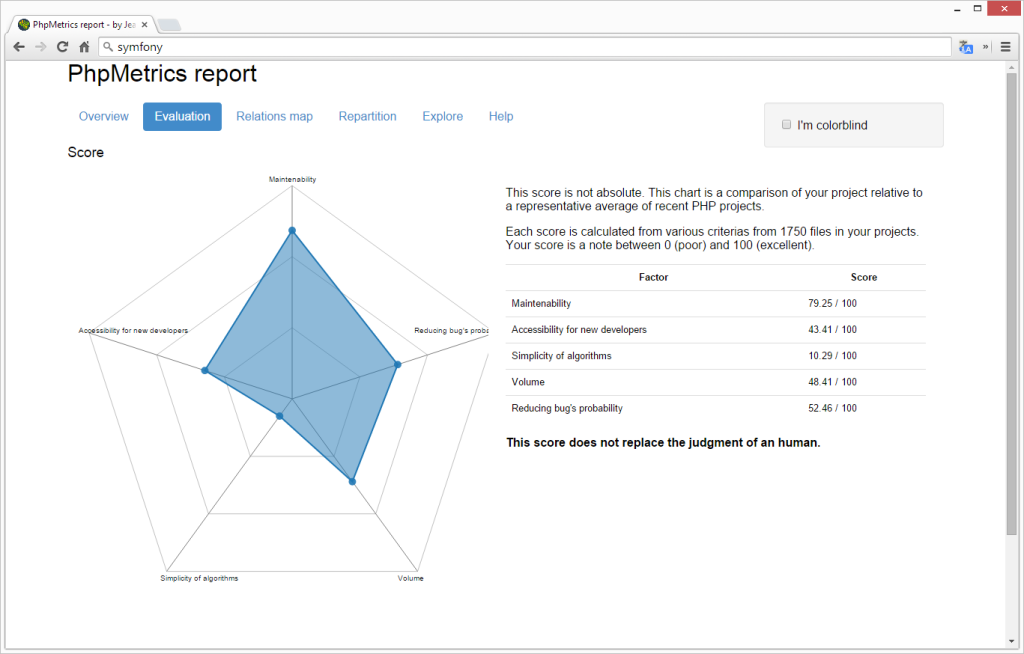
The tool considers both frameworks to be the same in terms of supportability. Not very shocking is the conclusion that Laravel is more friendly for new developers and simpler in terms of algorithms, not to mention smaller volumes.
The map of connections is more useful for small projects - it allows you to see the connections between classes. If the class extends or implements another, then the link map will show this. Due to the fact that in both projects the number of classes and the relationships between them is too large, the map is not so useful for our case - in fact, I did not build it for Symfony. But if you try to build it on a test project with fewer links, you will definitely see the benefits.
Note translator, to make it clear what I’m talking about, I give an example for Yii2

Finally, the redistribution information page summarizes all the results in a simpler way than on the Explore tab.
Symfony:

Laravel:

So, what conclusions can be drawn from the results? Without doing in-depth analysis, we can conclude that:
See what else you can find out by playing on your own with graphs and numbers, let me know in the comments.
PhpMetrics is another tool in a long line of code quality analyzers, but with goodies. In comparison with the search for typical code problems by standard means, here we see a whole set of new attributes and explanations in great shape. To find out what each attribute means, refer to the table .
Will you use PhpMetrics to analyze your project? Will you embed this tool in your IDE ? Do you see this tool as a constant complement to your continuous integration process?
PhpMetrics uses D3 and several sophisticated algorithms to scan your application code and produce sophisticated results reports.
Installing and Using PhpMetrics
It’s a little difficult to discuss without a good example, so let's install and run the utility, and then look at every detail.
Environment
For experiments, we need an isolated environment. As usual, we will use our faithful Homestead Improved Vagrant Box so that all readers have the same experimental environment.
Install PhpMetrics
As with any modern PHP project, the installation is very simple. We perform the installation globally, making it available to all projects on the machine.
sudo composer global require 'halleck45/phpmetrics'
Code retrieval
We will test PhpMetrics on two heavy projects: Laravel and Symfony, we will consider frameworks, not projects. This means that we will not use the Composer create-project command, but will examine the source code for each framework.
git clone https://github.com/symfony/symfony symframe
git clone https://github.com/laravel/framework lframe
We do our best to stay away from code that is not related to the framework.
Using PhpMetrics on a Heavyweight Project
Now that we have downloaded the projects, let's run PhpMetrics on them.
mkdir Laravel
mkdir Laravel/public
phpmetrics --report-html=/Laravel/public/report_symfony.html symframe
phpmetrics --report-html=/Laravel/public/report_laravel.html lframe
Never mind that we use the “Laravel” directory for reports, it’s just registered in the default settings of Homestead and we can use them for our small example to reduce the number of steps for setting up. This allows us to easily access reports at the following addresses.
homestead.app:8000/report_symfony.html
homestead.app:8000/report_laravel.html
Here's what we see in the Laravel report:
and here's what we get for Symfony analysis:
Analysis
PhpMetrics offers many metrics. Let's clarify the essence of these circles and graphs and find out what exactly we are looking at!
Color coding
After reviewing the report’s manual, we can immediately note that for Symfony there is more orange-red, while for Laravel there is more green. We note an important point - how many files Symfony has in relation to Laravel - you can clearly see this by comparing the density of circles.
PhpMetrics takes into account people with vision problems. The “color blind” checkbox changes the color of the circles from green, yellow, and orange to stripes at different angles.
Cyclomatic complexity and support indicator
If you look closely, it becomes clear that the circles are indicators of CC and MI, and, as the documentation says, large red circles are likely to be very difficult to maintain.
Both terms are easy to google, but let me rid you of this and explain on the fingers.
Cyclomatic complexity essentially shows the number of various paths along which you can go through the script logic. The more paths, the higher the complexity of the file. A good way to avoid high CC is to make the code as modular and atomic as possible, this happens naturally when observing SOLID principles.
According to Wikipedia, the support index is calculated according to certain formulas based on the following metrics - the number of lines of code, McCabe, Halstead. The number of lines of code - self-evidently - literally counts the number of lines of code. McCabe's metric is actually the second name for cyclomatic complexity. The complexity of Halstead is a set of formulas that try to look into the syntax of the code and derive such properties as the complexity of coding, a set of unique program commands, the complexity of understanding the program, etc. If you are interested in specific formulas, check out Wikipedia.
Taking all this into account, circles are given the size and color, reflecting the sum of all standard metrics of complexity and code support.
Tables
If you want to see all the data in a tabular form, you can select the “Explore” item in the report menu.
This table will include all of the above and moreover - from the number of lines of code to the number of classes and moreover - information for both the directory and the file. This incredibly detailed report you need to search for very accurate information throughout the code in one place.
Custom graphics
The middle area in the report contains a custom graph.
In the example above, we compare the ratio of CC (mentioned above) and Lcom (for how many methods are not related to each other through properties) for each file, but you can easily switch the values of the X and Y axes to something else. For example, here is a comparison of complexity with the number of lines of code - you can note that the trend for Laravel is more proportional - the more Loc, the more complexity. while for Symfony the picture is more blurry for some files.
For example, the Symfony BinaryMode.php file has a very high complexity with 150 lines of code, and the Response.php file with 1275 lines has a very low complexity level. Explore files that give interesting results and see what you can get from these observations.
Abstract / Instability
This graph is very well explained here , but in short, the middle diagonal line is called the balance or the main sequence. The goal is to keep your classes as close to the line as possible, because it means that they are balanced - quite abstract and concrete enough.
Note translator: for some reason, the author was unable to build this schedule. To make it clear what I mean, I give an example for Yii2.
Rating
Evaluation refers to a graph that reflects the average values of various indicators of the entire project. These values are not absolute, but are given in comparison with modern projects considered by the tool at the moment. On the report page there is a reservation, they say, the schedule is purely cosmetic, does not reflect the objective picture.
The tool considers both frameworks to be the same in terms of supportability. Not very shocking is the conclusion that Laravel is more friendly for new developers and simpler in terms of algorithms, not to mention smaller volumes.
Links Map
The map of connections is more useful for small projects - it allows you to see the connections between classes. If the class extends or implements another, then the link map will show this. Due to the fact that in both projects the number of classes and the relationships between them is too large, the map is not so useful for our case - in fact, I did not build it for Symfony. But if you try to build it on a test project with fewer links, you will definitely see the benefits.
Note translator, to make it clear what I’m talking about, I give an example for Yii2
Redistribution
Finally, the redistribution information page summarizes all the results in a simpler way than on the Explore tab.
Symfony:
Laravel:
Comparison results
So, what conclusions can be drawn from the results? Without doing in-depth analysis, we can conclude that:
- Laravel is more friendly for new developers, has simpler algorithms and less bloated files.
- Laravel is radically more lightweight. Symfony has at least three times the most — methods, classes, lines of code ... it's three times as massive.
- Symfony has higher relative complexity (middle column in the redistribution report).
- Laravel is more stable in terms of complexity in files - complexity is proportional to lines of code, in Symfony it is not.
- Symfony can work to split some complex files into more atomic ones - large red circles everywhere on the first chart.
See what else you can find out by playing on your own with graphs and numbers, let me know in the comments.
Conclusion
PhpMetrics is another tool in a long line of code quality analyzers, but with goodies. In comparison with the search for typical code problems by standard means, here we see a whole set of new attributes and explanations in great shape. To find out what each attribute means, refer to the table .
Will you use PhpMetrics to analyze your project? Will you embed this tool in your IDE ? Do you see this tool as a constant complement to your continuous integration process?