Chrome: Popular Developer Extensions
- Transfer
Recommended extensions to the Chrome developer tools for more enjoyment of the debugging and development process.
 Angular batarangThis extension adds tools for finding problems in the performance, visualization and debugging of the application. |
 Devtools terminalDevTools Terminal is an extension of the Chrome developer tools that adds terminal capabilities to your browser. |
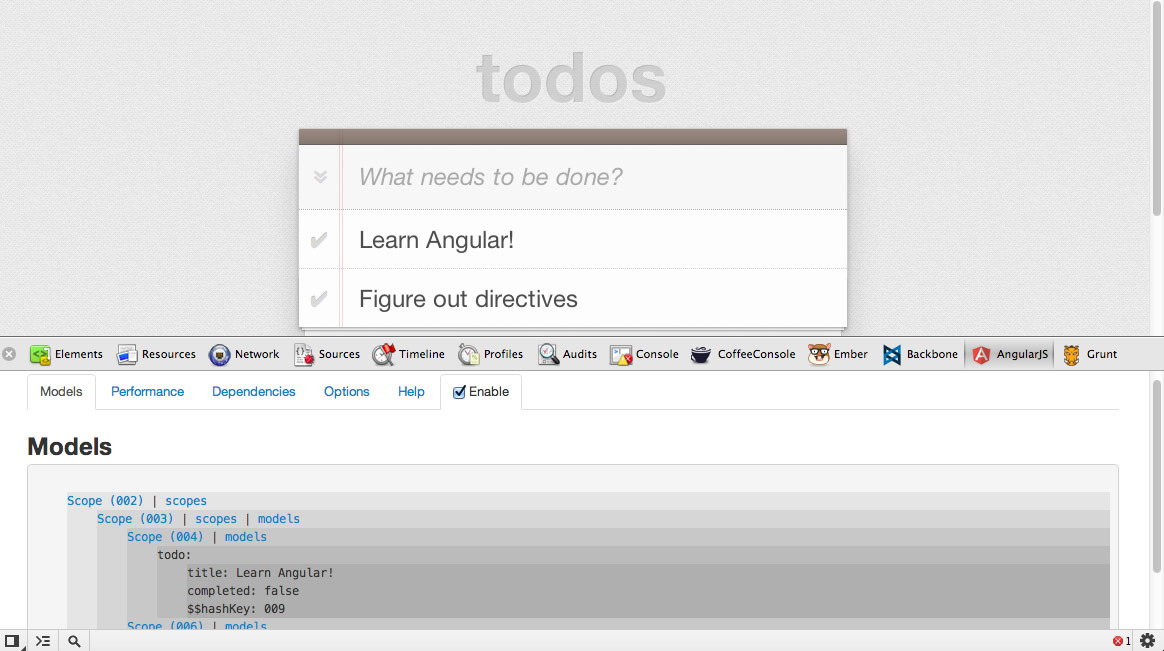
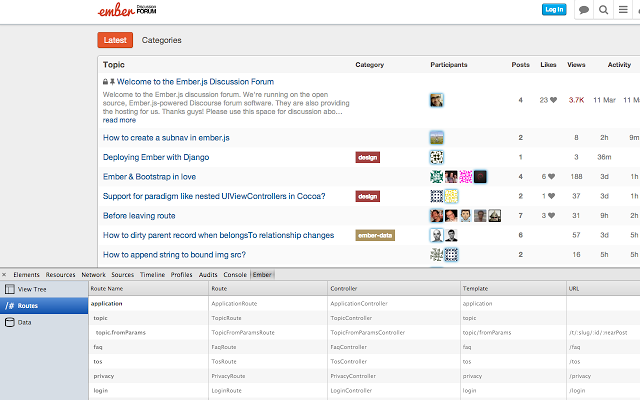 Ember inspectorEmber Inspector is an extension to the Chrome developer tools that makes it easier to understand and debug applications on Ember.js. |
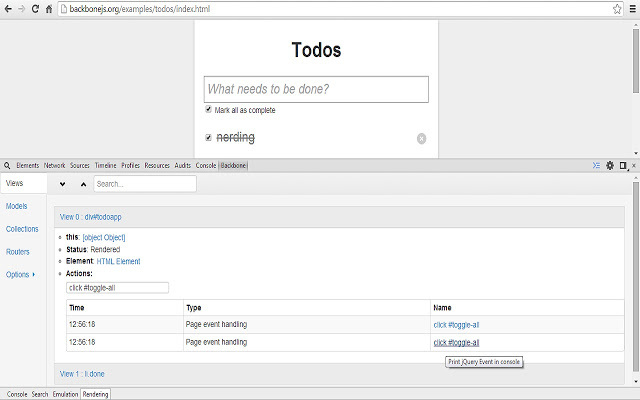 Backbone debuggerAdds a tab to the Chrome Developer Tools, which displays real-time views, models, collections, and routes. |
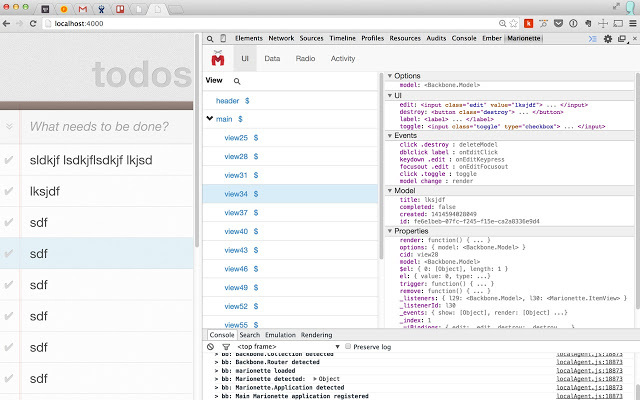 Marionette inspectorMarionette Inspector offers tools for visualizing components, finding data, and studying activity in real time. |
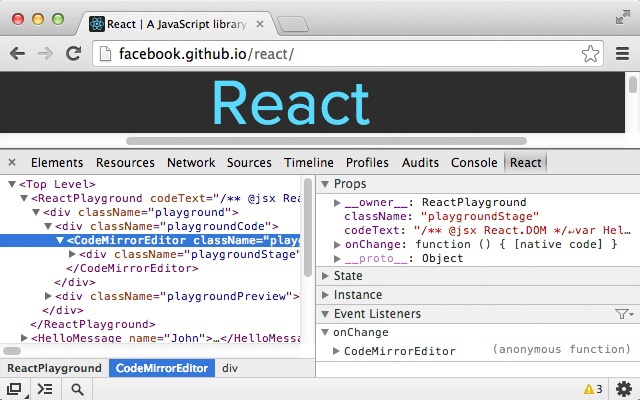 React Developer ToolsReact Developer Tools is an extension of the Chrome developer tools for working with the React.js open JavaScript library |
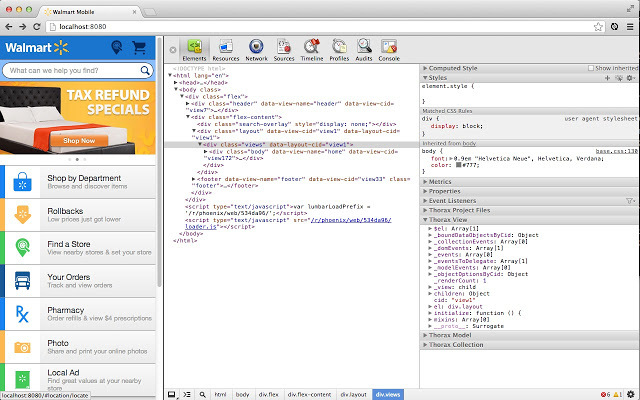 Thorax inspectorAdds inspector support for Thorax, a library based on Backbone and Handlebars, for creating large web applications. |
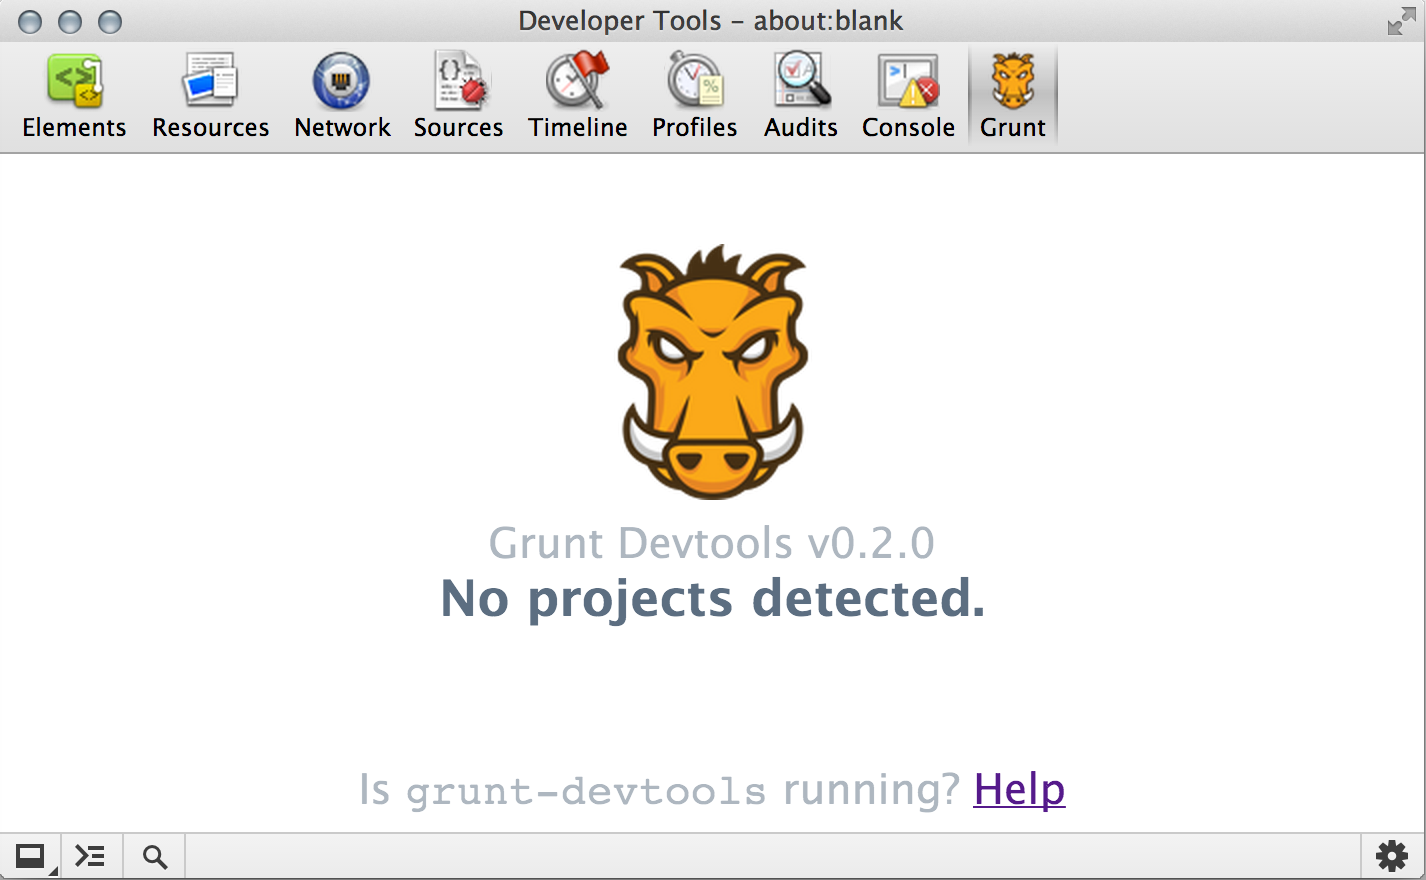 Grunt devtoolsExtends developer tools by adding tools for Grunt! Full GUI for Grunt. Support for background tasks such as tracking. Allows you to run tasks for multiple projects in one window. |
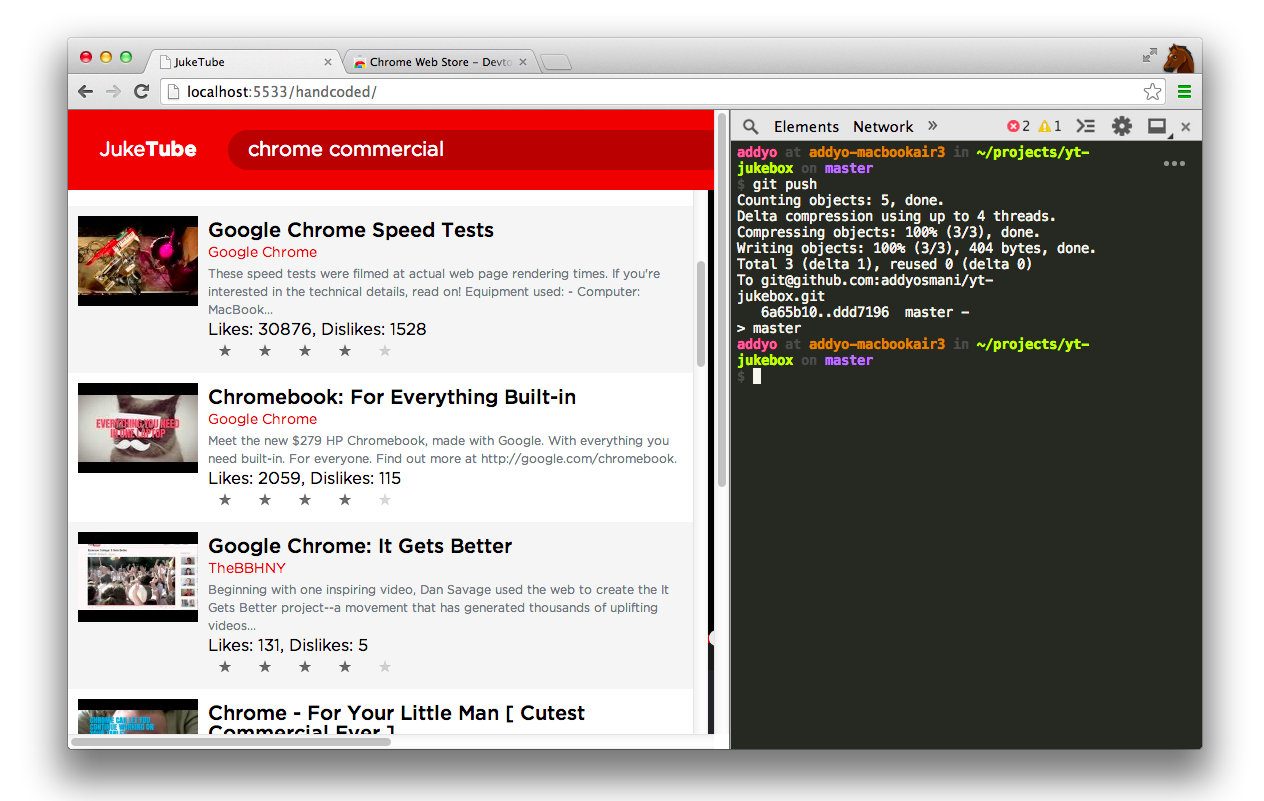
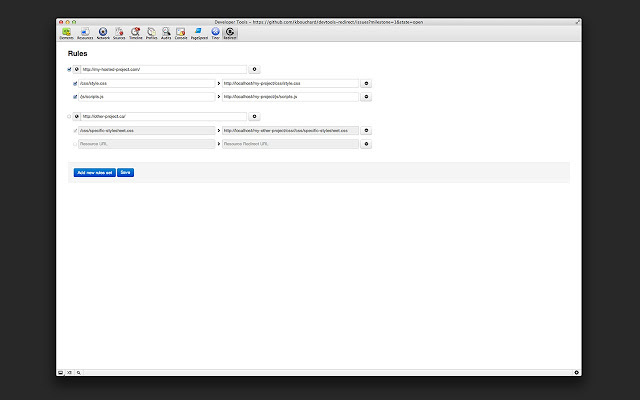 DevTools RedirectIt intercepts and redirects resources from any domain to any resources located locally or on a remote server. |
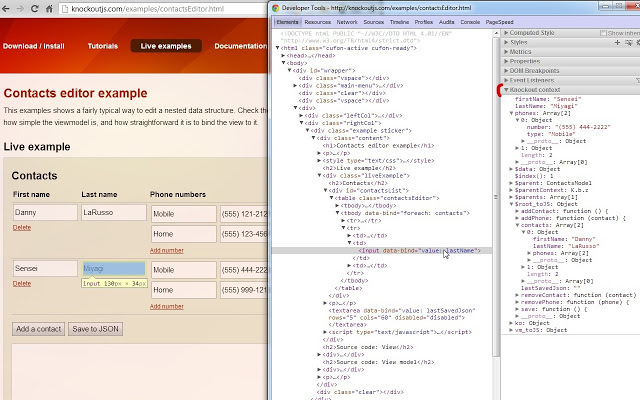 Knockoutjs context debuggerExtension for debugging Knockoutjs. Adds a sidebar to the Elements tab of the developer tools with the corresponding knockout description of the selected item. |
 BatmanJS DevToolsIf you work with Batman.js, then this extension will become an invaluable tool for you. It contains many tools useful for developing Batman.js directly in the browser. |
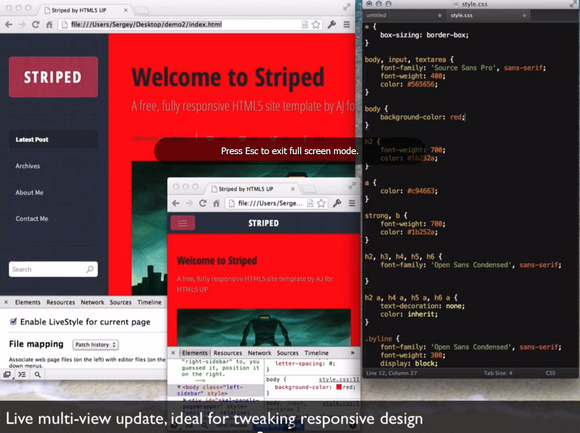 Emmet livestyleUnlike other similar tools, LiveStyle does not modify the CSS file in the browser (or file system) to display the changes, it performs structural analysis during the set and map changes from one CSS source to another. |
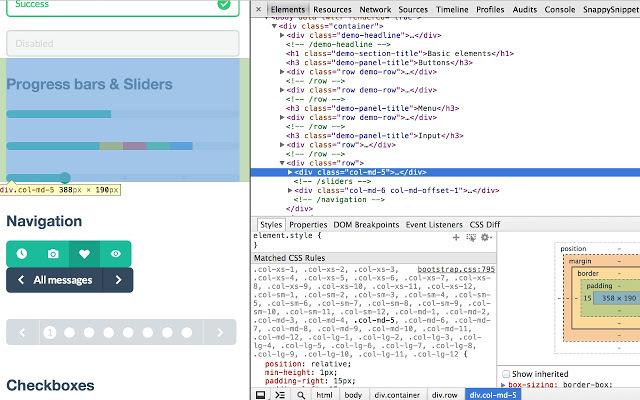 Snappy snippetSnappySnippet is an extension of the developer tools that allows you to get CSS and HTML of the selected DOM branch (the last inspected element). In just one click, you can transfer the selected code to CodePen, jsFiddle or JS Bin. |
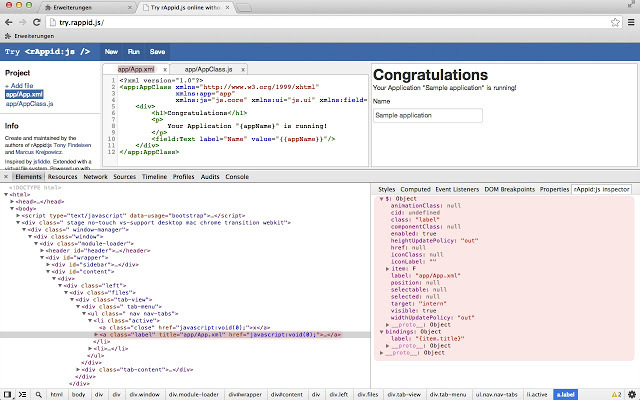 RapidJS DevToolsAn additional panel in the Chrome developer tools that allows you to learn rAppid: js application. |
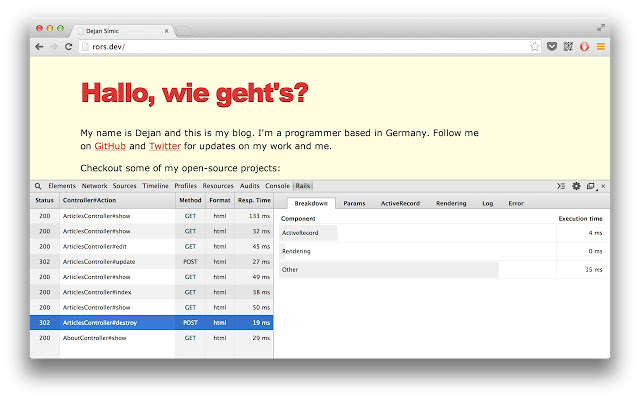 RailspanelRailsPanel - Chrome extension for developing Rails applications that will process the log file. Access all the request information for your Rails application directly in the console. |
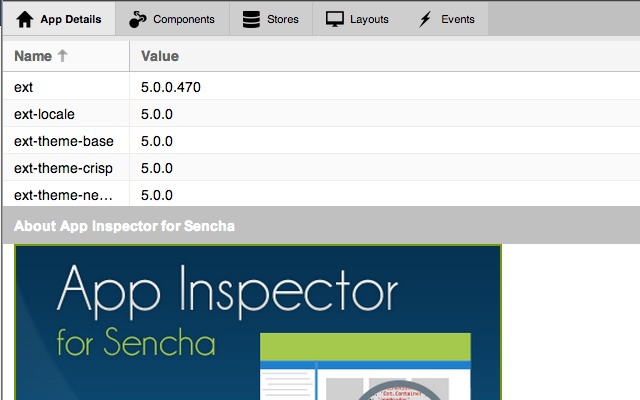 App Inspector for SenchaAn extension of the Google Chrome developer tools for debugging Sencha applications. |
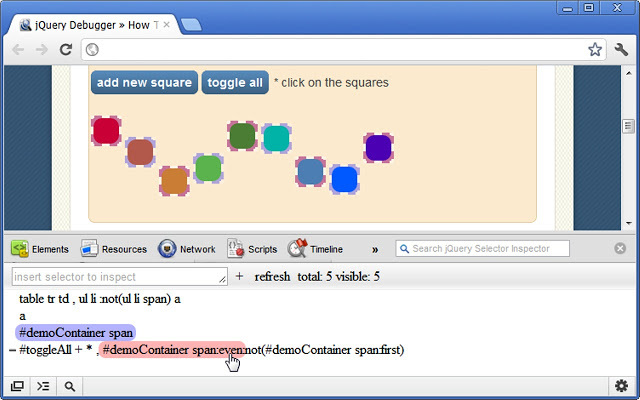 jQuery DebuggerA new tab for the selectors inspector for the convenience of checking your jQuery selectors, and viewing the results on any site. The add-on is designed to help you understand even the most complex selectors. |
 PageSpeed InsightsA browser extension available for Chrome and Firefox that allows you to evaluate the performance of your pages and get recommendations for improving them. |
 Django debug panelDjango Debug Panel for WebKit Developer Tools. It showed good work with background AJAX requests and non-HTML requests. Great for single-page applications and other web-based applications using AJAX. |