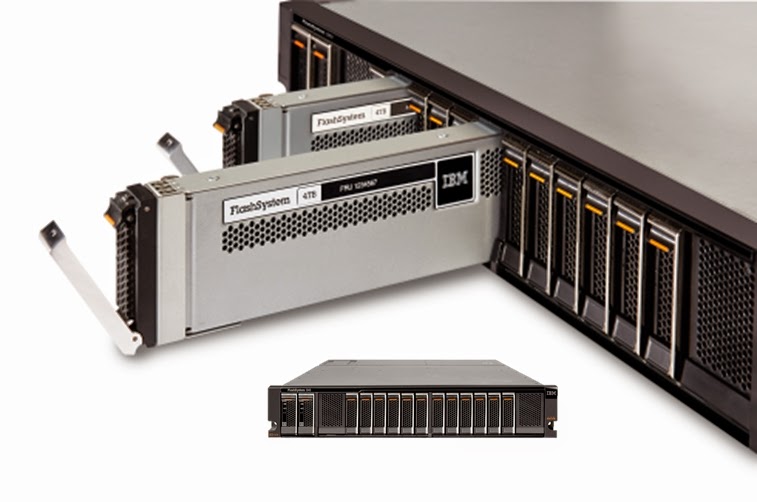
Testing flash storage. IBM FlashSystem 840
Last year, they wrote about testing the IBM RamSan FlashSystem 820 . But this time, thanks to one large customer, we got IBM FlashSystem 840 in our hands . For about a year old, the “childhood diseases” are already behind ie it's time to evaluate her professional capabilities.

During testing, the following tasks were solved:
For testing, at the customer’s site, 2 different stands were assembled in series.
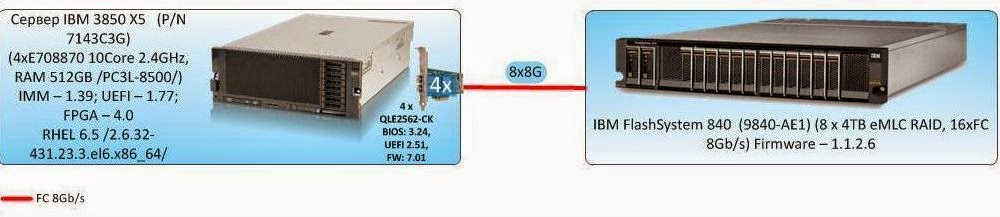
For tests of groups 1 and 2, the load is generated by one server, and the stand has the form shown in the figure:
Server: IBM 3850X5 connected directly by eight 8Gb FC connections to. IBM FlashSystem 840 storage
For tests of group 3 , the IBM 3650M4 server is added to the described stand, also connected directly to the IBM Flash System 840 storage. At this stage, each server connects to the storage via four optical links.
As additional software, the Symantec Storage Foundation 6.1 is installed on the test server, which implements:
Tests are performed by creating a synthetic load with the fio program on a block device, which is a logical volume of the type
Testing consisted of 3 groups of tests:
Conclusions:
1. With a long recording load at a certain point in time, a significant degradation in the performance of storage systems is recorded (Figure 3). A drop in performance is expected and is a feature of the SSD (write cliff) operation associated with the inclusion of garbage collection (GC) processes and the limited performance of these processes. The performance of a disk array, fixed after the write cliff effect (after a drop in performance), can be considered as the maximum average performance of a disk array.
2. The block size during continuous recording load affects the performance of the GC process. So with small blocks (4K), the GC's speed is 640 MB / s, on medium and large blocks (16K-1M) CG operates at a speed of about 1200 MB / s.
3. The difference in the values of the maximum storage run time at peak performance, recorded during the first long test and subsequent equivalent test with a 4K block, is due to the fact that the storage was not completely filled before testing.
4. The maximum operating time of storage at peak performance differs significantly with the 4K block and all other blocks, which is most likely due to the limited storage space reserved for GC processes.
5. To perform service processes on the storage system, about 2TB is reserved.
6. When testing on storage systems 70% full, the performance drop occurs slightly later (about 10%). There are no changes in the speed of the GC processes.
The main test results presented in the graphs are summarized in tables.
1. The maximum recorded performance parameters for storage (from the average for the duration of each test - 3 minutes):
Record:
Reading:
Mixed Load (70/30 rw)
Minimum latency:
2. SHD enters saturation mode at
3. On read operations in large blocks (16K-1M), a throughput of more than 6 GB / s was obtained, which roughly corresponds to the total throughput of the interfaces used when connecting the server to the storage system. Thus, neither storage controllers nor flash drives are a system bottleneck.
4. An array with an asynchronous I / O method produces 1.5 to 2 times more performance on small blocks (4-8K) than with a synchronous I / O method. On large and medium blocks (16K-1M), the performance with synchronous and asynchronous I / O is approximately equal.
5. The graphs below show the dependence of the maximum obtained performance indicators of the tested storage system (IOPS and data transfer rate) on the size of the I / O block. The nature of the graphs allows us to draw the following conclusions:
For each of the tests, a performance was obtained that coincided within the error of 5% with the results of tests of group 2, when the load was generated by one server. We did not give graphs and performance data for tests of group 3, as a result of their identity with the results of group 2.
In other words, the study showed that the server is not a bottleneck in the test bench.
In general, the system showed excellent results. We were not able to identify obvious bottlenecks and obvious problems. All results are stable and predictable. Comparing with our previous testing, the IBM FlashSystem 820 is worth noting the differences in the management interfaces. The 820th model is driven by the sometimes inconvenient java applet inherited from the Texas Instruments RamSan 820. At the same time, the 840th has a web-interface familiar to IBM products reminiscent of the XIV Storage System and Storwize. Working with them is noticeably nicer and, ultimately, faster.
In addition, the IBM FlashSystem 840 has acquired the capabilities necessary for enterprise-class devices to hot-swap all components and update firmware on the fly. The choice of possible connection interfaces and flash module configurations has expanded significantly.
The disadvantages, perhaps, include the presence of degradation of performance during long recordings. Although, this is rather a drawback of today's flash memory technologies, manifested as a result of the fact that the manufacturer did not artificially limit the speed of the system. Even with a long maximum recording load and after a drop in performance, the storage system showed remarkable results.
PS The author is grateful to Pavel Katasonov, Yuri Rakitin, and all other company employees who participated in the preparation of this material.
Testing methodology
During testing, the following tasks were solved:
- studies of the degradation of the performance of storage systems with a long write load (Write Cliff) and the effect of storage fullness;
- IBM FlashSystem840 storage performance research for various load profiles;
Testbed configuration
For testing, at the customer’s site, 2 different stands were assembled in series.
For tests of groups 1 and 2, the load is generated by one server, and the stand has the form shown in the figure:
 |
| Figure 1. Block diagram of the test bench 1. |
Server: IBM 3850X5 connected directly by eight 8Gb FC connections to. IBM FlashSystem 840 storage
For tests of group 3 , the IBM 3650M4 server is added to the described stand, also connected directly to the IBM Flash System 840 storage. At this stage, each server connects to the storage via four optical links.
 |
| Figure 2. Block diagram of the test bench 2. |
- Functionality of the logical volume manager (Veritas Volume Manager);
- Functionality of fail-safe connection to disk arrays (Dynamic Multi Pathing)
See the tedious details and all sorts of smart words.
The following settings were made on the test server, aimed at reducing the latency of disk I / O:
The following configuration settings for partitioning disk space are performed on the storage system:
Flexible IO Tester (fio) version 2.1.4 utility is used to create a synthetic load (performing synthetic tests) on the storage system. For all synthetic tests, the following configuration parameters of the fio section [global] are used:
The following utilities are used to take performance indicators under synthetic load:
The performance indicators are taken during the test by the utilities
- I / O Scheduler changed from
cfqtonoopby assigning a value tonoopaschedulervolume parameterSymantec VxVolume - Added the following parameter in
/etc/sysctl.confminimizing the size of the queue at the level of the logical volume manager Symantec:vxvm.vxio.vol_use_rq = 0; - The limit of simultaneous I / O requests to the device is increased to 1024 by assigning a value of 1024 to the
nr_requestsvolume parameterSymantec VxVolume; - Scanning is disabled possibility of merging / in (iomerge) by assigning parameter values 1
nomergesvolumeSymantec VxVolume; - Increased queue size on FC adapters by adding
/etc/modprobe.d/modprobe.confoptions to the configuration fileql2xmaxqdepth=64 (options qla2xxx ql2xmaxqdepth=64);
The following configuration settings for partitioning disk space are performed on the storage system:
- Implemented configuration of Flash RAID5 modules;
- For tests of groups 1 and 2 on the storage system, 8 LUNs of the same volume are created with the total volume covering the entire useful capacity of the disk array. The LUN block size is 512byte. Created LUNs are presented to one test server. For group 3 tests, 16 LUNs of the same volume are created with the total volume covering the entire usable capacity of the disk array. Created LUNs are presented in 8 pieces to each of 2 test servers.
Testing Software
Flexible IO Tester (fio) version 2.1.4 utility is used to create a synthetic load (performing synthetic tests) on the storage system. For all synthetic tests, the following configuration parameters of the fio section [global] are used:
thread=0direct=1group_reporting=1norandommap=1time_based=1randrepeat=0ramp_time=10
The following utilities are used to take performance indicators under synthetic load:
iostat, which is part of the packagesysstatversion 9.0.4 with keystxk;vxstat, Part of the Symantec Storage Foundation 6.1 c keyssvd;vxdmpadm, Part of the Symantec Storage Foundation 6.1 c keys-q iostat;fioversion 2.1.4, to generate a summary report for each load profile.
The performance indicators are taken during the test by the utilities
iostat, vxstat, vxdmpstatat intervals of 5 s.Testing program.
Tests are performed by creating a synthetic load with the fio program on a block device, which is a logical volume of the type
stripe, 8 column, stripe unit size=1MiBcreated using Veritas Volume Manager from 8 LUNs presented from the system under test. Testing consisted of 3 groups of tests:
Ask for details
When creating a test load, the following fio program parameters are used (in addition to those previously defined):
The test group consists of three tests that differ in the total amount of LUN presented with the tested storage system and the size of the I / O block:
Based on the test results, based on the data output by the vxstat team, the following graphs are generated that combine the test results:
The analysis of the information obtained is carried out and conclusions are made about:
During testing, the following types of loads are investigated:
The test group consists of a set of tests, which is all possible combinations of the above types of load. To mitigate the influence of service processes of storage (garbage collection) on test results between tests, a pause is realized equal to the amount of information recorded during the test divided by the performance of service processes of storage (determined by the results of the first group of tests).
Based on the test results, based on the data output by fio software at the end of each test, the following graphs are generated for each combination of the following types of load: load profile, method of processing I / O operations, queue depths, combining tests with different values of the I / O block :
The analysis of the results is carried out, conclusions are made about the load characteristics of the disk array with latency less than or about 1ms, about the maximum performance of the array about the performance of the array with single-threaded load. The optimal block size for working with the array is also determined, as a block in which it is possible to carry out the maximum number of I / O operations, while transmitting the maximum amount of data.
To run tests of this group, another server is added to the stand configuration. The disk array is divided into 16 LUNs of the same size, which in total occupy the entire storage volume. Each server is presented with 8 LUNs. Tests are carried out similarly to tests of group 2, the exception is that the load is generated simultaneously by two servers. The total performance obtained by both servers during each test is estimated. At the end of the tests, it is concluded that the number of servers generating the load affects the performance of the storage system.
Group 1: Tests that implement a long load of random write type with a change in the size of the block of input / output (I / O).
When creating a test load, the following fio program parameters are used (in addition to those previously defined):
rw=randwrite;blocksize=4K;numjobs=64;iodepth=64.
The test group consists of three tests that differ in the total amount of LUN presented with the tested storage system and the size of the I / O block:
- A write test performed on a fully marked storage system - the total volume of the presented LUNs is equal to the storage capacity, the test duration is 18 hours;
- Tests for recording with a variable block size (4,8,16,32,64,1024K), performed on a fully labeled storage system, the duration of each test is 1 hour. The pause between tests is 2 hours.
- Tests for recording with a changing block size (4,8,16,32,64,1024K), performed on the storage system, 70% full, the duration of each test is 1 hour. The pause between tests is 2 hours. For this test, 8 LUNs are created on the tested storage system, the total capacity of which is 70% of the useful storage capacity. Created LUNs are presented to the test server, where the Symantec VxVM tools collect the volume on which the test load falls.
Based on the test results, based on the data output by the vxstat team, the following graphs are generated that combine the test results:
- IOPS as a function of time;
- Bandwidth (BandWidth) as a function of time.
- Latency as a function of time.
The analysis of the information obtained is carried out and conclusions are made about:
- The presence of degradation of performance with a long recording load;
- The performance of the service processes of storage (garbage collection) limiting the performance of the disk array for recording under long peak load;
- The degree of influence of the size of the I / O operation block on the performance of storage service processes;
- The amount of space reserved for storage for leveling service processes of storage.
- The influence of storage capacity on the performance of service processes.
Group 2: Disk array performance tests for different types of load generated by a single server, performed at the block device level.
During testing, the following types of loads are investigated:
- load profiles (modifiable software parameters fio:)
randomrw, rwmixedread:
- random record 100%;
- random write 30%; random read 70%;
- random read 100%.
- block sizes: 1KB, 8KB, 16KB, 32KB, 64KB, 1MB (variable parameter fio software:)
blocksize; - methods of processing input-output operations: synchronous, asynchronous (modifiable software parameter fio :)
ioengine; - number of processes generating a load: 1, 2, 4, 8, 16, 32, 64, 128 (variable parameter of the software fio:)
numjobs; - queue depth (for asynchronous I / O operations): 32, 64 (modifiable software parameter fio:)
iodepth.
The test group consists of a set of tests, which is all possible combinations of the above types of load. To mitigate the influence of service processes of storage (garbage collection) on test results between tests, a pause is realized equal to the amount of information recorded during the test divided by the performance of service processes of storage (determined by the results of the first group of tests).
Based on the test results, based on the data output by fio software at the end of each test, the following graphs are generated for each combination of the following types of load: load profile, method of processing I / O operations, queue depths, combining tests with different values of the I / O block :
- IOPS as a function of the number of processes generating a load;
- Bandwidth as a function of the number of processes generating a load;
- Latitude (clat) as a function of the number of processes generating a load;
The analysis of the results is carried out, conclusions are made about the load characteristics of the disk array with latency less than or about 1ms, about the maximum performance of the array about the performance of the array with single-threaded load. The optimal block size for working with the array is also determined, as a block in which it is possible to carry out the maximum number of I / O operations, while transmitting the maximum amount of data.
Group 3: Disk array performance tests for different types of load generated by two servers, performed at the block device level ;.
To run tests of this group, another server is added to the stand configuration. The disk array is divided into 16 LUNs of the same size, which in total occupy the entire storage volume. Each server is presented with 8 LUNs. Tests are carried out similarly to tests of group 2, the exception is that the load is generated simultaneously by two servers. The total performance obtained by both servers during each test is estimated. At the end of the tests, it is concluded that the number of servers generating the load affects the performance of the storage system.
Test results
Group 1: Tests that implement a long load of random write type with a change in the size of the block of input / output (I / O).
Conclusions:
1. With a long recording load at a certain point in time, a significant degradation in the performance of storage systems is recorded (Figure 3). A drop in performance is expected and is a feature of the SSD (write cliff) operation associated with the inclusion of garbage collection (GC) processes and the limited performance of these processes. The performance of a disk array, fixed after the write cliff effect (after a drop in performance), can be considered as the maximum average performance of a disk array.
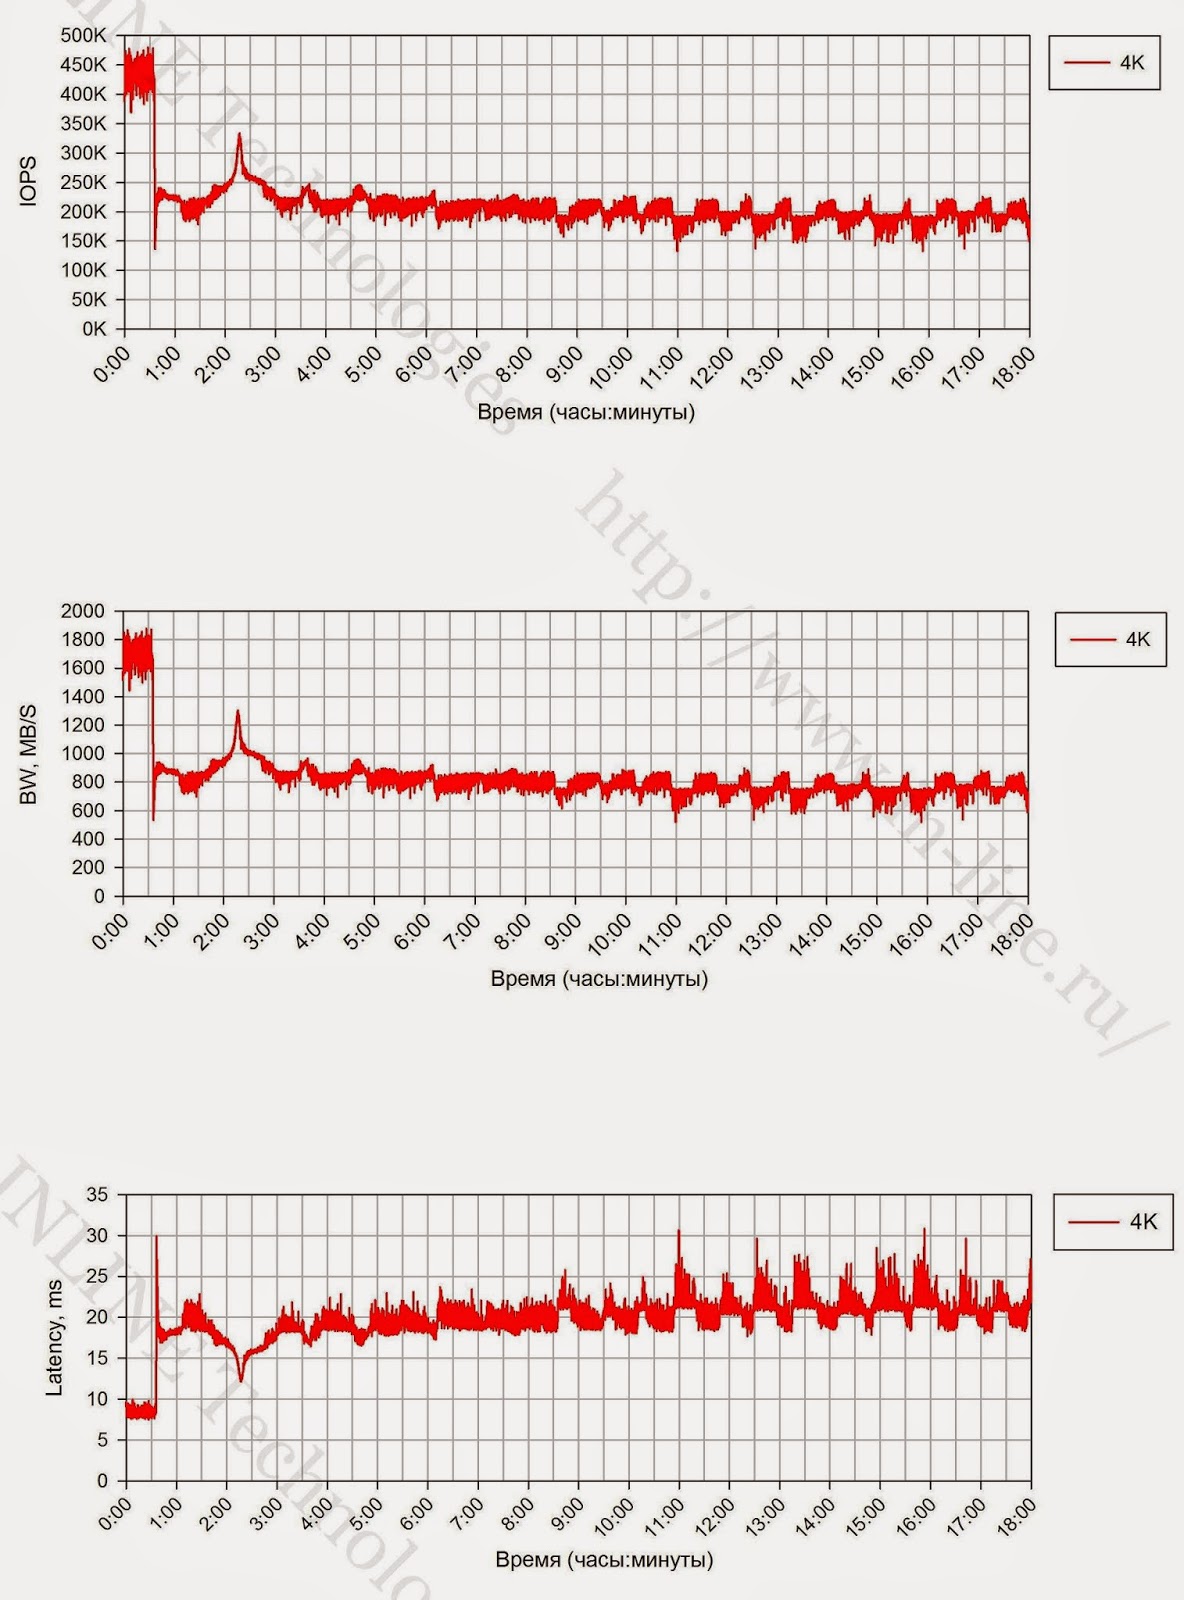 |
| Figure 3. Change in the speed of I / O operations (iops), data transfer rate (bandwidth) and latency (Latency) during long-term recording with the 4K unit. |
2. The block size during continuous recording load affects the performance of the GC process. So with small blocks (4K), the GC's speed is 640 MB / s, on medium and large blocks (16K-1M) CG operates at a speed of about 1200 MB / s.
3. The difference in the values of the maximum storage run time at peak performance, recorded during the first long test and subsequent equivalent test with a 4K block, is due to the fact that the storage was not completely filled before testing.
4. The maximum operating time of storage at peak performance differs significantly with the 4K block and all other blocks, which is most likely due to the limited storage space reserved for GC processes.
5. To perform service processes on the storage system, about 2TB is reserved.
6. When testing on storage systems 70% full, the performance drop occurs slightly later (about 10%). There are no changes in the speed of the GC processes.
Charts and tables. (All pictures are clickable)
Graphs of the performance of a block device with different types of load generated by a single server.
| Data rate (bandwidth) | I / O Speed (IOPS) | Latency | |
| Fully tagged storage (100% formated) | 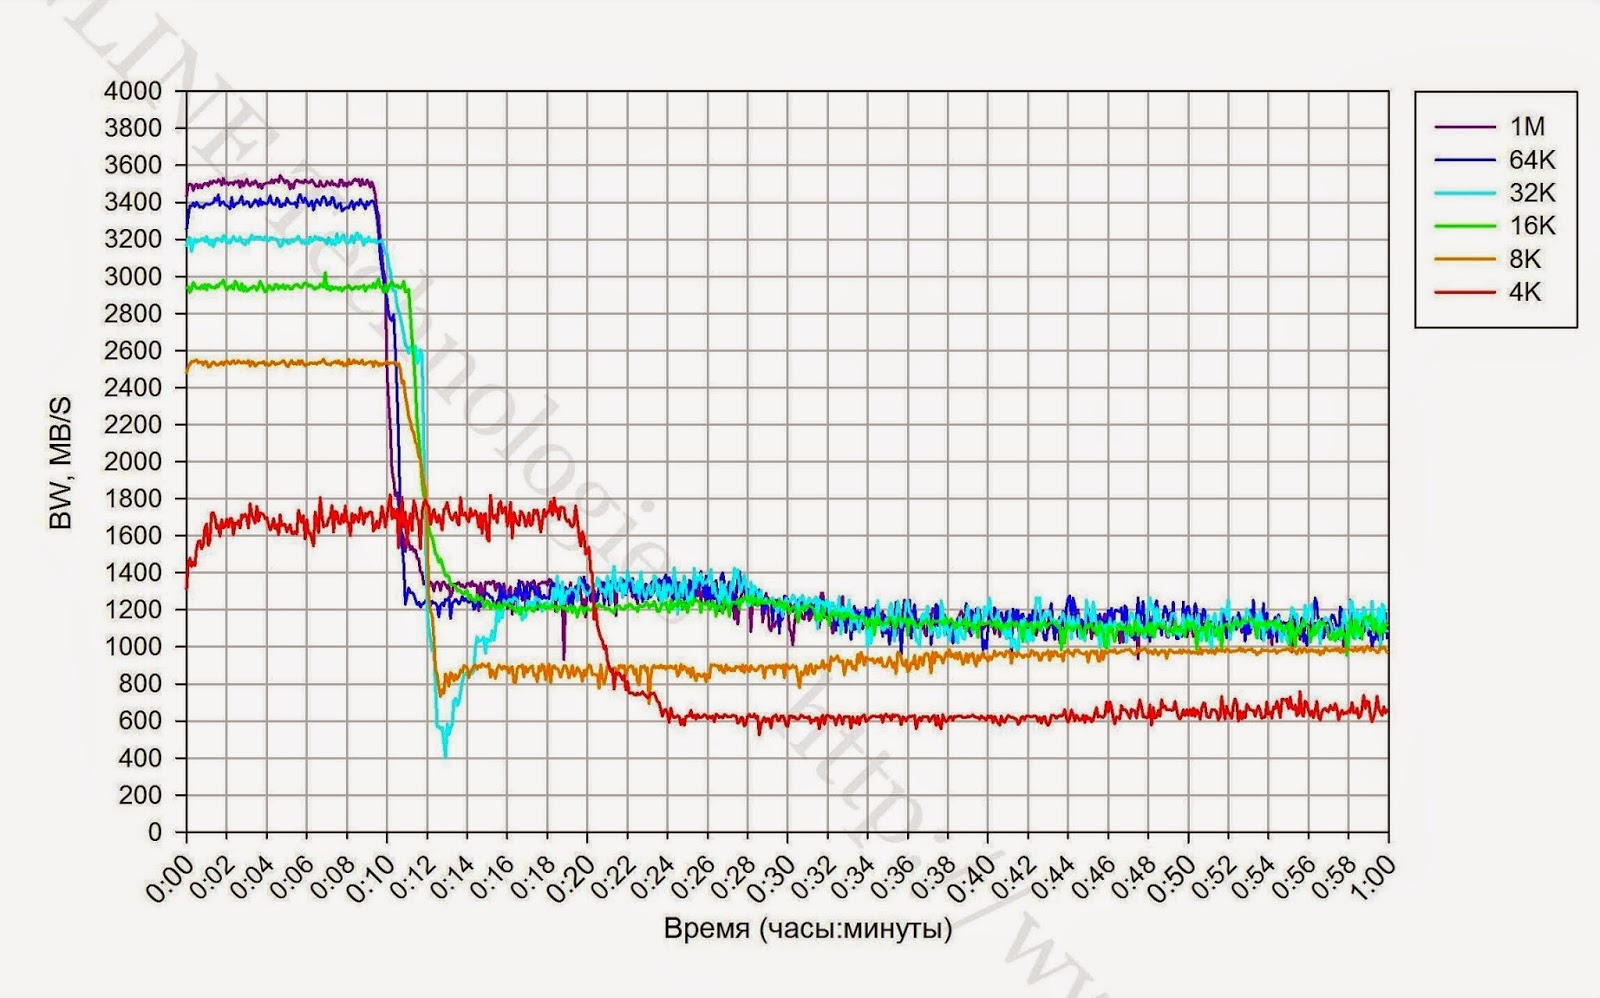 | 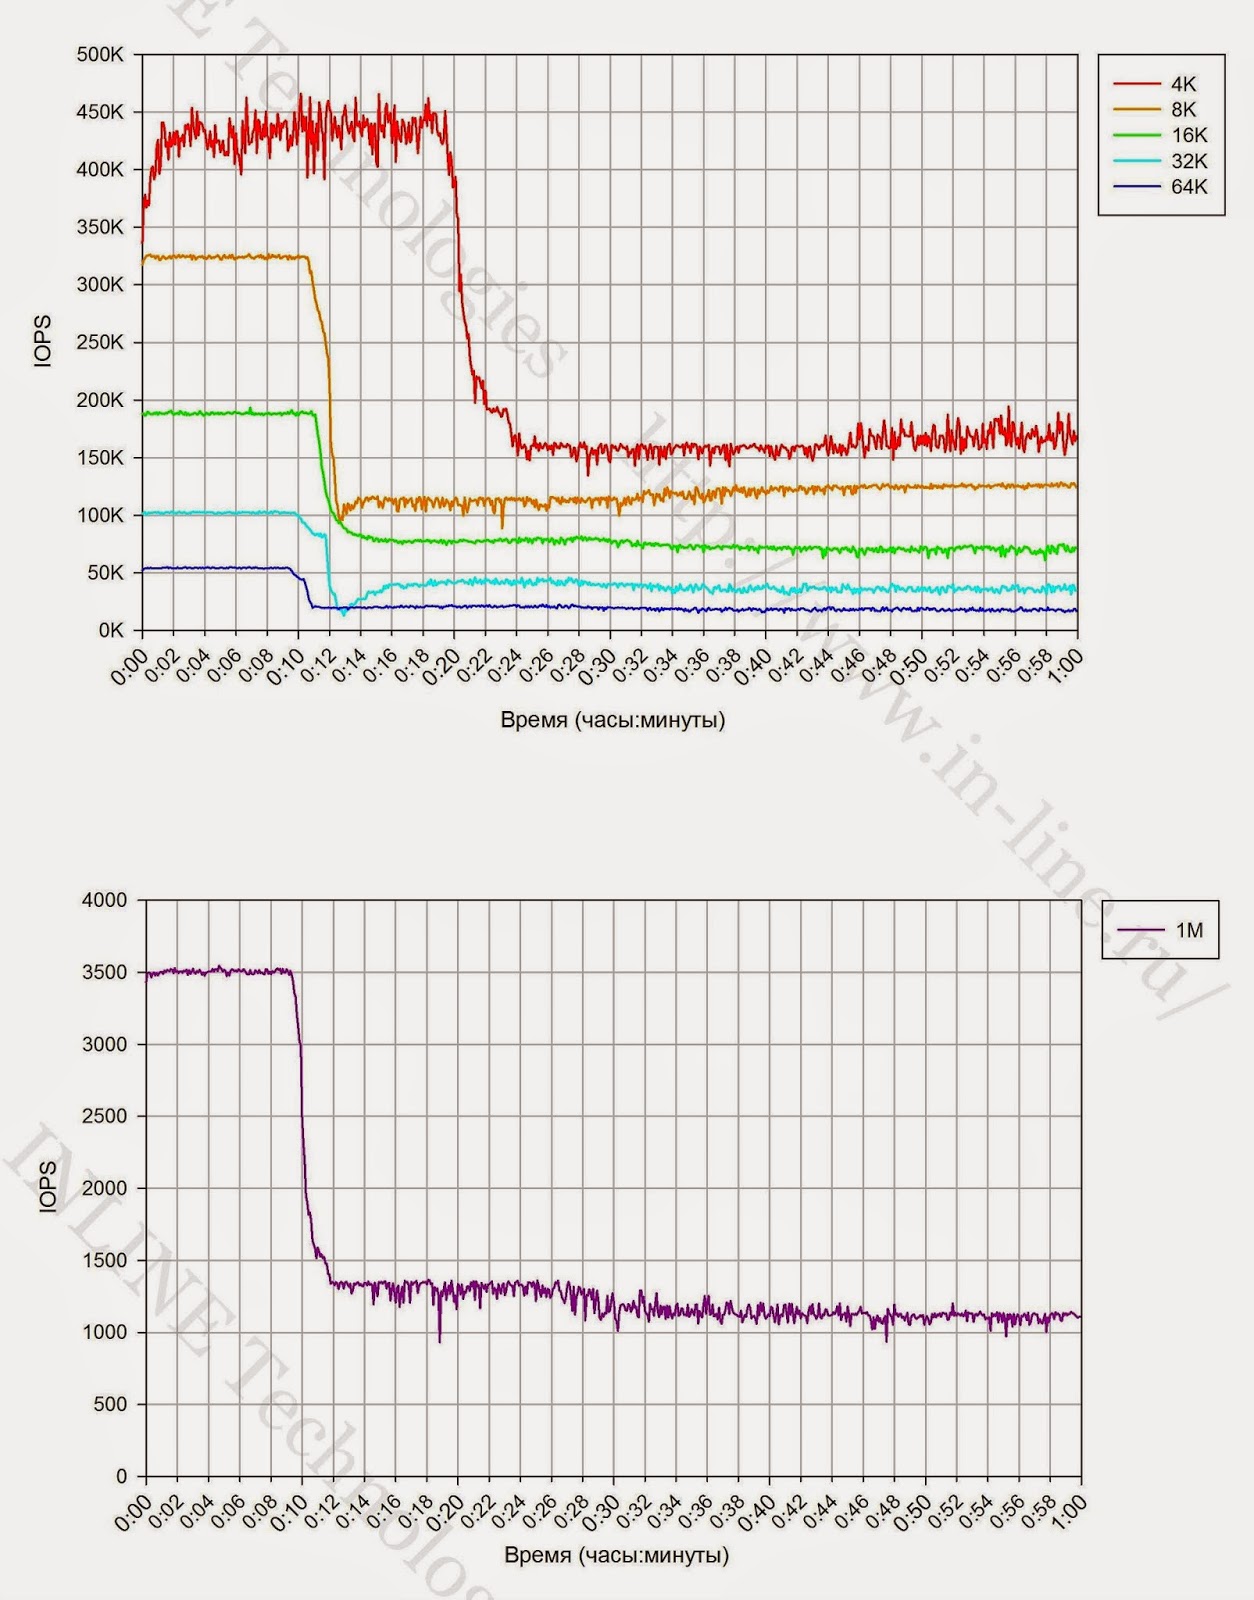 | 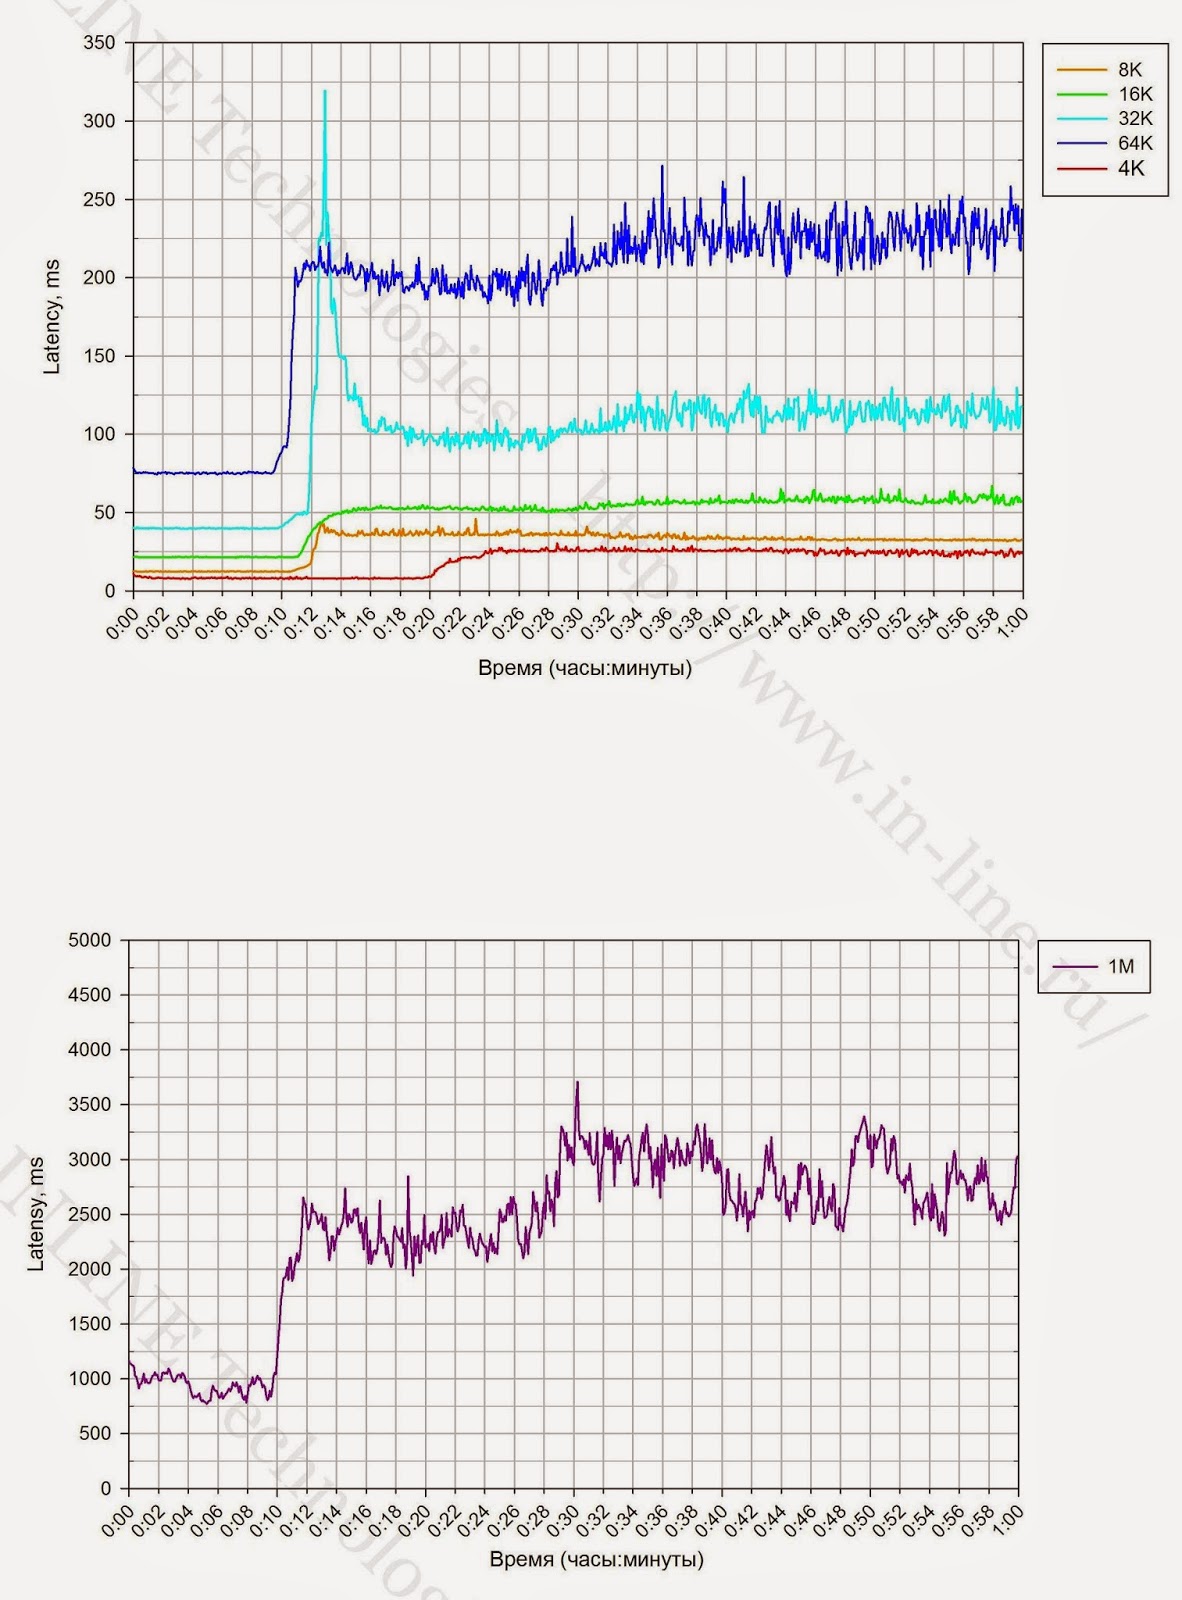 |
| Not completely marked storage (70% formated) | 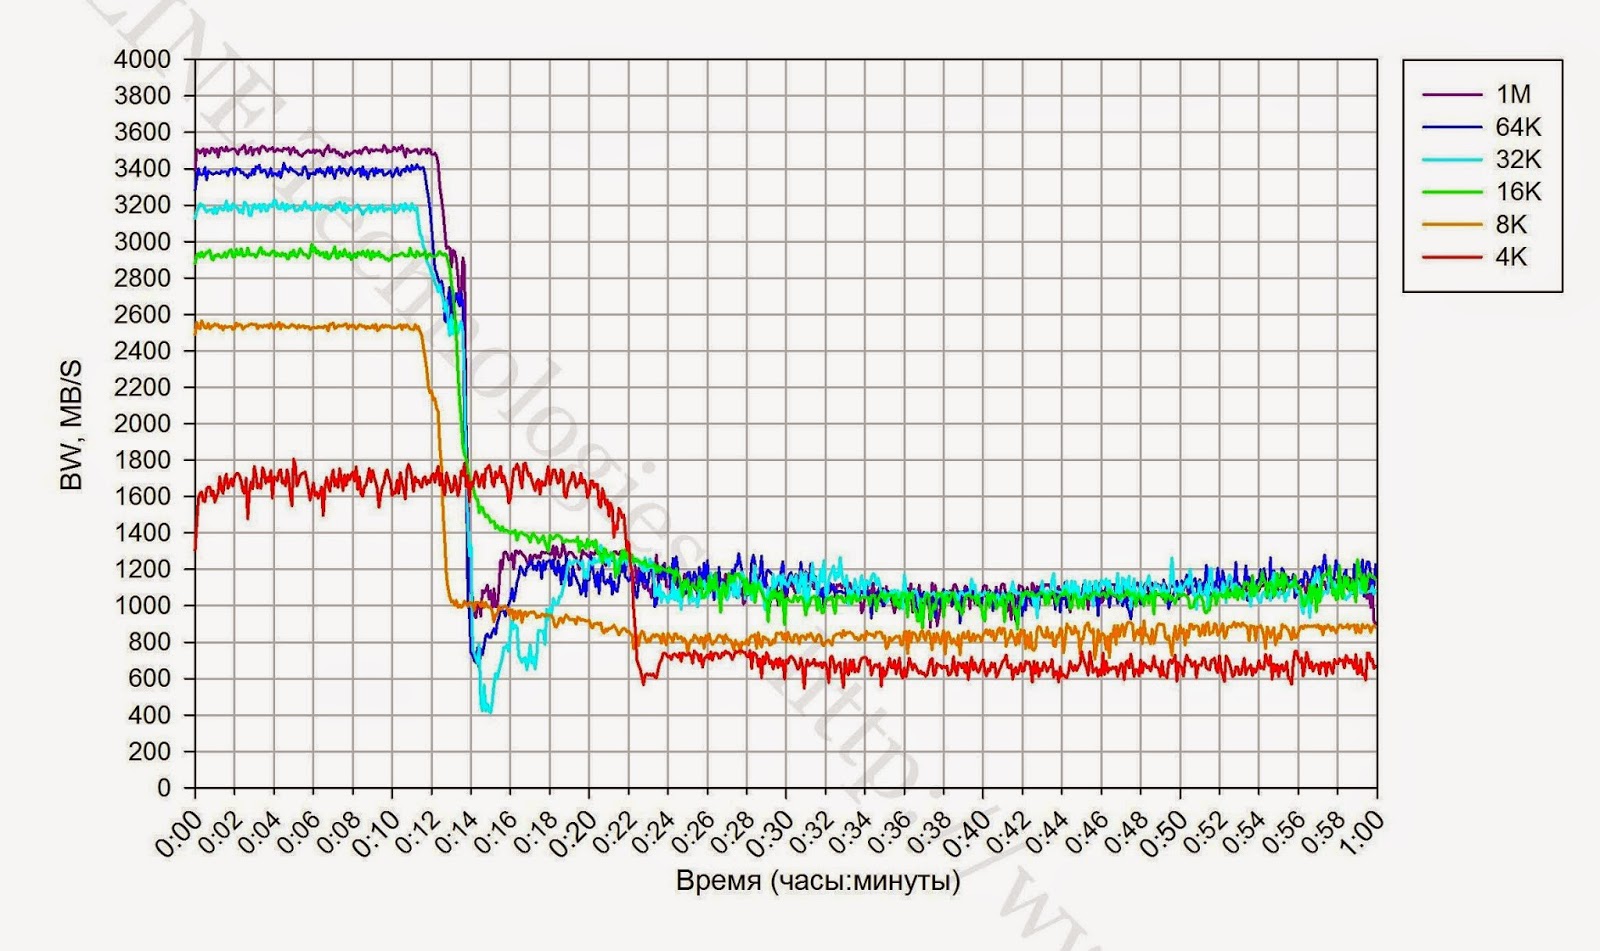 | 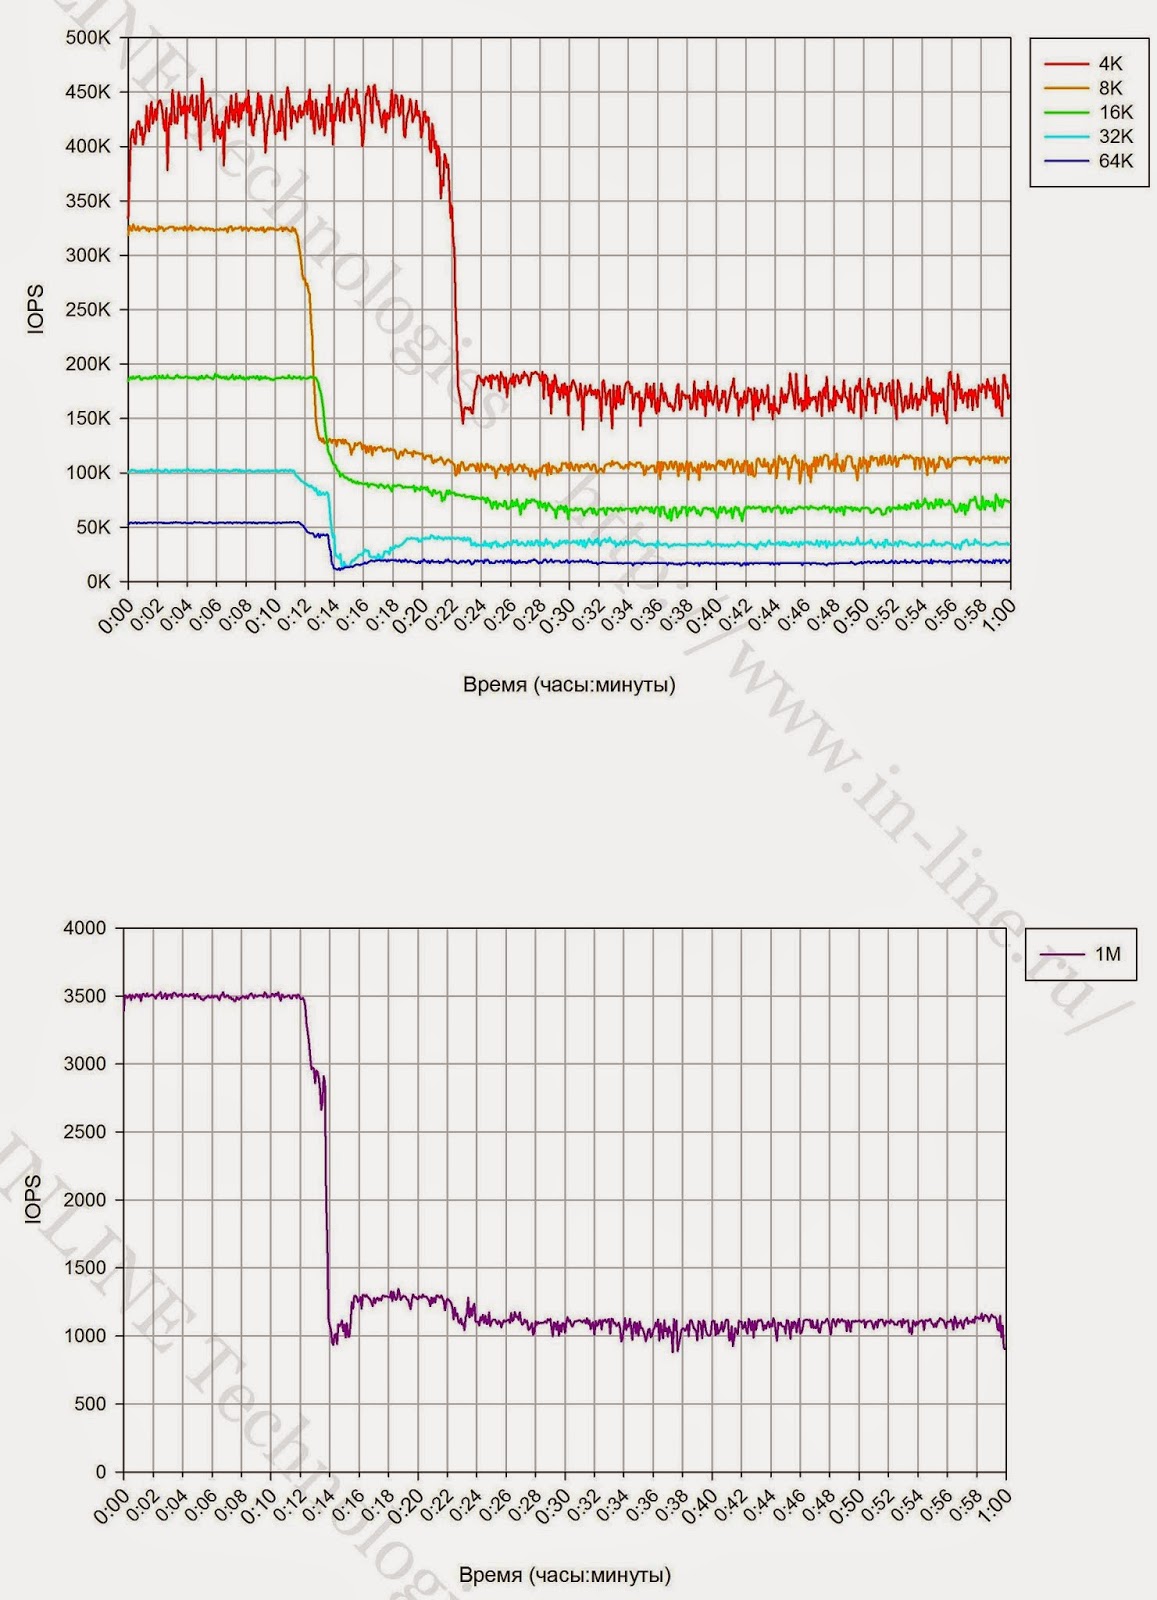 | 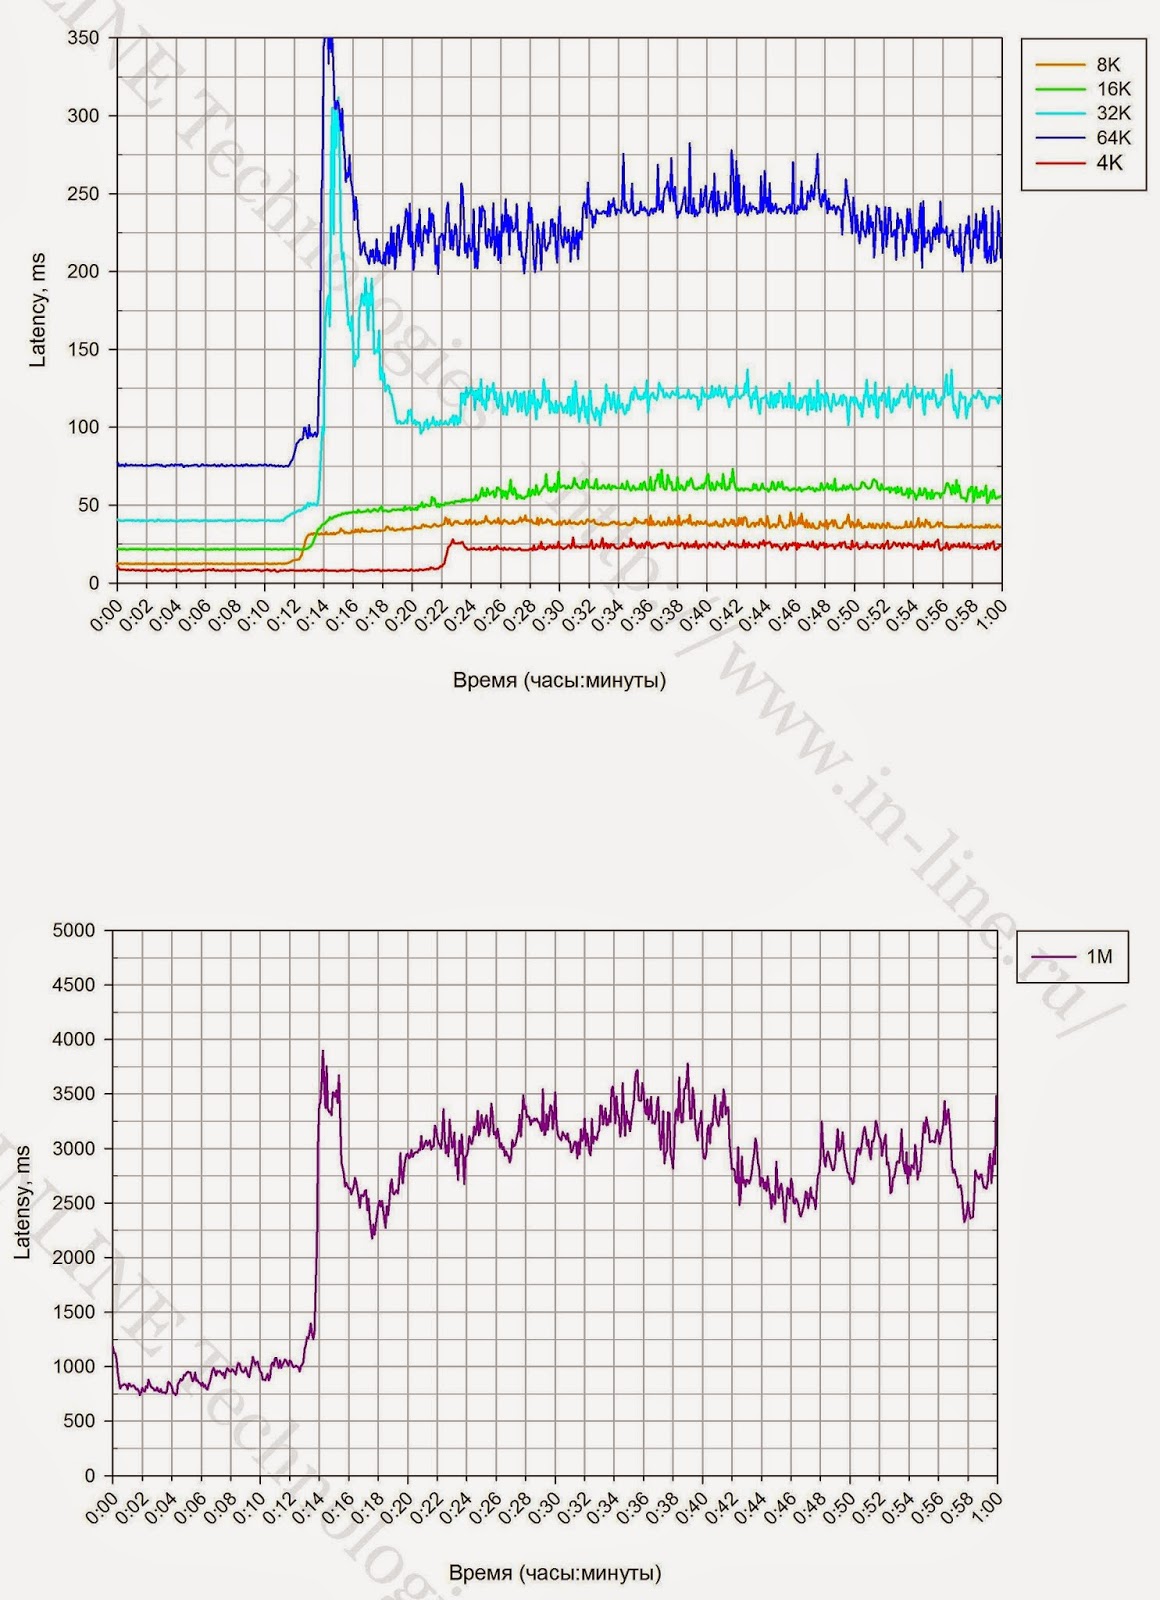 |
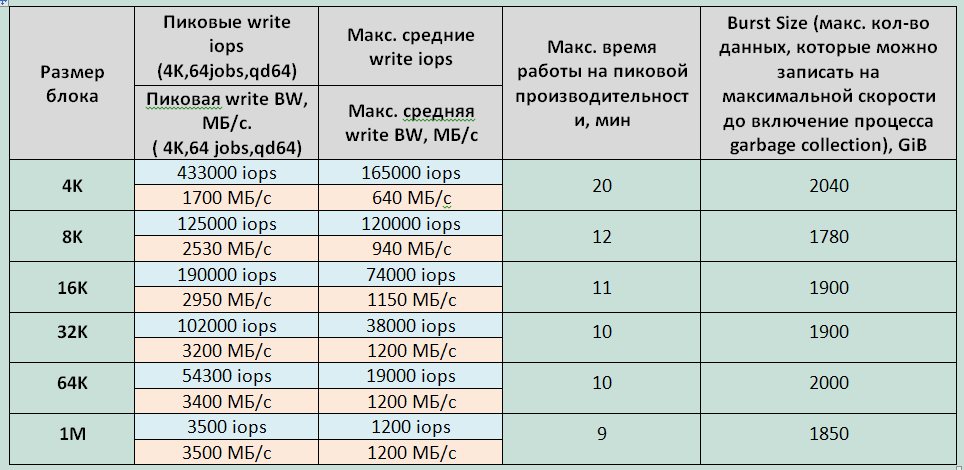 |
| Table 1 Dependence of SHD indicators on the block size with a long recording load. |
Group 2: Disk array performance tests for different types of load generated by a single server, performed at the block device level.
The main test results presented in the graphs are summarized in tables.
Tables and graphs. (All pictures are clickable)
Block device performance graphs for different types of load generated by two servers.
(All pictures are clickable)
 |
| Table 2 Storage performance for a single load generating process (jobs = 1) |
 |
| Table 3 Maximum storage performance for delays less than 1ms |
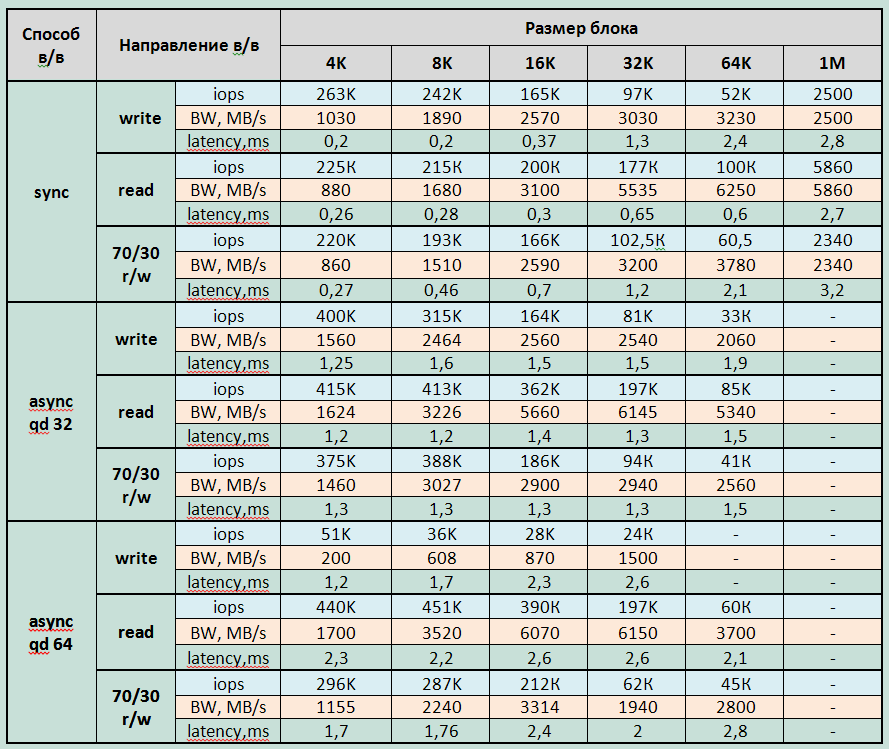 |
| Table 4. Maximum storage performance for delays up to 3ms |
 |
| Table 5 Maximum storage capacity for various load profiles. |
Block device performance graphs for different types of load generated by two servers.
(All pictures are clickable)
| Synchronous I / O | Asynchronous I / O with queue depth 32 | Asynchronous I / O with queue depth of 64 | |
| Random reading |  | 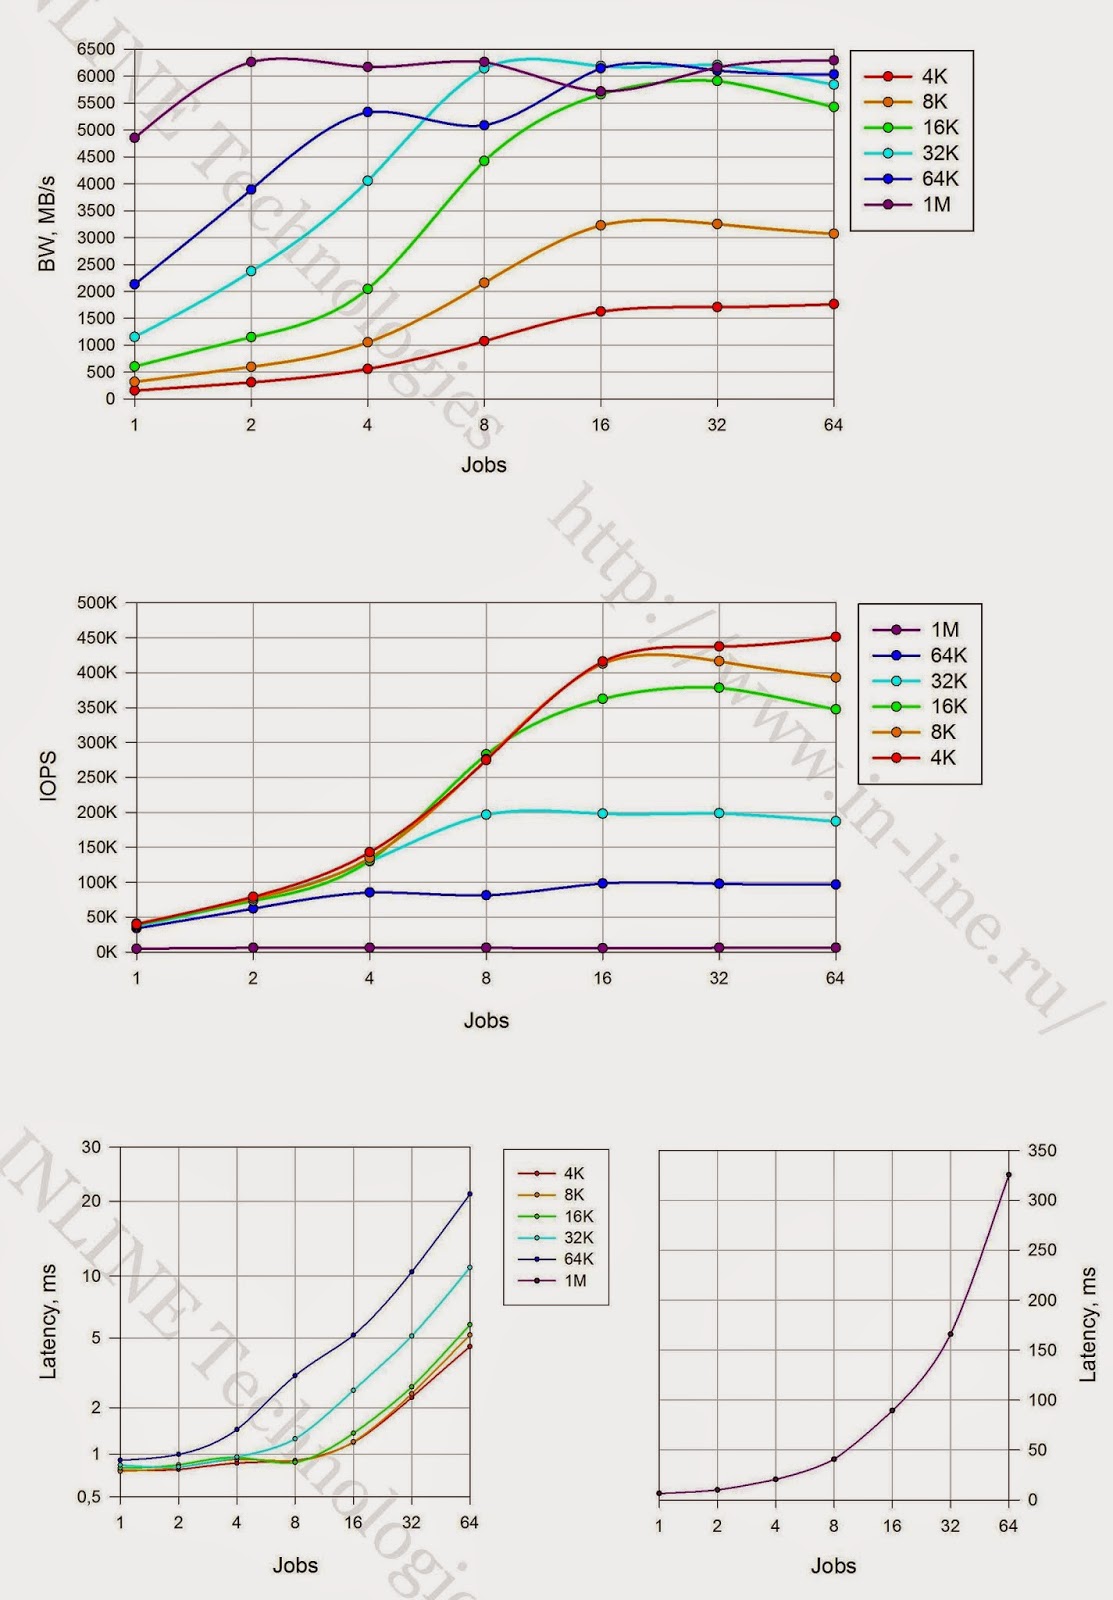 | 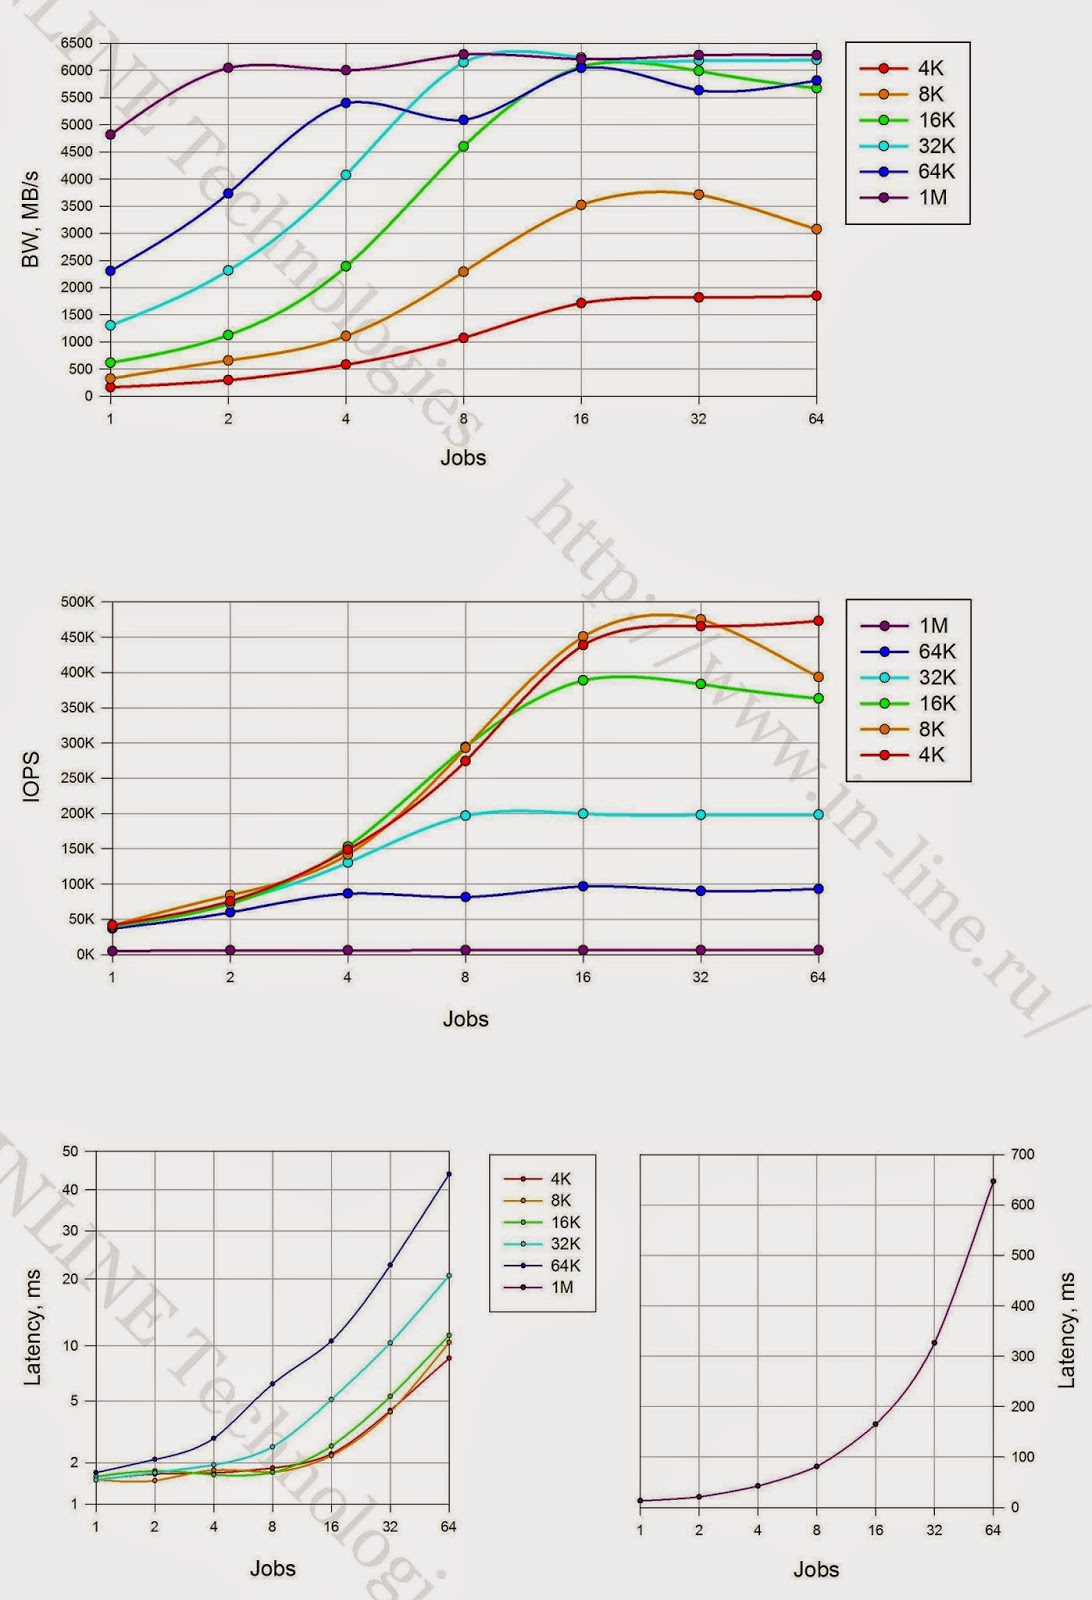 |
| At random recording | 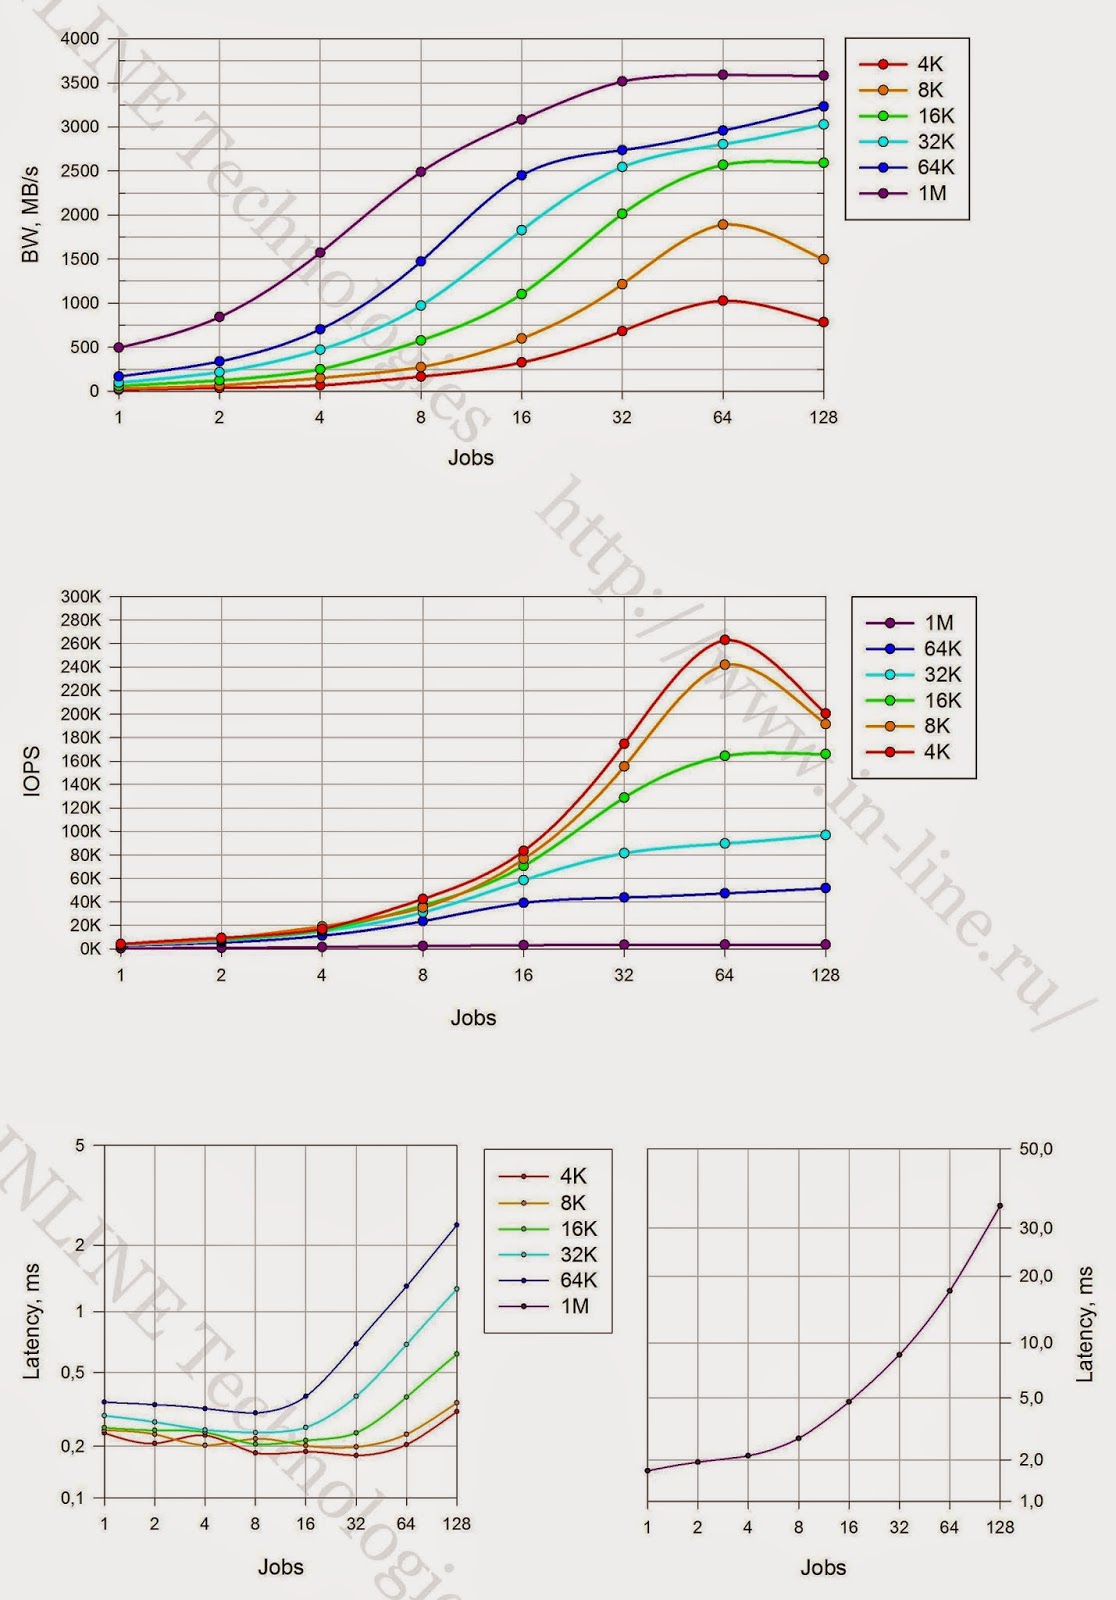 |  |  |
| At mixed load (70% read, 30% write) | 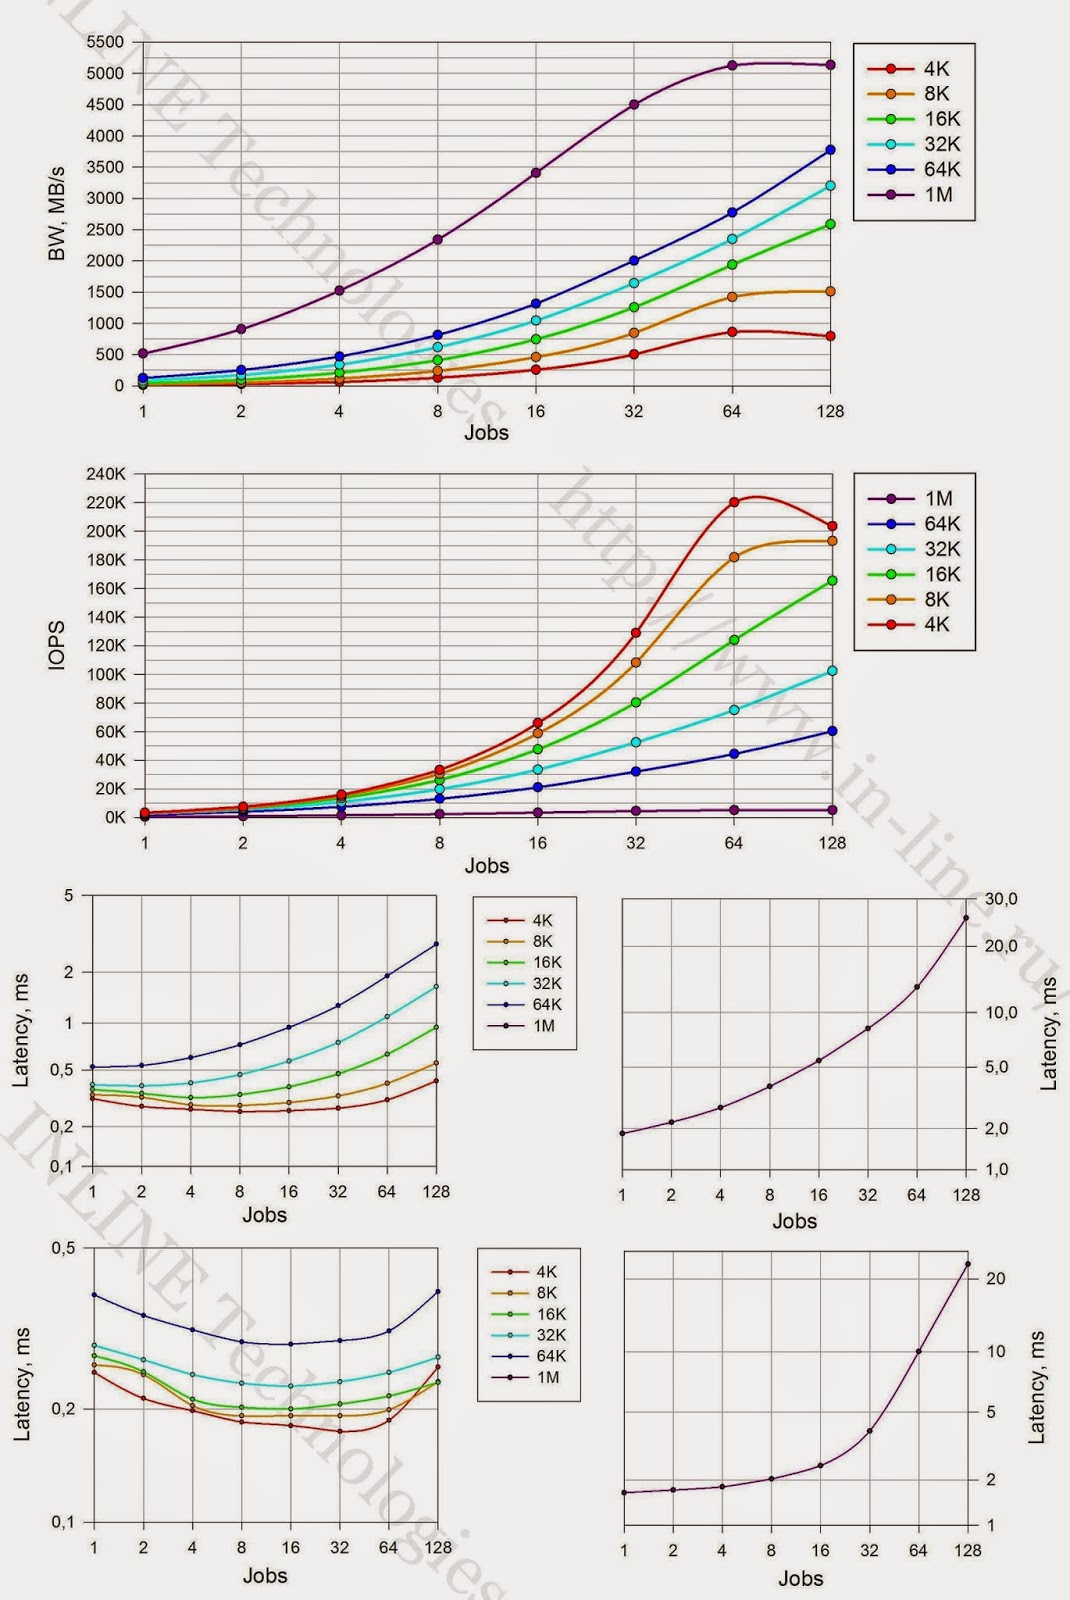 | 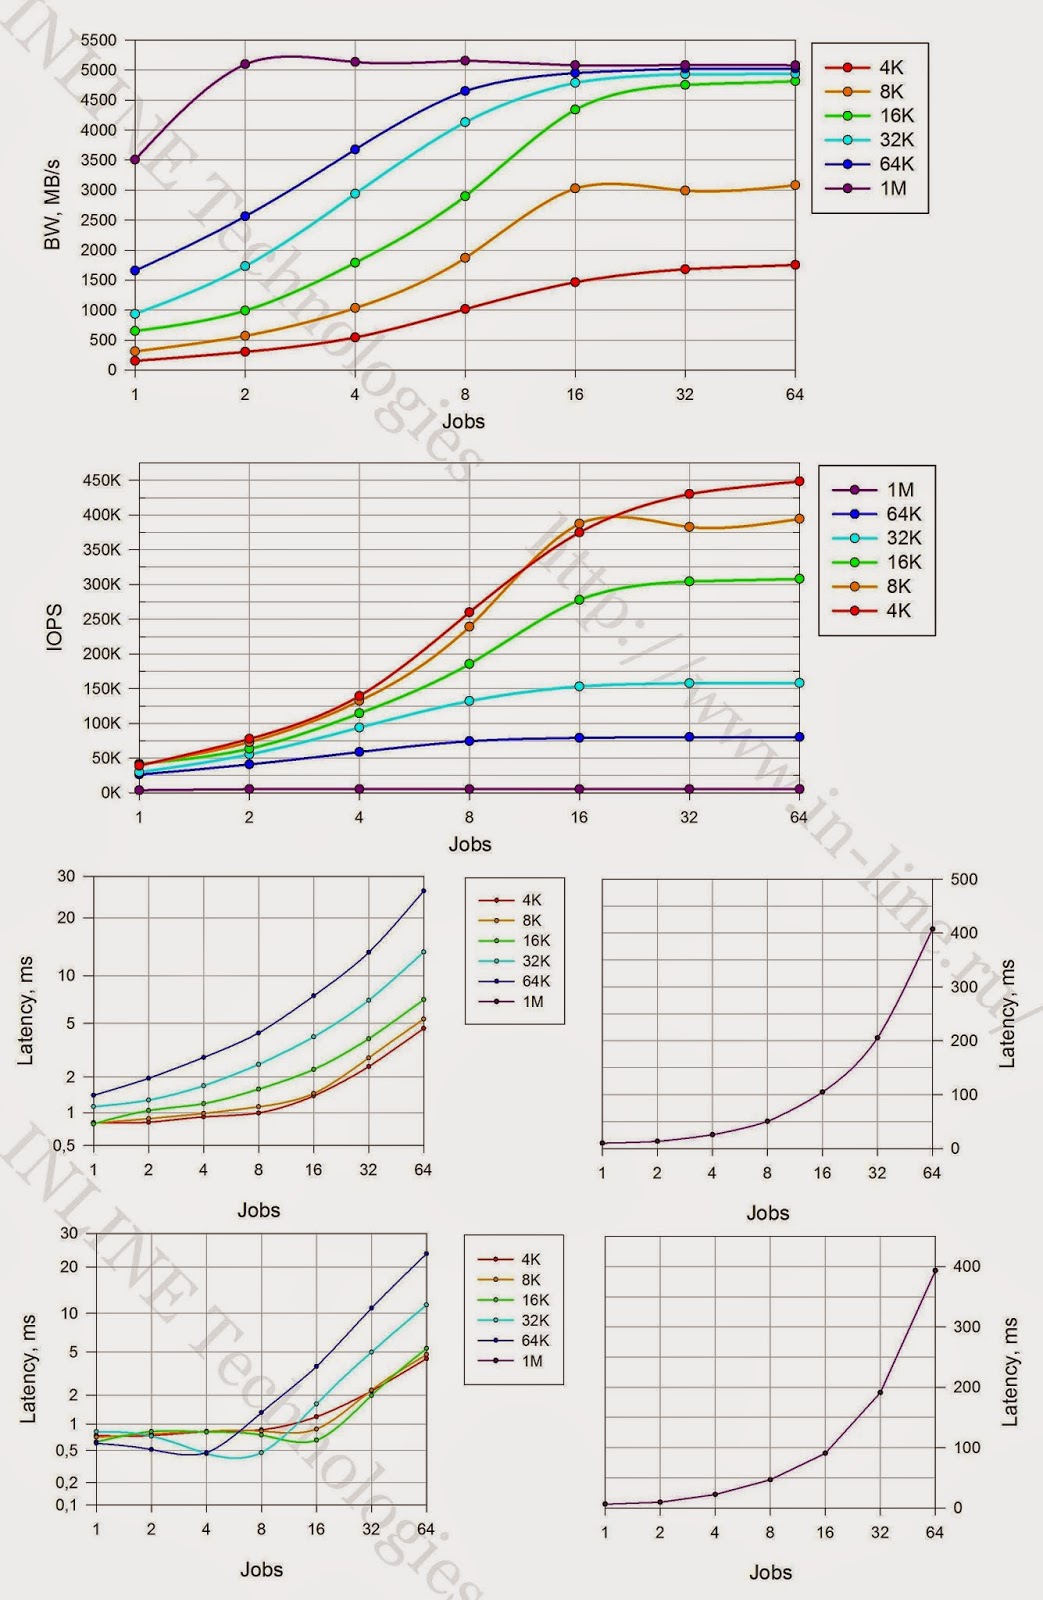 | 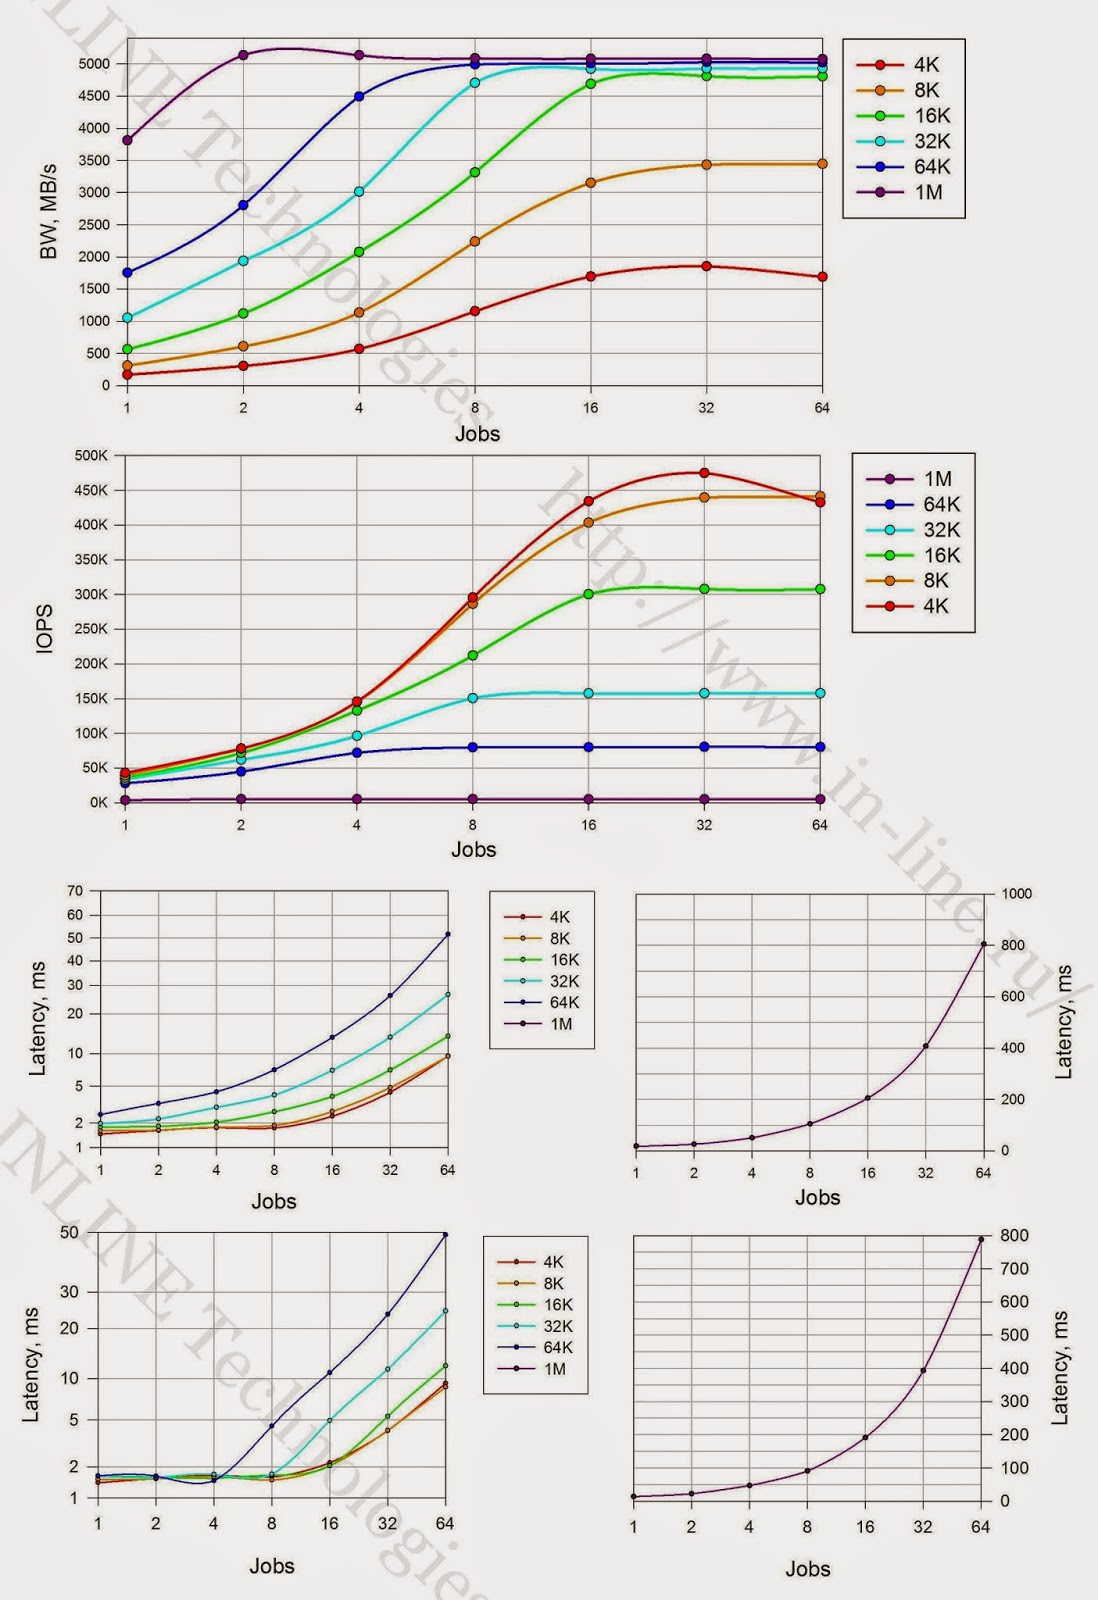 |
Conclusions:
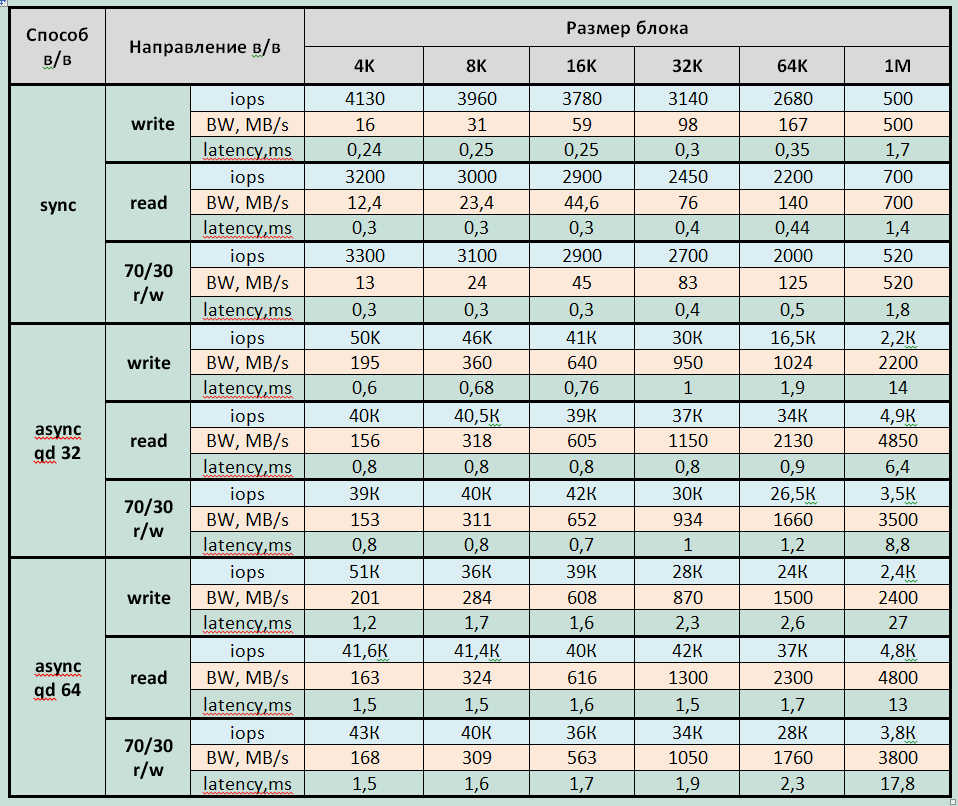
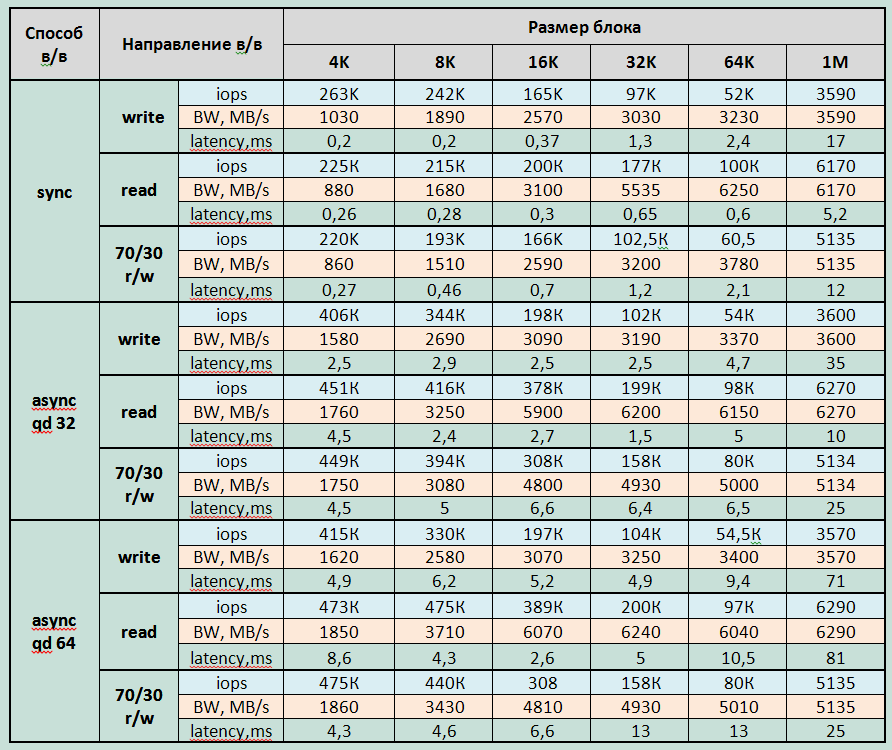
1. The maximum recorded performance parameters for storage (from the average for the duration of each test - 3 minutes):
Record:
- 415000 IOPS at 4.9ms latency (4KB async qd64 block)
- with synchronous I / O - 263000 IOPS with latency 0.2ms (4K block)
- Bandwidth: 3600MB / s for large blocks
Reading:
- 475000 IOPS at latency 4.3ms and 440000 IOPS at latency 2.3 (8KB async qd64 block);
- with synchronous I / O - 225000 IOPS with latency 0.26ms (4K block)
- Bandwidth: 6290MB / s for large blocks
Mixed Load (70/30 rw)
- 475000 IOPS at latency 4.3ms (4KB async qd64 block);
- with synchronous I / O - 220,000 IOPS with latency 0.27ms (4K block)
- Bandwidth 5135MB / s for large blocks.
Minimum latency:
- When recording - 0.177ms for a block of 4K jobs = 32 sync
- When reading - 0.25ms for a block of 4K jobs = 32 sync
2. SHD enters saturation mode at
- asynchronous I / O method with 8 jobs on large blocks (32K-1M) and 16 jobs on small and medium blocks (4-16K).
- synchronous I / O at 64 jobs.
3. On read operations in large blocks (16K-1M), a throughput of more than 6 GB / s was obtained, which roughly corresponds to the total throughput of the interfaces used when connecting the server to the storage system. Thus, neither storage controllers nor flash drives are a system bottleneck.
4. An array with an asynchronous I / O method produces 1.5 to 2 times more performance on small blocks (4-8K) than with a synchronous I / O method. On large and medium blocks (16K-1M), the performance with synchronous and asynchronous I / O is approximately equal.
5. The graphs below show the dependence of the maximum obtained performance indicators of the tested storage system (IOPS and data transfer rate) on the size of the I / O block. The nature of the graphs allows us to draw the following conclusions:
- при записи наиболее эффективным блоком для работы с СХД является блок 8К.
- при чтении синхронным способом в/в выгоднее работать блоком 16К и 32К
- при чтении асинхронным способом в/в лучший блок — 16К.
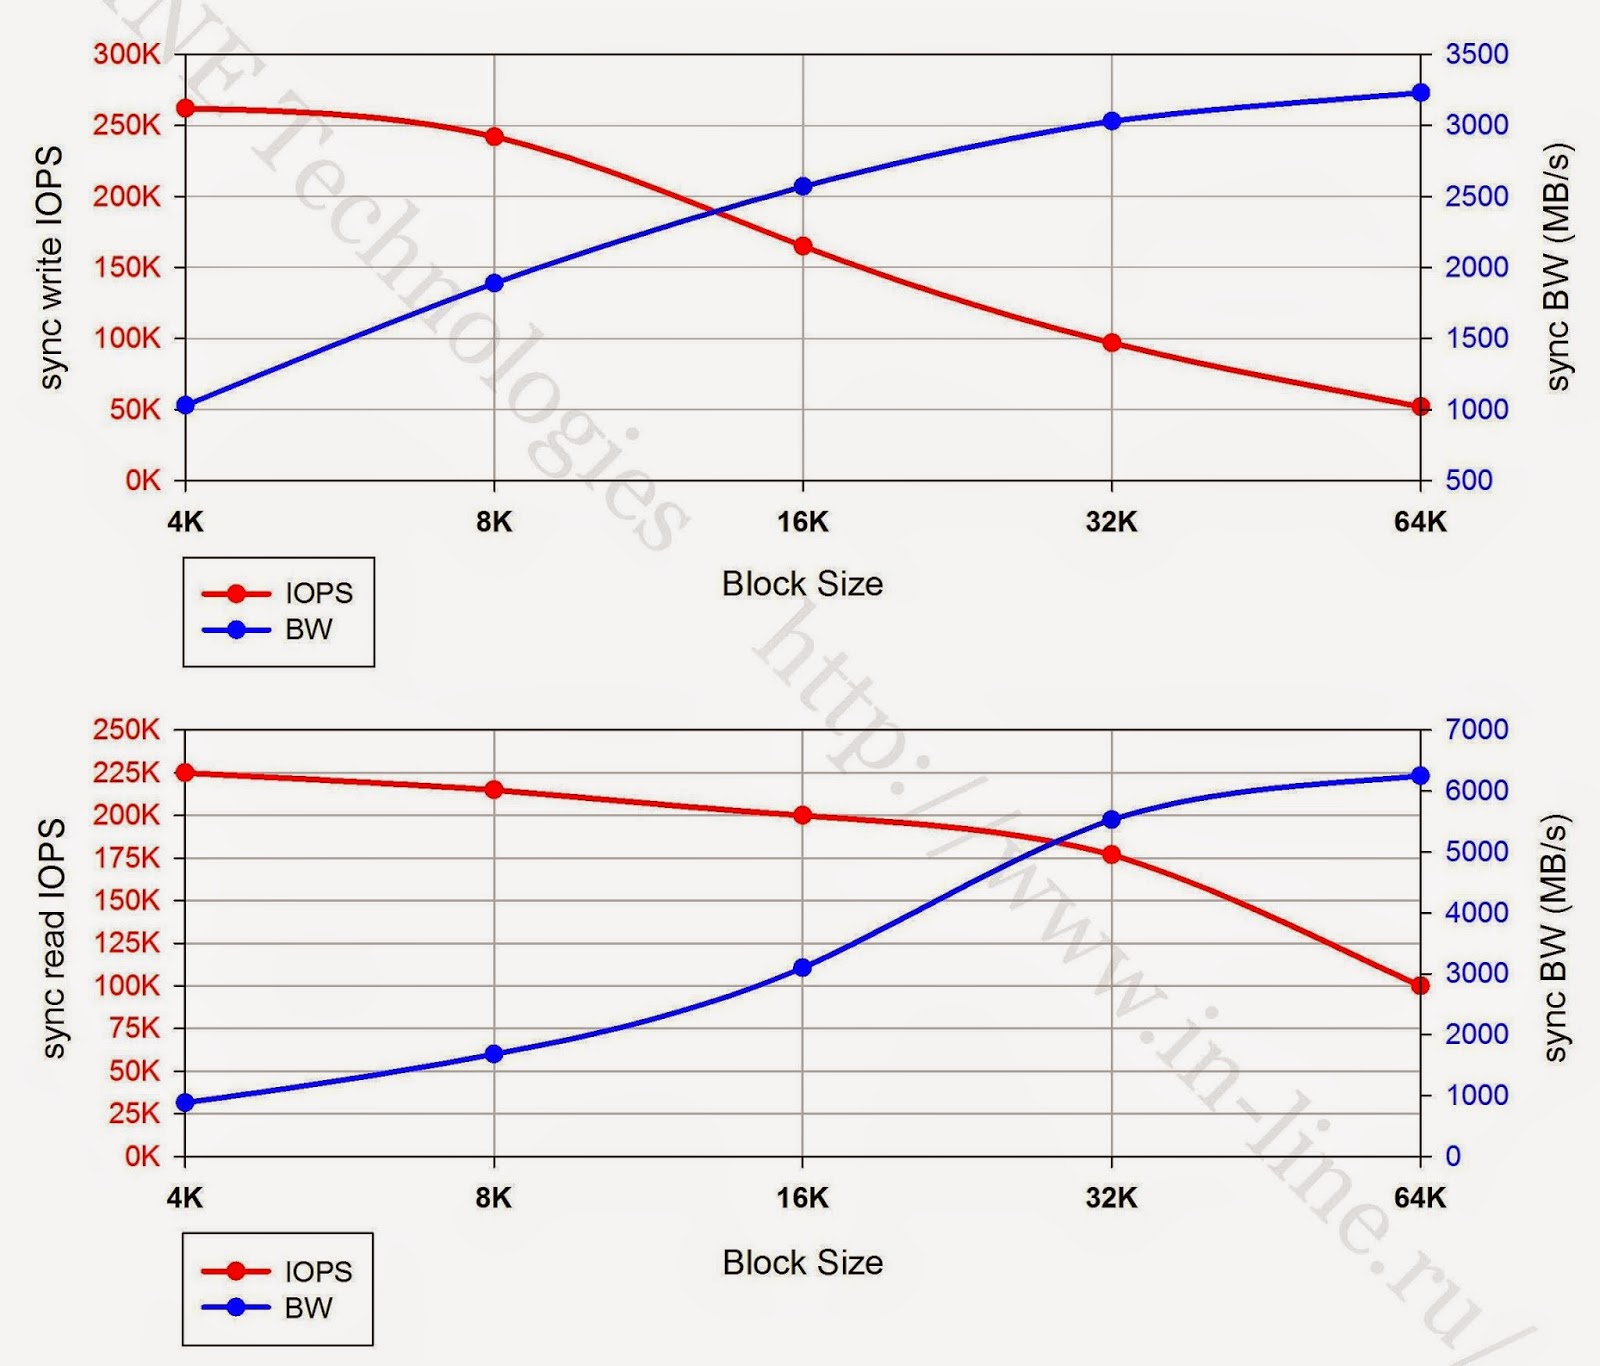 |
| Максимальные показатели производительности при чтении и записи синхронным способом в/в различным размером блока. |
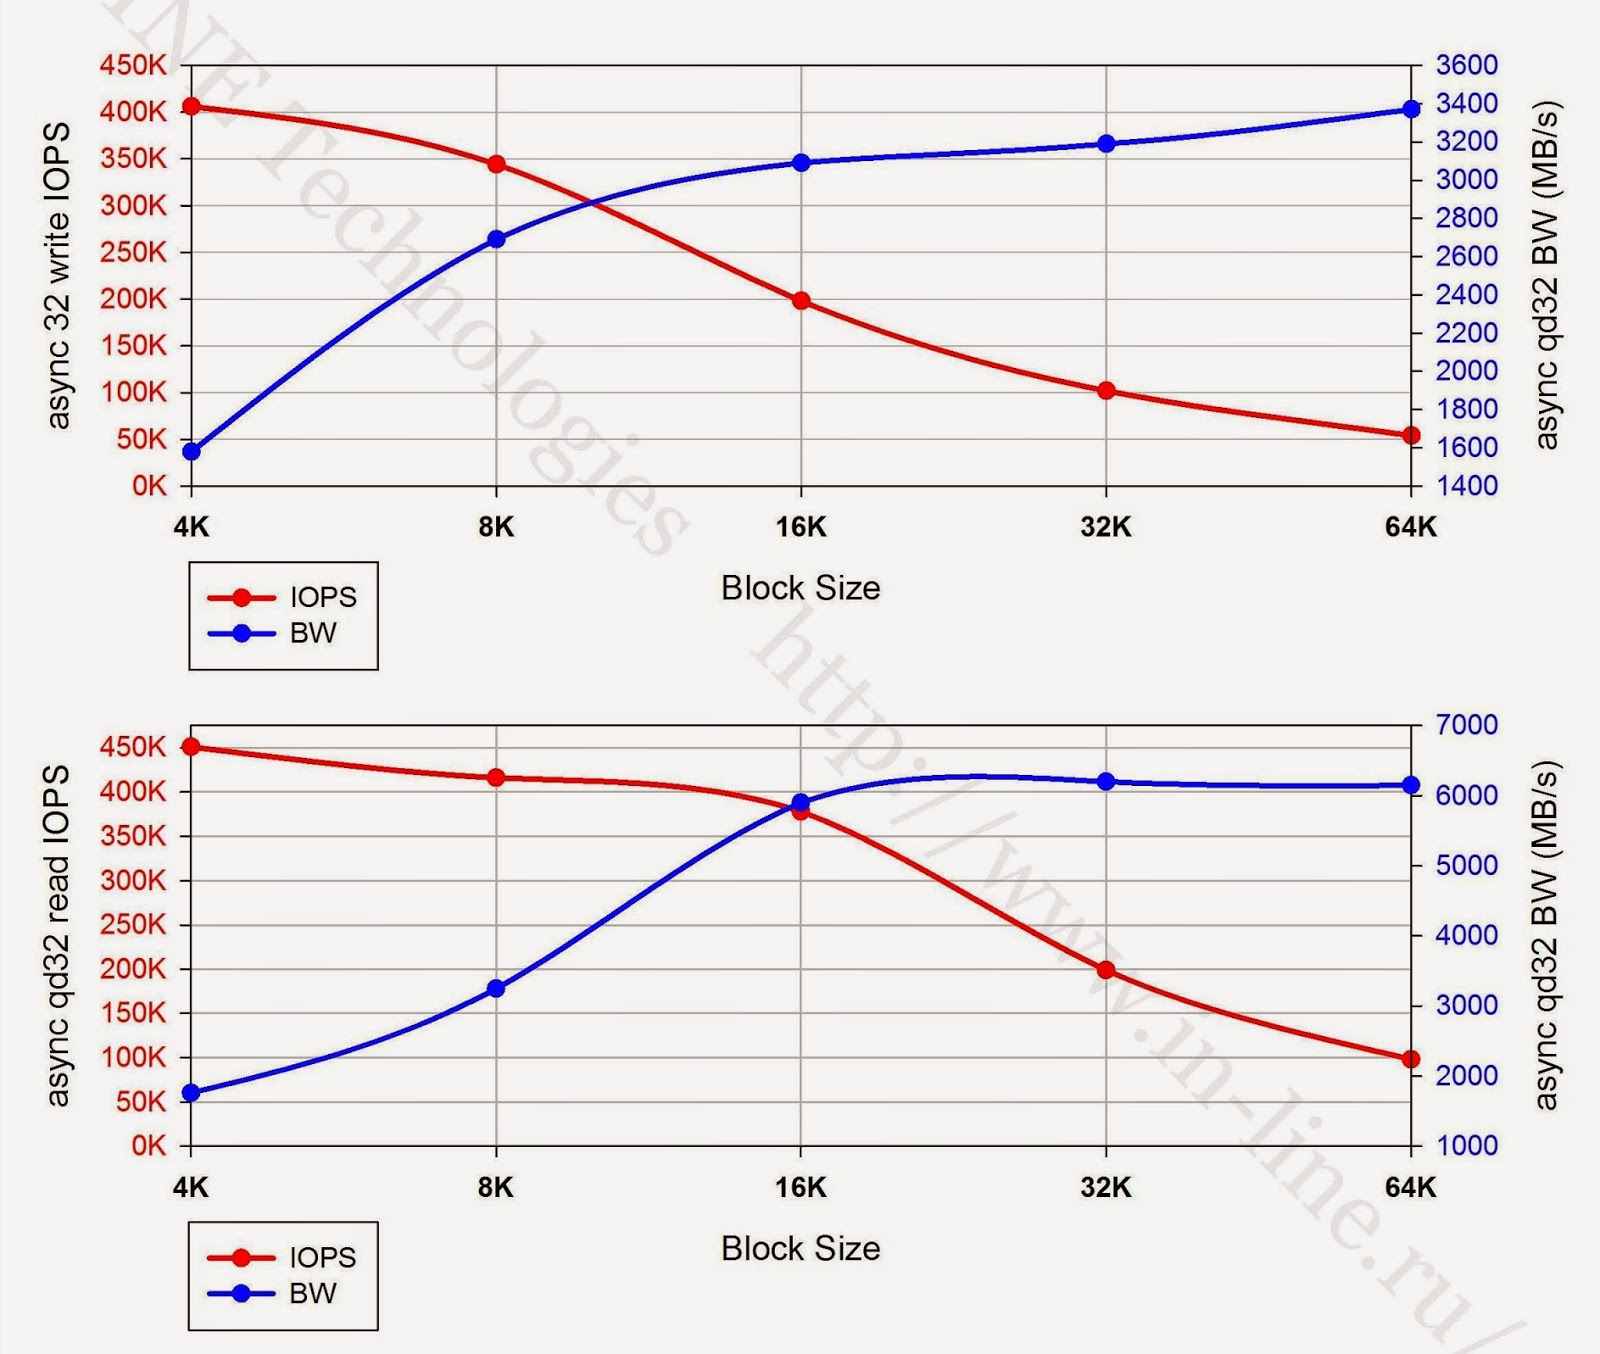 |
| Максимальные показатели производительности при чтении и записи асинхронным способом в/в (qd32) различным размером блока. |
Группа 3: Тесты производительности дискового массива при разных типах нагрузки, генерируемой двумя серверами, исполняемые на уровне блокового устройства.
For each of the tests, a performance was obtained that coincided within the error of 5% with the results of tests of group 2, when the load was generated by one server. We did not give graphs and performance data for tests of group 3, as a result of their identity with the results of group 2.
In other words, the study showed that the server is not a bottleneck in the test bench.
conclusions
In general, the system showed excellent results. We were not able to identify obvious bottlenecks and obvious problems. All results are stable and predictable. Comparing with our previous testing, the IBM FlashSystem 820 is worth noting the differences in the management interfaces. The 820th model is driven by the sometimes inconvenient java applet inherited from the Texas Instruments RamSan 820. At the same time, the 840th has a web-interface familiar to IBM products reminiscent of the XIV Storage System and Storwize. Working with them is noticeably nicer and, ultimately, faster.
In addition, the IBM FlashSystem 840 has acquired the capabilities necessary for enterprise-class devices to hot-swap all components and update firmware on the fly. The choice of possible connection interfaces and flash module configurations has expanded significantly.
The disadvantages, perhaps, include the presence of degradation of performance during long recordings. Although, this is rather a drawback of today's flash memory technologies, manifested as a result of the fact that the manufacturer did not artificially limit the speed of the system. Even with a long maximum recording load and after a drop in performance, the storage system showed remarkable results.
PS The author is grateful to Pavel Katasonov, Yuri Rakitin, and all other company employees who participated in the preparation of this material.