Budget SAN Storage on LSI Syncro, Part 2
- Tutorial

Continue, the first part is here .
Cluster
So, let's start setting up the software that manages the cluster.
We will have this Pacemaker + Corosync as a transport backend for communication between nodes.
Corosync, for greater reliability, supports operation across multiple communication rings.
Moreover, three or more are no longer pulled, although the docks do not specifically mention this anywhere, only swears at startup if you specify more than two in the config.
Rings are named so because communication between nodes goes in a ring - the nodes transmit data to each other sequentially, at the same time checking the survivability of each other. It works on UDP, it can be both multicast and uniqueness. We will have the last one, why - it will be clear below.
Rings
For communication between nodes, I decided to use a somewhat paranoid scheme - an outer ring through the switches (here is the standard Bonding / Etherchannel for two switches) + an inner ring that connects the nodes directly (I remind you that there are three of them - two storages + witness).
The scheme is as follows:

Green ties - the inner ring, black - the outer. In this topology, the nodes will have to maintain connectivity even with a complete failure of external devices (the switches put the storm, the administrator (that is, I) screwed up something with his crooked hands ... it is unlikely, but it can be).
But there was a plug - how to organize a free exchange of data between nodes on the inner ring? But this is precisely the topology of the ring, which is not very typical for Ethernet. The connection between any two nodes must be maintained when any of the three links forming the ring break.
The following options were considered:
- Normal Ethernet bridge + STP for loop breaks. When tuning STP timers, you can achieve convergence in 5-6 seconds.
For us it’s eternity, it won’t work. - Relatively recently added to the kernel HSR protocol . In short, it was conceived for failover communications in Ring and Mesh topologies with instant convergence. The two interfaces are combined in a kind of bridge and packets, with additional headers, go to both interfaces simultaneously. Incoming packages that are not intended for us are forwarded further along the ring. To cut the loops, identifiers from the packet header are used (that is, what has already been sent - we discard it in that spirit).
It looks nice and tasty, but the implementation is lame: even in the last stable kernel 3.18, when the HSR device is removed, this kernel itself crashes (already corrected in GIT).
But, even if I didn’t delete it — it works weirdly, I couldn’t run iperf around the ring to measure speed (which should be about 50% of the nominal) - the traffic did not go, although the pings were running, I didn’t understand further.
In general, we also sweep. - OSPF Considering that L2 connectivity is not important for Corosync, this turned out to be the most suitable option. The convergence time is about 100ms, which suits us perfectly.
Quagga
To implement OSPF, use Quaggu. There is also a BIRD project from our Czech neighbors, but I’m somehow more familiar with Quagga. Although BIRD, according to some tests, works faster and takes up less memory, but in our reality this is, in general, by drum.
Each link between hosts will be a separate / 24 network. Yes, you can use / 30 or even / 31, but these networks will not be routed anywhere, so there wasn’t much point in saving.
On each host, create a dummy interface with the IP address / 32 for the announcement to the neighbors, Corosync will communicate through them. It was possible to hang this address on Loopback, but a separate interface for these purposes seemed to me more suitable.
Sample chunks of / etc / network / interfaces :
Storage1
# To Storage-2
auto int1
iface int1 inet static
    address 192.168.160.74
    netmask 255.255.255.0
# To Witness
auto ext2
iface ext2 inet static
    address 192.168.161.74
    netmask 255.255.255.0
# Dummy loopback
auto dummy0
iface dummy0 inet static
    address 192.168.163.74
    netmask 255.255.255.255
Storage2
# To Storage-1
auto int1
iface int1 inet static
    address 192.168.160.75
    netmask 255.255.255.0
# To Witness
auto ext2
iface ext2 inet static
    address 192.168.162.75
    netmask 255.255.255.0
# Dummy loopback
auto dummy0
iface dummy0 inet static
    address 192.168.163.75
    netmask 255.255.255.255
Witness
The naming of network interfaces (intN, extN) here according to the principle of whether it is built-in or an external adapter + the serial number of the port on it, it’s more convenient for me. # To Storage-1
auto int2
iface int2 inet static
address 192.168.161.76
netmask 255.255.255.0
# To Storage-2
auto ext2
iface ext2 inet static
address 192.168.162.76
netmask 255.255.255.0
# Dummy loopback
auto dummy0
iface dummy0 inet static
address 192.168.163.76
netmask 255.255.255.255
Next, configure OSPF.
/etc/quagga/ospfd.conf :
Storage1
hostname storage1
interface int1
    ip ospf dead-interval minimal hello-multiplier 10
    ip ospf retransmit-interval 3
interface ext2
    ip ospf dead-interval minimal hello-multiplier 10
    ip ospf retransmit-interval 3
router ospf
    log-adjacency-changes
    network 192.168.160.0/24 area 0
    network 192.168.161.0/24 area 0
    network 192.168.163.74/32 area 0
    passive-interface dummy0
    timers throttle spf 10 10 100
Storage2
hostname storage2
interface int1
    ip ospf dead-interval minimal hello-multiplier 10
    ip ospf retransmit-interval 3
interface ext2
    ip ospf dead-interval minimal hello-multiplier 10
    ip ospf retransmit-interval 3
router ospf
    log-adjacency-changes
    network 192.168.160.0/24 area 0
    network 192.168.162.0/24 area 0
    network 192.168.163.75/32 area 0
    passive-interface dummy0
    timers throttle spf 10 10 100
Witness
hostname witness
interface int2
    ip ospf dead-interval minimal hello-multiplier 10
    ip ospf retransmit-interval 3
interface ext2
    ip ospf dead-interval minimal hello-multiplier 10
    ip ospf retransmit-interval 3
router ospf
    log-adjacency-changes
    network 192.168.161.0/24 area 0
    network 192.168.162.0/24 area 0
    network 192.168.163.76/32 area 0
    passive-interface dummy0
    timers throttle spf 10 10 100
Turn on net.ipv4.ip_forward on the hosts , run quagga, ping with an interval of 0.01s, and break the ring:
root@witness:/# ping -i 0.01 -f 192.168.163.74
...
root@storage1:/# ip link set ext2 down
root@witness:/#
--- 192.168.163.74 ping statistics ---
2212 packets transmitted, 2202 received, 0% packet loss, time 26531ms
rtt min/avg/max/mdev = 0.067/0.126/0.246/0.045 ms, ipg/ewma 11.999/0.183 ms
In total, 10 packets were lost, this is about 100ms - OSPF changed routes very quickly.
Corosync
Now that the network subsystem is ready, we will configure Corosync for its operation.
The config on all hosts should be almost identical, only the address dummy0 of the interface in the inner ring changes:
/etc/corosync/corosync.conf
compatibility: none
totem {
    version: 2
    # Произвольное имя
    cluster_name: storage
    # Аутентификация через файл authkey, который мы раскидали по всем нодам в прошлой части. Лишней не будет.
    secauth: on
    # Включаем дополнительный контроль живости нод
    heartbeat_failures_allowed: 3
    threads: 6
    # Режим отказоустойчивых колец активный - юзать сразу оба кольца. Об особенностях читать в доках.
    rrp_mode: active
    # Не использовать мультикаст - для нас это важно, так как городить мультикаст роутинг через OSPF нет никакого желания.
    transport: udpu
    # Внешнее кольцо, перечисляем адреса нод
    interface {
        member {
            memberaddr: 10.1.195.74
        }
        member {
            memberaddr: 10.1.195.75
        }
        member {
            memberaddr: 10.1.195.76
        }
        ringnumber: 0
        # Сеть адаптера, к которому будем привязываться
        bindnetaddr: 10.1.195.0
        # Порт для обмена сообщениями. Несмотря на название используется и в уникасте. Также резервируется (mcastport-1) для приёма.
        mcastport: 6405
    }
    # Внутреннее кольцо
    interface {
        member {
            memberaddr: 192.168.163.74
        }
        member {
            memberaddr: 192.168.163.75
        }
        member {
            memberaddr: 192.168.163.76
        }
        ringnumber: 1
        # Этот адрес выставить соответственно адресу dummy0
        bindnetaddr: 192.168.163.76
        mcastport: 5405
    }
}
# Дальше всё стандартно
amf {
    mode: disabled
}
service {
    ver: 1
    name: pacemaker
}
aisexec {
    user: root
    group: root
}
logging {
    syslog_priority: warning
    fileline: off
    to_stderr: yes
    to_logfile: no
    to_syslog: yes
    syslog_facility: daemon
    debug: off
    timestamp: on
    logger_subsys {
        subsys: AMF
        debug: off
        tags: enter|leave|trace1|trace2|trace3|trace4|trace6
    }
}
After that, run Corosync and look at the status of the rings on the servers and the list of nodes that Corosync combines:
root@storage1:/# corosync-cfgtool -s
Printing ring status.
Local node ID 1254293770
RING ID 0
        id      = 10.1.195.74
        status  = ring 0 active with no faults
RING ID 1
        id      = 192.168.163.74
        status  = ring 1 active with no faults
root@storage1:/# corosync-objctl | grep member
totem.interface.member.memberaddr=10.1.195.74
totem.interface.member.memberaddr=10.1.195.75
totem.interface.member.memberaddr=10.1.195.76
totem.interface.member.memberaddr=192.168.163.74
totem.interface.member.memberaddr=192.168.163.75
totem.interface.member.memberaddr=192.168.163.76
runtime.totem.pg.mrp.srp.members.1254293770.ip=r(0) ip(10.1.195.74) r(1) ip(192.168.163.74)
runtime.totem.pg.mrp.srp.members.1254293770.join_count=1
runtime.totem.pg.mrp.srp.members.1254293770.status=joined
runtime.totem.pg.mrp.srp.members.1271070986.ip=r(0) ip(10.1.195.75) r(1) ip(192.168.163.75)
runtime.totem.pg.mrp.srp.members.1271070986.join_count=2
runtime.totem.pg.mrp.srp.members.1271070986.status=joined
runtime.totem.pg.mrp.srp.members.1287848202.ip=r(0) ip(10.1.195.76) r(1) ip(192.168.163.76)
runtime.totem.pg.mrp.srp.members.1287848202.join_count=1
runtime.totem.pg.mrp.srp.members.1287848202.status=joined
Yeah, it works.
Pacemaker
Now that the backend of the cluster is operational, you can begin to configure.
On each note, launch Pacemaker, and with any of them we look at the cluster status:
root@storage1:/# crm status
============
Last updated: Tue Mar 24 09:39:28 2015
Last change: Mon Mar 23 11:40:13 2015 via crmd on witness
Stack: openais
Current DC: witness - partition with quorum
Version: 1.1.7-ee0730e13d124c3d58f00016c3376a1de5323cff
3 Nodes configured, 3 expected votes
0 Resources configured.
============
Online: [ storage1 storage2 witness ]
All nodes are visible, you can begin to configure.
We start crm configure edit , the default editor (nano) will open and we will bring such heresy there:
Cluster Config
node storage1
node storage2
node witness
# Описываем STONITH (Shoot The Other Node In The Head) ресурсы.
# В данном случае, если нода выпадет из кластера, остальные две посовещаются и убьют её через IPMI послав команду RESET
primitive ipmi_storage1 stonith:external/ipmi \
        params hostname="storage1" ipaddr="10.1.1.74" userid="stonith" passwd="xxx" interface="lanplus" \
        pcmk_host_check="static-list" pcmk_host_list="storage1"
primitive ipmi_storage2 stonith:external/ipmi \
        params hostname="storage2" ipaddr="10.1.1.75" userid="stonith" passwd="xxx" interface="lanplus" \
        pcmk_host_check="static-list" pcmk_host_list="storage2"
# Ресурс для управления состояниями ALUA, параметры выставить согласно своему /etc/scst.conf
primitive p_scst ocf:esos:scst \
        params alua="true" device_group="default" \
        local_tgt_grp="local" \
        remote_tgt_grp="remote" \
        m_alua_state="active" \
        s_alua_state="nonoptimized" \
        op monitor interval="10" role="Master" \
        op monitor interval="20" role="Slave" \
        op start interval="0" timeout="120" \
        op stop interval="0" timeout="60"
# Описываем режимы Master-Slave для вышеуказанного ресурса
ms ms_scst p_scst \
        meta master-max="1" master-node-max="1" clone-max="2" clone-node-max="1" notify="true" interleave="true" \
        target-role="Master"
# Предпочитаем ноду storage1 для Master-режима
location prefer_ms_scst ms_scst inf: #uname eq storage1
# Не запускаем ресурс SCST на ноде witness
location dont_run ms_scst -inf: #uname eq witness
# Запрещаем ресурсам STONITH висеть на тех же нодах, которые они призваны убивать. Cамоубийство - это не наш метод!
location loc_ipmi_on_storage1 ipmi_storage1 -inf: #uname eq storage1
location loc_ipmi_on_storage2 ipmi_storage2 -inf: #uname eq storage2
property $id="cib-bootstrap-options" \
        dc-version="1.1.7-ee0730e13d124c3d58f00016c3376a1de5323cff" \
        cluster-infrastructure="openais" \
        expected-quorum-votes="3" \
        stonith-enabled="true" \
        last-lrm-refresh="1427100013"
Save, apply (commit).
For STONITH in IPMI servers, you need to create a user with Administrator rights, otherwise the resource will refuse to connect to it. In principle, Operator would have been enough, but there was no desire to pick the resource code.
We look at the cluster status:
root@storage1:/# crm status
============
Last updated: Wed Mar 25 15:48:29 2015
Last change: Mon Mar 23 11:40:13 2015 via crmd on witness
Stack: openais
Current DC: witness - partition with quorum
Version: 1.1.7-ee0730e13d124c3d58f00016c3376a1de5323cff
3 Nodes configured, 3 expected votes
4 Resources configured.
============
Online: [ storage1 storage2 witness ]
 Master/Slave Set: ms_scst [p_scst]
     Masters: [ storage1 ]
     Slaves: [ storage2 ]
 ipmi_storage1       (stonith:external/ipmi):        Started witness
 ipmi_storage2       (stonith:external/ipmi):        Started storage1
Well, everything seems to be beautiful. In principle, you can already connect from the initiators.
To be sure, we will check how STONITH works:
Отключаемся от коммутаторов:
root@storage2:/# ip link set bond_hb_ext down
... мы всё еще живы.
Рвём внутреннее кольцо в одом месте
root@storage2:/# ip link set int1 down
... и всё равно кластер ещё держится.
Рвём последнюю ниточку:
root@storage2:/# ip link set ext2 down
... и через пару секунд кластер коллегиальным решением нас грохнул :) Сервер ушёл в ребут.
A small note on working with Master-Slave resources : in Pacemaker there is no command that forces the change of nodes on which the resource currently works with the Master and Slave, in places. You can only use the demote command to transfer the resource to Slave on both nodes.
There are two solutions:
1) Edit the cluster configuration and change the preferred node for the Master mode to another, commit and after a short time the cluster will work on moving the resource itself.
2) In our case, since there is only one working resource, in fact, you can simply put out the Pacemaker on the Master node :) This signals the second node to go into Master mode. After that, reboot the former master node so that ownership of the arrays goes to another node.
In the event of a planned stop, Pacemaker and Corosync STONITH will not work .
Final touches
- Install a Watchdog daemon working on IPMI through / dev / watchdog on all servers in case the server freezes and STONITH cannot kill it for some reason.
/etc/watchdog.conf:watchdog-device = /dev/watchdog admin = root interval = 1 realtime = yes priority = 1 - Set parameters in /etc/sysctl.conf :
This is necessary so that the kernel in any incomprehensible (and OOPS and all sorts of NMI is bad) situation resets the server and allows the second node to fully get down to business. If the kernel is even more or less alive, then this functionality should work faster than Watchdog and STONITH.kernel.panic = 1 kernel.panic_on_io_nmi = 1 kernel.panic_on_oops = 1 kernel.panic_on_unrecovered_nmi = 1 kernel.unknown_nmi_panic = 1 - Configure watchquagga in /etc/quagga/debian.conf to restart if any Quagga daemons crash:
watchquagga_enable=yes watchquagga_options=(--daemon --unresponsive-restart -i 5 -t 5 -T 5 --restart-all '/etc/init.d/quagga restart') - Configure NetConsole to directly collect kernel logs from storage servers on the Witness node in case of any problems.
Add to / etc / fstab:
Plus a small script to configure:none /sys/kernel/config configfs defaults 0 0netconsole.pl#!/usr/bin/perl -w use strict; use warnings; my $dir = '/sys/kernel/config/netconsole'; my %tgts = ( 'tgt1' => { 'dev_name' => 'ext2', 'local_ip' => '192.168.161.74', 'remote_ip' => '192.168.161.76', 'remote_mac' => '00:25:90:77:b8:8b', 'remote_port' => '6666' } ); foreach my $tgt (sort keys %tgts) { my $t = $tgts{$tgt}; my $tgtdir = $dir."/".$tgt; mkdir($tgtdir); foreach my $k (sort keys $t) { system("echo '".$t->{$k}."' > ".$tgtdir."/".$k); } system("echo 1 > ".$tgtdir."/enabled"); }
ESXi
After activating the storage cluster, our LUNs should already appear on the initiators:
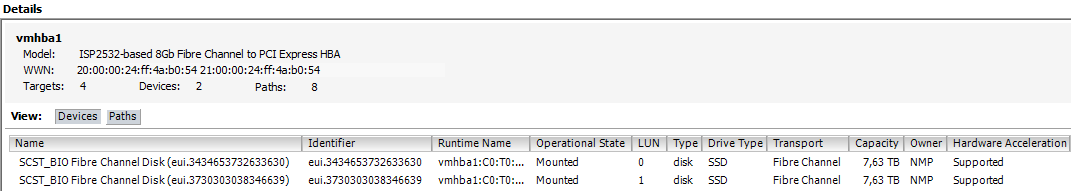
Here we see (one of the FC ports):
- 2 devices, 4 paths to each (2 to the main storage, 2 to the backup)
- Hardware Acceleration = Supported means that storages support VAAI primitives (SCSI-commands ATS, XCOPY, WRITE SAME), which allow offloading part of operations from the host to the storage (blocking, cloning, clogging with zeros)
- SSD: allows the host to use these LUNs for Host Cache and other services that want SSD
To make full use of several paths to storage, we need two things:
- Set Round Robin Mode
- Set it to change paths every 1 IO. By default, it changes the path every 1000 I / O operations, which is not entirely optimal, although it somewhat strains the host CPU. There's a great article from EMC, where a very detailed study the influence of this parameter on the performance: tyts
And if the first item can be made from vSphere Client, then the second will have to be done from the console. To do this, activate SSH on the hosts, log in to each, and enter:
Выставляем режим Round Robin (сразу, чтобы не ковырять GUI):
# for i in `ls /vmfs/devices/disks/ | grep "eui" | grep -v ":"`; do esxcli storage nmp device set --psp=VMW_PSP_RR --device=$i; done
Меняем количество IOPS до смены пути:
# for i in `ls /vmfs/devices/disks/ | grep "eui" | grep -v ":"`; do esxcli storage nmp psp roundrobin deviceconfig set --type=iops --iops=1 --device=$i; done
Проверяем:
# for i in `ls /vmfs/devices/disks/ | grep "eui" | grep -v ":"`; do esxcli storage nmp psp roundrobin deviceconfig get --device=$i | grep IOOperation; done
   IOOperation Limit: 1
   IOOperation Limit: 1
Excellent. Now we look at the results of our manipulations:
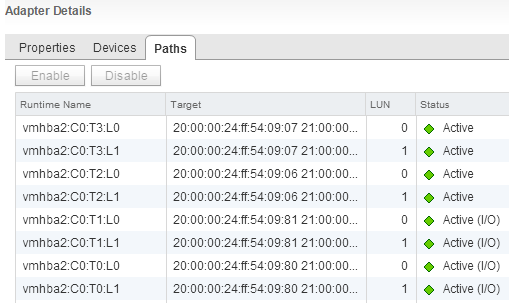
This is a view of the storages through one of the FC adapter ports, through the second everything is exactly the same.
Well, we have 2 active and 2 backup paths to each of the LUNs.
Now we will create VMFS on each LUN, put 1 Debian virtual machine on them (the drives are Thick Provision Eager Zeroed so that ESXi does not cheat with the speed of reading unused blocks) and test the speed of work and the process of switching to the backup storage.
On each VM, install fio and create a read.fio file with test parameters:
[test]
blocksize=512
filename=/dev/sda
size=128G
rw=randread
direct=1
buffered=0
ioengine=libaio
iodepth=64
That is, we will do random reading in blocks of 512 bytes with a queue depth of 64 until we read 128 GB (a VM has such a disk).
We look:
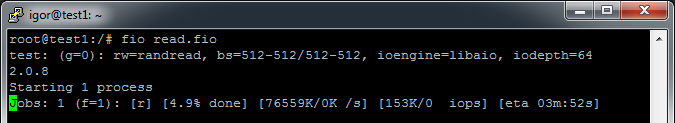
Results of fio when testing with one VM:
fio random
test: (g=0): rw=randread, bs=512-512/512-512, ioengine=libaio, iodepth=64
2.0.8
Starting 1 process
Jobs: 1 (f=1): [r] [100.0% done] [77563K/0K /s] [155K/0  iops] [eta 00m:00s]
test: (groupid=0, jobs=1): err= 0: pid=3100
  read : io=131072MB, bw=75026KB/s, iops=150052 , runt=1788945msec
    slat (usec): min=0 , max=554 , avg= 2.92, stdev= 1.94
    clat (usec): min=127 , max=1354.3K, avg=420.90, stdev=1247.77
     lat (usec): min=130 , max=1354.3K, avg=424.51, stdev=1247.77
    clat percentiles (usec):
     |  1.00th=[  350],  5.00th=[  378], 10.00th=[  386], 20.00th=[  398],
     | 30.00th=[  406], 40.00th=[  414], 50.00th=[  418], 60.00th=[  426],
     | 70.00th=[  430], 80.00th=[  438], 90.00th=[  450], 95.00th=[  462],
     | 99.00th=[  494], 99.50th=[  516], 99.90th=[  636], 99.95th=[  732],
     | 99.99th=[ 3696]
    bw (KB/s)  : min=  606, max=77976, per=100.00%, avg=75175.70, stdev=3104.46
    lat (usec) : 250=0.02%, 500=99.19%, 750=0.75%, 1000=0.03%
    lat (msec) : 2=0.01%, 4=0.01%, 10=0.01%, 20=0.01%, 250=0.01%
    lat (msec) : 500=0.01%, 750=0.01%, 1000=0.01%, 2000=0.01%
  cpu          : usr=62.25%, sys=37.18%, ctx=58816, majf=0, minf=14
  IO depths    : 1=0.1%, 2=0.1%, 4=0.1%, 8=0.1%, 16=0.1%, 32=0.1%, >=64=100.0%
     submit    : 0=0.0%, 4=100.0%, 8=0.0%, 16=0.0%, 32=0.0%, 64=0.0%, >=64=0.0%
     complete  : 0=0.0%, 4=100.0%, 8=0.0%, 16=0.0%, 32=0.0%, 64=0.1%, >=64=0.0%
     issued    : total=r=268435456/w=0/d=0, short=r=0/w=0/d=0
Run status group 0 (all jobs):
   READ: io=131072MB, aggrb=75026KB/s, minb=75026KB/s, maxb=75026KB/s, mint=1788945msec, maxt=1788945msec
Disk stats (read/write):
  sda: ios=268419759/40, merge=0/2, ticks=62791530/0, in_queue=62785360, util=100.00%
fio sequental
test: (g=0): rw=read, bs=1M-1M/1M-1M, ioengine=libaio, iodepth=64
2.0.8
Starting 1 process
Jobs: 1 (f=1): [R] [100.0% done] [1572M/0K /s] [1572 /0  iops] [eta 00m:00s]
test: (groupid=0, jobs=1): err= 0: pid=3280
  read : io=131072MB, bw=1378.6MB/s, iops=1378 , runt= 95078msec
    slat (usec): min=36 , max=2945 , avg=80.13, stdev=16.73
    clat (msec): min=11 , max=1495 , avg=46.33, stdev=29.87
     lat (msec): min=11 , max=1495 , avg=46.42, stdev=29.87
    clat percentiles (msec):
     |  1.00th=[   35],  5.00th=[   38], 10.00th=[   39], 20.00th=[   40],
     | 30.00th=[   42], 40.00th=[   43], 50.00th=[   43], 60.00th=[   44],
     | 70.00th=[   52], 80.00th=[   56], 90.00th=[   57], 95.00th=[   57],
     | 99.00th=[   59], 99.50th=[   62], 99.90th=[   70], 99.95th=[  529],
     | 99.99th=[ 1483]
    bw (MB/s)  : min=   69, max= 1628, per=100.00%, avg=1420.43, stdev=219.51
    lat (msec) : 20=0.04%, 50=68.57%, 100=31.33%, 750=0.02%, 2000=0.05%
  cpu          : usr=0.57%, sys=13.40%, ctx=16171, majf=0, minf=550
  IO depths    : 1=0.1%, 2=0.1%, 4=0.1%, 8=0.1%, 16=0.1%, 32=0.1%, >=64=100.0%
     submit    : 0=0.0%, 4=100.0%, 8=0.0%, 16=0.0%, 32=0.0%, 64=0.0%, >=64=0.0%
     complete  : 0=0.0%, 4=100.0%, 8=0.0%, 16=0.0%, 32=0.0%, 64=0.1%, >=64=0.0%
     issued    : total=r=131072/w=0/d=0, short=r=0/w=0/d=0
Run status group 0 (all jobs):
   READ: io=131072MB, aggrb=1378.6MB/s, minb=1378.6MB/s, maxb=1378.6MB/s, mint=95078msec, maxt=95078msec
Disk stats (read/write):
  sda: ios=261725/14, merge=0/1, ticks=11798940/350, in_queue=11800870, util=99.95%
Highlights:
- > 300k IOPS total. Pretty good considering that the backend was encrypted during testing
- The linear speed floats between 1300-1580 MB / s (which is close to the limit of 2x8Gbit FC), here it is limited by the encryption speed
- Random Latency in 99.9% of requests does not exceed 0.7ms
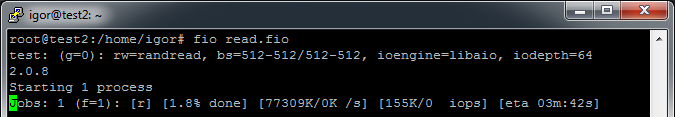
- If the test on one of the VMs is stopped, then the remaining one will have the same 150k IOPS. This seems to be the limit for a dual port FC card on the ESXi. Although this is somewhat strange, you will need to do tuning
- In the test, the load on the storage CPU is about 60%, so there’s still a margin
Or maybe a bang? Be sure to bang
Now we will check how the system will respond to the disconnection of the Master node.
Scheduled : stop at the Pacemaker Master node. Almost instantly, the cluster switches the second node to Master mode:
[285401.041046] scst: Changed ALUA state of default/local into active
[285401.086053] scst: Changed ALUA state of default/remote into nonoptimized
And on the first, it sequentially disables SCST and unloads all the modules associated with it from the kernel:
dmesg
[286491.713124] scst: Changed ALUA state of default/local into nonoptimized
[286491.757573] scst: Changed ALUA state of default/remote into active
[286491.794939] qla2x00t: Unloading QLogic Fibre Channel HBA Driver target mode addon driver
[286491.795022] qla2x00t(0): session for loop_id 132 deleted
[286491.795061] qla2x00t(0): session for loop_id 131 deleted
[286491.795096] qla2x00t(0): session for loop_id 130 deleted
[286491.795172] qla2xxx 0000:02:00.0: Performing ISP abort - ha= ffff880854e28550.
[286492.428672] qla2xxx 0000:02:00.0: LIP reset occured (f7f7).
[286492.488757] qla2xxx 0000:02:00.0: LOOP UP detected (8 Gbps).
[286493.810720] scst: Waiting for 4 active commands to complete... This might take few minutes for disks or few hours for tapes, if you use long executed commands, like REWIND or FORMAT. In case, if you have a hung user space device (i.e. made using scst_user module) not responding to any commands, if might take virtually forever until the corresponding user space program recovers and starts responding or gets killed.
[286493.810924] scst: All active commands completed
[286493.810997] scst: Target 21:00:00:24:ff:54:09:80 for template qla2x00t unregistered successfully
[286493.811072] qla2x00t(1): session for loop_id 0 deleted
[286493.811111] qla2x00t(1): session for loop_id 1 deleted
[286493.811146] qla2x00t(1): session for loop_id 2 deleted
[286493.811182] qla2x00t(1): Unable to send command to SCST, sending BUSY status
[286493.811226] qla2x00t(1): Unable to send command to SCST, sending BUSY status
[286493.811266] qla2x00t(1): Unable to send command to SCST, sending BUSY status
[286493.811305] qla2x00t(1): Unable to send command to SCST, sending BUSY status
[286493.811345] qla2x00t(1): Unable to send command to SCST, sending BUSY status
[286493.811384] qla2x00t(1): Unable to send command to SCST, sending BUSY status
[286493.811424] qla2x00t(1): Unable to send command to SCST, sending BUSY status
[286493.811463] qla2x00t(1): Unable to send command to SCST, sending BUSY status
[286493.811502] qla2x00t(1): Unable to send command to SCST, sending BUSY status
[286493.811541] qla2x00t(1): Unable to send command to SCST, sending BUSY status
[286493.811672] qla2xxx 0000:02:00.1: Performing ISP abort - ha= ffff880854e08550.
[286494.441653] qla2xxx 0000:02:00.1: LIP reset occured (f7f7).
[286494.481727] qla2xxx 0000:02:00.1: LOOP UP detected (8 Gbps).
[286495.833746] scst: Target 21:00:00:24:ff:54:09:81 for template qla2x00t unregistered successfully
[286495.833828] qla2x00t(2): session for loop_id 132 deleted
[286495.833866] qla2x00t(2): session for loop_id 131 deleted
[286495.833902] qla2x00t(2): session for loop_id 130 deleted
[286495.833991] qla2xxx 0000:03:00.0: Performing ISP abort - ha= ffff88084f310550.
[286496.474662] qla2xxx 0000:03:00.0: LIP reset occured (f7f7).
[286496.534750] qla2xxx 0000:03:00.0: LOOP UP detected (8 Gbps).
[286497.856734] scst: Target 21:00:00:24:ff:54:09:32 for template qla2x00t unregistered successfully
[286497.856815] qla2x00t(3): session for loop_id 0 deleted
[286497.856852] qla2x00t(3): session for loop_id 1 deleted
[286497.856888] qla2x00t(3): session for loop_id 130 deleted
[286497.856926] qla2x00t(3): Unable to send command to SCST, sending BUSY status
[286497.856970] qla2x00t(3): Unable to send command to SCST, sending BUSY status
[286497.857009] qla2x00t(3): Unable to send command to SCST, sending BUSY status
[286497.857048] qla2x00t(3): Unable to send command to SCST, sending BUSY status
[286497.857087] qla2x00t(3): Unable to send command to SCST, sending BUSY status
[286497.857127] qla2x00t(3): Unable to send command to SCST, sending BUSY status
[286497.857166] qla2x00t(3): Unable to send command to SCST, sending BUSY status
[286497.857205] qla2x00t(3): Unable to send command to SCST, sending BUSY status
[286497.857244] qla2x00t(3): Unable to send command to SCST, sending BUSY status
[286497.857284] qla2x00t(3): Unable to send command to SCST, sending BUSY status
[286497.857323] qla2x00t(3): Unable to send command to SCST, sending BUSY status
[286497.857362] qla2x00t(3): Unable to send command to SCST, sending BUSY status
[286497.857401] qla2x00t(3): Unable to send command to SCST, sending BUSY status
[286497.857440] qla2x00t(3): Unable to send command to SCST, sending BUSY status
[286497.857480] qla2x00t(3): Unable to send command to SCST, sending BUSY status
[286497.857594] qla2xxx 0000:03:00.1: Performing ISP abort - ha= ffff88084dfc0550.
[286498.487642] qla2xxx 0000:03:00.1: LIP reset occured (f7f7).
[286498.547731] qla2xxx 0000:03:00.1: LOOP UP detected (8 Gbps).
[286499.889733] scst: Target 21:00:00:24:ff:54:09:33 for template qla2x00t unregistered successfully
[286499.889799] scst: Target template qla2x00t unregistered successfully
[286499.890642] dev_vdisk: Detached virtual device SSD-RAID6-1 ("/dev/disk/by-id/scsi-3600605b008b4be401c91ac4abce21c9b")
[286499.890718] scst: Detached from virtual device SSD-RAID6-1 (id 1)
[286499.890756] dev_vdisk: Virtual device SSD-RAID6-1 unregistered
[286499.890798] dev_vdisk: Detached virtual device SSD-RAID6-2 ("/dev/disk/by-id/scsi-3600605b008b4be401c91ac53bd668eda")
[286499.890869] scst: Detached from virtual device SSD-RAID6-2 (id 2)
[286499.890906] dev_vdisk: Virtual device SSD-RAID6-2 unregistered
[286499.890945] scst: Device handler "vdisk_nullio" unloaded
[286499.890981] scst: Device handler "vdisk_blockio" unloaded
[286499.891017] scst: Device handler "vdisk_fileio" unloaded
[286499.891052] scst: Device handler "vcdrom" unloaded
[286499.891754] scst: Task management thread PID 5162 finished
[286499.891801] scst: Management thread PID 5163 finished
[286499.891847] scst: Init thread PID 5161 finished
[286499.899867] scst: Detached from scsi0, channel 0, id 20, lun 0, type 13
[286499.899911] scst: Detached from scsi0, channel 0, id 36, lun 0, type 13
[286499.899951] scst: Detached from scsi0, channel 0, id 37, lun 0, type 13
[286499.899992] scst: Detached from scsi0, channel 0, id 38, lun 0, type 13
[286499.900031] scst: Detached from scsi0, channel 0, id 39, lun 0, type 13
[286499.900071] scst: Detached from scsi0, channel 0, id 40, lun 0, type 13
[286499.900110] scst: Detached from scsi0, channel 0, id 41, lun 0, type 13
[286499.900150] scst: Detached from scsi0, channel 0, id 42, lun 0, type 13
[286499.900189] scst: Detached from scsi0, channel 0, id 59, lun 0, type 13
[286499.900228] scst: Detached from scsi0, channel 0, id 60, lun 0, type 13
[286499.900268] scst: Detached from scsi0, channel 2, id 0, lun 0, type 0
[286499.900307] scst: Detached from scsi0, channel 2, id 1, lun 0, type 0
[286499.900346] scst: Detached from scsi1, channel 0, id 0, lun 0, type 0
[286499.900385] scst: Detached from scsi2, channel 0, id 0, lun 0, type 0
[286499.900595] scst: Exiting SCST sysfs hierarchy...
[286502.914203] scst: User interface thread PID 5153 finished
[286502.914248] scst: Exiting SCST sysfs hierarchy done
[286502.914458] scst: SCST unloaded
On virtual machines, IO freezes for about 10-15 seconds, it looks like ESXi pokes for some time along the old paths and only after a certain timeout switches to new ones. The IOPS on each VM drops from 120k to 22k - this is the price of I / O Shipping.
Next, we turn off or restart the first server - Syncro on the second intercepts the leading role and I / O returns to normal values.
If you run Pacemaker back, the cluster will switch back to this node, because it says so in the config :)
Unscheduled: Here we can, for example, kill the corosync process through kill -9 and the cluster will crash us through STONITH. Or just turn off the power node. The result is one and, in general, does not differ from the planned one, except that there will be no IO Shipping: the second controller will immediately grab the arrays and the speed will not drop to 22k IOPS.
Epilogue
Behind the scenes are still scripts for self-monitoring nodes, there is a big field for activity: checking the vivacity of the controller through all sorts of StorCLIs, checking whether arrays respond to I / O requests (ioping), and the like. In the event of a malfunction, the node should perform hara-kiri.
In such a straightforward way, you can make a fairly reliable and fast storage of improvised materials.
Questions, suggestions and criticism are welcome.
All beaver!