How to deal with OutOfMemoryError in practice, or oh to me these databases
- Tutorial
Greetings, Habr!
In this article I will try to chew on what to do with dumps in Java, how to understand the reason or get closer to the reason for the occurrence of OOM, look at the tools for analyzing dumps, a tool (one, yes) for monitoring hip, and generally delve into this matter for general development . We study such tools as JVisualVM (I will consider some plugins for it and the OQL Console), Eclipse Memory Analyzing Tool.
He wrote a lot, but I hope that everything is only on business :)
First you need to understand how OOM arises. This may not be known to anyone.
Imagine that there is some upper limit of the occupied RAM for the application. Let it be a gigabyte of RAM.
The occurrence of OOM in any of the threads does not mean that this thread "erased" all the free memory, and does not mean at all that the very piece of code that led to OOM is to blame for this.
The situation is quite normal when some thread was engaged in something, eating memory, "got it" to the state "a little more, and I will burst", and completed execution, pausing. At this time, some other thread decided to request some more memory for its small work, the garbage collector puffed up, of course, but did not find the garbage in memory. In this case, OOM just happens, which is not related to the source of the problem, when the stack trace shows the wrong culprit of the application crash.
There is another option. For about a week I have been exploring how to improve the life of a couple of our applications so that they stop behaving unstable. And a week or two I spent on putting them in order. In total, a couple of weeks of time, which lasted for a month and a half, because I was not only dealing with these problems.
From the found: a third-party library, and, of course, some unaccounted for things in stored procedure calls.
In one application, the symptoms were as follows: depending on the load on the service, it could fall in a day, or in two. If you monitor the state of the memory, then it was clear that the application was gradually gaining "size", and at a certain point simply lay down.
With another application a little more interesting. It may behave well for a long time, or it may stop responding 10 minutes after a reboot, or suddenly suddenly fall, gobbling up all the free memory (I can already see this by watching it). And after updating the version, when the Tomcat version was changed from the 7th to the 8th, and JRE, it suddenly one of Fridays (having worked sane before that no less than 2 weeks) began to do such things that it’s a shame to admit it. :)
Dumps turned out to be very useful in both stories, thanks to which they managed to find all the reasons for the crash by making friends with tools such as JVisualVM (I will call it JVVM), Eclipse Memory Analyzing Tool (MAT) and OQL (maybe I don’t know how to correctly cook in MAT, but it turned out to be easier for me to make friends with the OQL implementation in JVVM).
You will also need free RAM in order to download dumps. Its volume should be commensurate with the size of the dump being opened.
So, I’ll start to slowly reveal the cards, and I’ll start with the JVVM.
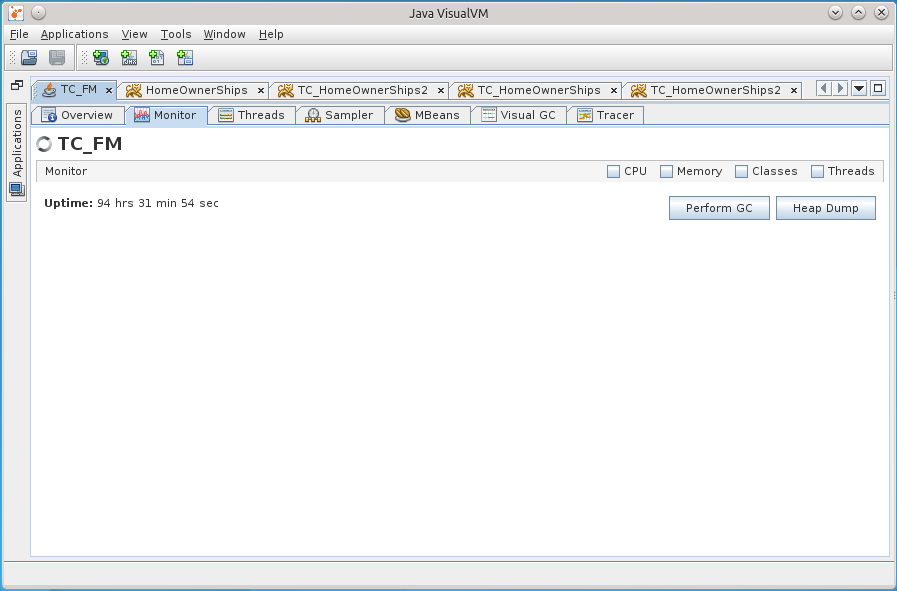
This tool in conjunction with jstatd and jmx allows you to remotely monitor the life of the application on the server: Heap, processor, PermGen, the number of threads and classes, thread activity, allows profiling.
The JVVM is also expandable, and I did not fail to take advantage of this opportunity by installing some plugins that allowed much more things, for example, to monitor and interact with MBeans, observe the details of the heap, conduct long-term monitoring of the application, holding much more in my head period of metrics than provided by the Monitor tab hour.
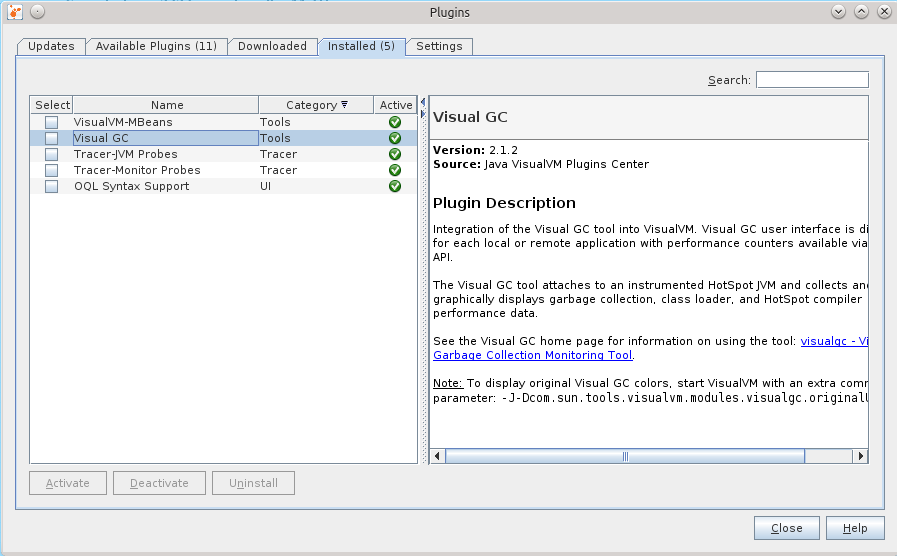
This is what the set of installed plugins looks like.
Visual GC (VGC) allows you to see hip-related metrics.
So, two things happened at once:
1) after the transition to newer libraries / tomkety / java on one of the Fridays, the application that I have been running for a long time suddenly began to behave very badly two weeks after the exposure.
2) they gave me a refactoring project, which also did not behave very well for some time.
I no longer remember the exact order in which these events occurred, but after "Black Friday" I decided to finally deal with memory dumps in more detail so that it would no longer be a black box for me. I warn you that I could already forget some details.
In the first case, the symptoms were as follows: all the flows responsible for processing requests were saved, only 11 connections were open to the database, and they did not say that they were being used, the database said that they were in recv sleep state, that is, they were waiting for them will start to use.
After the reboot, the application came to life, but it could not live long, on the evening of the same Friday it lived the longest, but after the end of the working day it fell again. The picture has always been the same: 11 connections to the database, and only one, it seems, is doing something.
Memory, by the way, was at a minimum. I can’t say that OOM led me to the search for reasons, but the knowledge gained in the search for reasons allowed me to start an active fight against OOM.
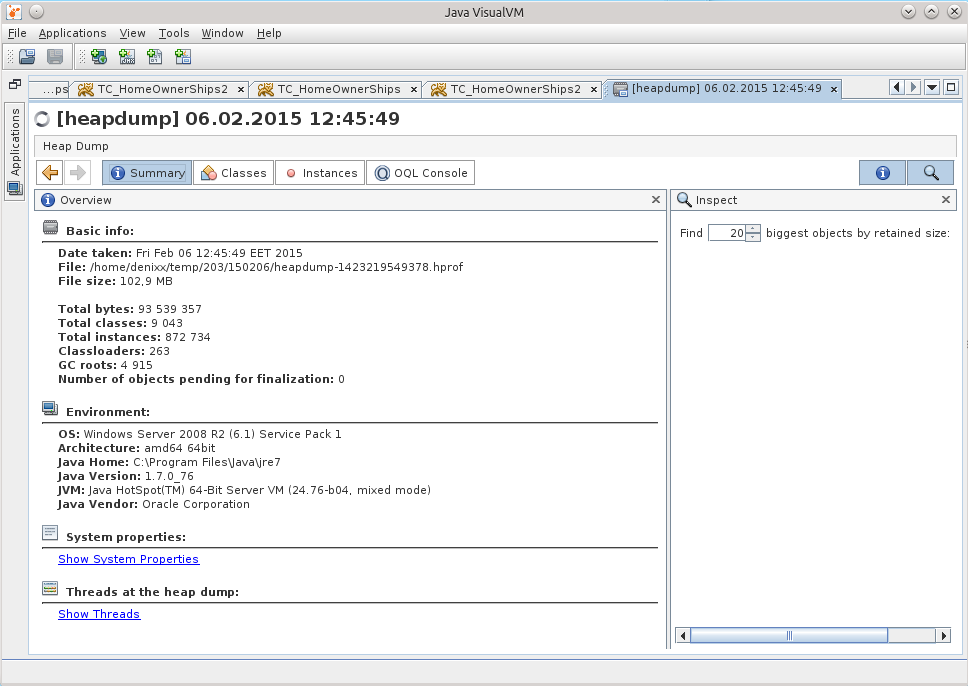
When I opened the dump in JVVM, it was hard to understand anything from it.
The subconscious mind suggested that the reason was somewhere in working with the base.
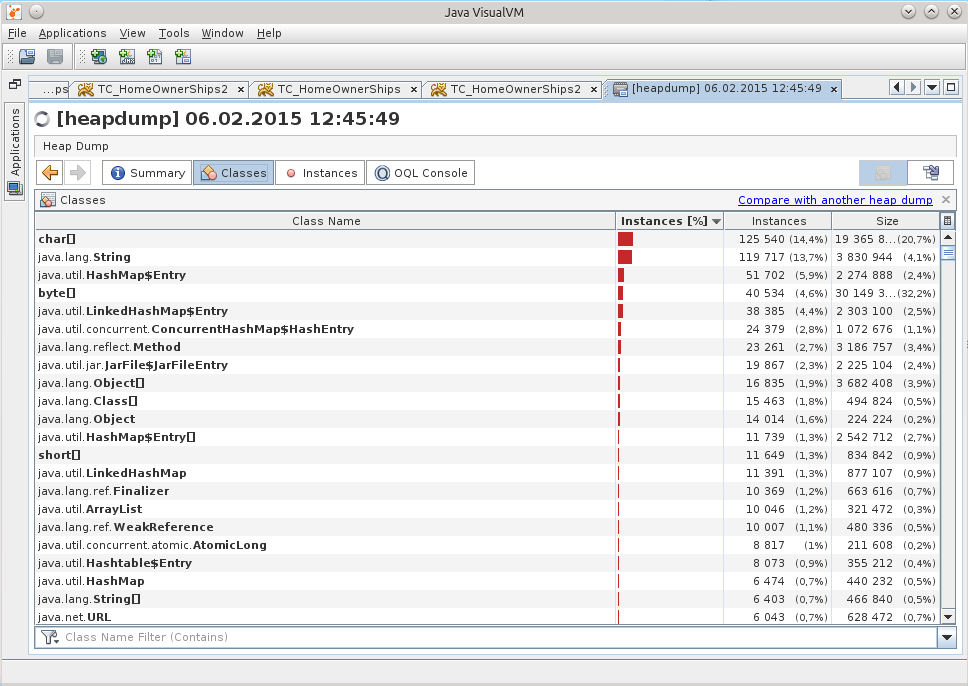
A search among the classes told me that there were already 29 DataSource in my memory, although there should be only 7.
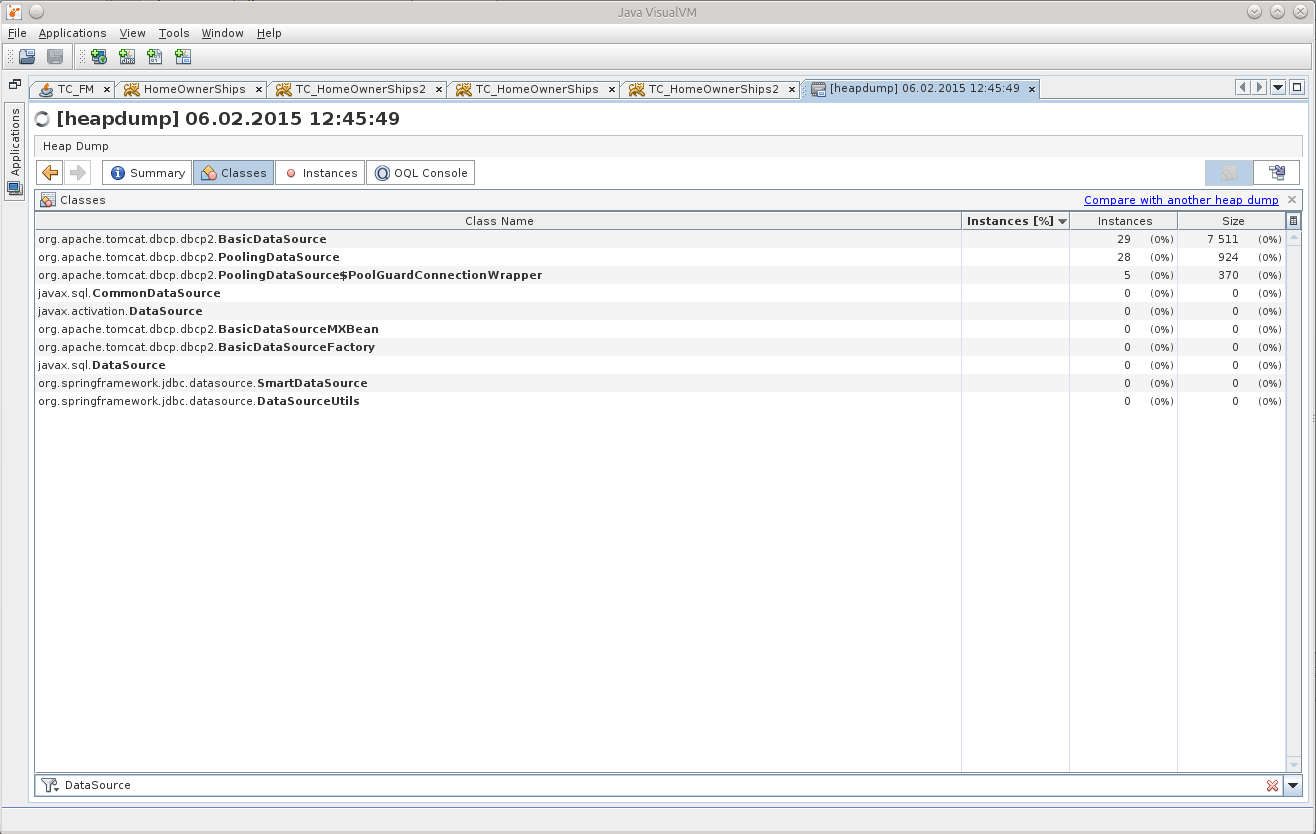
This gave me a point from which I could push off, start to unravel the tangle.
There was no time to sit in the viewer in the viewer, and my attention was finally drawn to the OQL Console tab, I thought that here it is, the moment of truth - I’ll either start using it to its fullest, or I’ll forget about all this.
Before starting, of course, a question was asked of Google, and he kindly provided a cheat sheet for using OQL in JVVM: http://visualvm.java.net/oqlhelp.html
At first, the abundance of compressed information made me discouraged, but after using google fu, the following OQL query appeared:
This is already amended and supplemented, the final version of this request :)
The result can be seen in the screenshot:
After clicking on BasicDataSource # 7 we get to the desired object in the Instances tab:
After a while, it dawned on me that there is one discrepancy with the configuration indicated in the tag Resource on the tomkette, in the /conf/context.xml file. Indeed, the maxTotal parameter has a value of 8 in the dump, while we set maxActive to 20 ...
Then it started to come to me that the application had been living with the wrong connection pool configuration for all these two weeks!
For brevity, I’ll write here that if you use Tomcat and use DBCP as the connection pool, then DBCP version 1.4 is used in the 7th volume and DBCP 2.0 is used in the 8th volume, which, as I later found out, decided to rename some parameters! And about maxTotal in general, it is written on the main page of the site :)
http://commons.apache.org/proper/commons-dbcp/
“Users should also be aware that some configuration options (eg maxActive to maxTotal) have been renamed to align them with the new names used by Commons Pool 2. "
He called them anyway, calmed down, and decided to figure it out.
As it turned out, the BasicDataSourceFactory class simply simply receives this Resource, looks to see if it has the parameters it needs, and picks them up into the generated BasicDataSource object, silently completely ignoring everything that doesn't interest it.
It so happened that they renamed the funniest parameters, maxActive => maxTotal, maxWait => maxWaitMillis, removeAbandoned => removeAbandonedOnBorrow & removeAbandonedOnMaintenance.
By default, maxTotal, as before, is 8; removeAbandonedOnBorrow, removeAbandonedOnMaintenance = false, maxWaitMillis is set to wait forever.
It turned out that the pool turned out to be configured with a minimum number of connections; if free connections end, the application silently waits for them to free; and the silence finishes everything in the logs about the "abandoned" connections - something that could immediately show in which place theprogrammer asshole code grabs the connection, but does not give it back at the end of its work.
This is now the whole mosaic has developed quickly, and this knowledge has been extracted longer.
“It shouldn't be like that,” I decided, and gash the patch ( https://issues.apache.org/jira/browse/DBCP-435 , put it at http://svn.apache.org/viewvc/commons/proper/ dbcp / tags / DBCP_2_1 / src / main / java / org / apache / commons / dbcp2 / BasicDataSourceFactory.java? view = markup), the patch was adopted and entered into DBCP version 2.1. When and if Tomcat 8 upgrades the DBCP version to 2.1+, I think that many secrets will be revealed to administrators about their Resource configuration :)
As for this incident, I just have to tell one more detail - what the hell in the dump was already 29 DataSource's instead of only 7 pieces. The answer lies in the banal arithmetic, 7 * 4 = 28 + 1 = 29.
After that, everything became clear: 11 connections were because in one active DataSource 8 connections were eaten (maxTotal = 8), and another minIdle = 1 in three other unused DataSource copies.
That Friday, we rolled back to Tomcat 7, which was lying next to it, and waited for it to get rid of, it gave us time to calmly figure it out.
Plus later, already on TC7, a connection leak was discovered, all thanks to removeAbandoned + logAbandoned. DBCP happily reported to the catalina.log logfile that
This bad one, the Bad Method, has a connection con in the signature, but inside it was the construction of “con = getConnection ();”, which became a stumbling block. SuperClass is rarely called, so they did not pay attention to it for so long. Plus, the calls did not occur, as I understand it, during the working day, so even if something was hanging, then no one else cared. And in TusamuyuPatnitsa just the stars converged, the head of the customer department needed to see something :)
As for the "event number 2" - they gave me the application for refactoring, and it immediately decided to crash on the servers.
Dumps have already come to me, and I decided to try to pick them too.
He opened a dump in the JVVM, and “cheered up a bit”:
What can be understood from Object [], and even in such quantity?
(An experienced person, of course, already saw the reason, right? :))
So I had the thought “well, really, no one has done this before, because there probably already is a ready-made tool!”. So I came across this question on StackOverflow: http://stackoverflow.com/questions/2064427/recommendations-for-a-heap-analysis-tool-for-java .
After looking at the proposed options, I decided to stop at MAT, I had to try at least something, but this is an open project, and even with a lot more votes than the rest of the items.
So, MAT.
I recommend downloading the latest version of Eclipse, and installing MAT there, because the stand-alone version of MAT behaves badly, there is some kind of devilishness with dialogs, the contents in the fields are not visible in them. Maybe someone will tell you in the comments what he is missing, but I solved the problem by installing MAT in Eclipse.
Having opened the dump in MAT, I requested the execution of the Leak Suspects Report.


Surprise knew no bounds, to be honest.
1.2 gigabytes weigh connections to the base.
Each connection weighs from 17 to 81 megabytes.
Well, the pool itself is also “a little”.
The Dominator Tree report helped visualize the problem:
Kilometers of SQLWarning turned out to be the cause of all the falls, the database persistently tried to make it clear that “010SK: Database cannot set connection option SET_READONLY_TRUE.”, And the BoneCP connection pool does not clear SQLWarning after the connections are released and returned to the pool (maybe this is somewhere then you can configure? Tell me, if anyone knows).
Google said that such a problem with Sybase ASE has been known since 2004: https://forum.hibernate.org/viewtopic.php?f=1&t=932731
In short, "Sybase ASE doesn't require any optimizations, therefore setReadOnly () produces a SQLWarning. ”, and these solutions still work.
However, this is not quite a solution to the problem, because the solution to the problem is when, when the connection is returned to the pool, all the database notifications are cleared due to the fact that no one will ever need them.
And DBCP can do this: http://svn.apache.org/viewvc/commons/proper/dbcp/tags/DBCP_1_4/src/java/org/apache/commons/dbcp/PoolableConnectionFactory.java?view=markup , method passivateObject (Object obj), on line 687 you can see conn.clearWarnings ();, this call saves SQLWarning from kilometers in memory.
I learned about this from the ticket: https://issues.apache.org/jira/browse/DBCP-102
I was also told about this ticket in the bugtracker: https://issues.apache.org/jira/browse/DBCP- 234 , but it already applies to DBCP 2.0.
As a result, I switched the application to DBCP (albeit version 1.4). Although the load on the service is rather big (from 800 to 2k requests per minute), but still the application behaves well, and this is the main thing. And he did it right, because BoneCP has not been supported for five months, however, HikariCP has replaced him. You will need to see how things are in its source ...
Impressed by how MAT laid out everything on the shelves, I decided not to throw this powerful tool, and later it came in handy for me, because in the first application there were all sorts of “unaccounted for” things — unaccounted for things in the application code or stored procedure code that sometimes lead to the fact that the application glues fins. I still catch them.
Armed with both tools, I began to pick each sent dump in search of the reasons for the fall on OOM.
As a rule, all OOMs led me to TaskThread.
And if you click on the inscription See stacktrace, then yes, it will be just a trivial case, when some thread suddenly fell while trying to marshal the result of its work.
However, nothing here indicates the cause of OOM; here it is only the result. So far, because of the lack of knowledge of all the magic of OQL in MAT, it is JVVM that helps me find the reason.
We load the dump there, and try to find the reason!
Of course, I should look for exactly the things related to the database, and therefore let us first try to see if there are Statements in memory.
Two SybCallableStatement, and one SybPreparedStatement.
I think that the matter will become more complicated if Statement'ov will be much larger, but having a little bit of lining up one of the following queries, indicating in the where the necessary conditions, I think everything will work out for you. Plus, of course, it's worth a good look in the MAT, what kind of results it is trying to marshal the stream, which object, and it will become clearer which of the Statement's to look for.
Not that these are “internal” challenges.
And here is the game!
For the purity of the experiment, you can throw the same query in your favorite DB-IDE, and it will work out for a very long time, and if you delve into the bowels of the storage, it will be clear that there simply from the database that does not belong to us, 2 million rows are selected by such a query with such parameters. These two million even get into the application’s memory, but an attempt to marshal the result becomes fatal for the application. This is Harakiri. :)
At the same time, GC carefully removes all the evidence, but this did not save him, yet the source remained in his memory, and he will be punished.
For some reason, after all this story, I felt like I was still a failure.
So my story ended, I hope you enjoyed it :)
I would like to express my gratitude to my boss, he gave me time to figure it out. I think this new knowledge is very useful.
Thanks to the girls from Scorini for the invariably delicious coffee, but they will not read these words of gratitude - I even doubt that they know about the existence of Habrahabr :)
I would like to see even more useful information and additions in the comments, I will be very grateful.
I think it's time to read the documentation for MAT ...
UPD1 : Yes, I completely forgot to talk about such useful things as creating memory dumps.
docs.oracle.com/javase/7/docs/webnotes/tsg/TSG-VM/html/clopts.html#gbzrr
Options
-XX: + HeapDumpOnOutOfMemoryError
-XX: HeapDumpPath = / disk2 / dumps are
very useful for generating dumps when the application crashes with OutOfMemoryError,
and it is also possible to remove the memory dump from the application "in cash" in the middle of its operation.
There is a jmap utility for this.
An example of a call for Windows:
"C: \ install \ PSTools \ PsExec.exe" -s "C: \ Program Files \ Java \ jdk1.7.0_55 \ bin \ jmap.exe" -dump: live, format = b, file = C: \ dump.hprof 3440
the last parameter is the PID of the java process. The PsExec application from the PSTools suite allows you to run other applications with system rights, using the "-s" switch for this. The live option is useful to call GC before saving the dump, clearing the memory of garbage. In the case when OOM occurs, there is no need to clear the memory, there is no more garbage left there, so do not look for how you can set the live option in case of OOM.
UPD2 (2015-10-28) | Case numbertwo three
(It was decided to add this here as an update, rather than sawing a new article about the same one):
Another interesting case, but with an Oracle database.
One of the projects uses a feature with XML, searches the contents of a saved XML document. In general, this project sometimes made itself felt by the fact that suddenly suddenly one of the instances stopped showing signs of life.
Sensing a “good” chance to practiceon cats , I decided to look at his memory dumps.
The first thing I saw was "you have a lot of connections left in your memory." 21k !!! And some interesting oracle.xdb.XMLType also gave heat. “But this is Oracle!”, Spun in my head. Looking ahead, I’ll say that yes, he’s to blame.
So, we see a bunch of T4CConnection that lie in the HashMap $ Entry. I noticed immediately that it seems to be SoftHashMap, which, like, should mean that it should not grow to such a size. But you see the result yourself - 50-60 kilobytes per connection, and there are really LOTS of them.
After seeing what HashMap $ Entry is, I saw that the picture is about the same, everything is connected with SoftHashMap, with Oracle connections.
Which, in fact, was confirmed by such a picture. HashMap $ Entry was just a sea, and they more or less cumulated inside oracle.xdb.SoftHashMap.
In the next dump, the picture was about the same. According to the Dominator Tree, it was clear that inside each Entry there is a heavy such BinXmlProcessorImpl.
- = - = -
If you take into account that at that moment I was not strong in what xdb is and how it is related to XML, then, somewhat confused, I decided that we should google, maybe someone already knows that with everything this needs to be done. And I didn’t deceive you, at the request “oracle.xdb.SoftHashMap T4CConnection” there were
times piotr.bzdyl.net/2014/07/memory-leak-in-oracle-softhashmap.html
and two leakfromjavaheap.blogspot.com/2014/02/ memory-leak-detection-in-real-life.html
Having affirmed that there is still a jamb at Oracle, the matter remained small.
I asked the DBA to see information on the detected problem:
Here is the fix description: updates.oracle.com/Orion/Services/download?type=readme&aru=18629243 (access requires an account in Oracle).
- = - = -
After applying the fix, the instances of our application have been living for a month, and so far without excesses. * tapped wood * * spat on his left shoulder *
Good luck on your quest!
Some lyrics
Today, 2015-03-21, I decided to do half the battle, and still start writing an article on how to still begin to understand what to do with OOM, and generally learn to pick heap-dumps ( I’ll call them just dumps, for simplicity of speech, I’ll also try to avoid Anglicisms where possible).
The volume of “work” that I had planned to write this article seems to me not one-day, and therefore the article should appear onlya couple of weeks later the day.
The volume of “work” that I had planned to write this article seems to me not one-day, and therefore the article should appear only
In this article I will try to chew on what to do with dumps in Java, how to understand the reason or get closer to the reason for the occurrence of OOM, look at the tools for analyzing dumps, a tool (one, yes) for monitoring hip, and generally delve into this matter for general development . We study such tools as JVisualVM (I will consider some plugins for it and the OQL Console), Eclipse Memory Analyzing Tool.
He wrote a lot, but I hope that everything is only on business :)
Background
First you need to understand how OOM arises. This may not be known to anyone.
Imagine that there is some upper limit of the occupied RAM for the application. Let it be a gigabyte of RAM.
The occurrence of OOM in any of the threads does not mean that this thread "erased" all the free memory, and does not mean at all that the very piece of code that led to OOM is to blame for this.
The situation is quite normal when some thread was engaged in something, eating memory, "got it" to the state "a little more, and I will burst", and completed execution, pausing. At this time, some other thread decided to request some more memory for its small work, the garbage collector puffed up, of course, but did not find the garbage in memory. In this case, OOM just happens, which is not related to the source of the problem, when the stack trace shows the wrong culprit of the application crash.
There is another option. For about a week I have been exploring how to improve the life of a couple of our applications so that they stop behaving unstable. And a week or two I spent on putting them in order. In total, a couple of weeks of time, which lasted for a month and a half, because I was not only dealing with these problems.
From the found: a third-party library, and, of course, some unaccounted for things in stored procedure calls.
In one application, the symptoms were as follows: depending on the load on the service, it could fall in a day, or in two. If you monitor the state of the memory, then it was clear that the application was gradually gaining "size", and at a certain point simply lay down.
With another application a little more interesting. It may behave well for a long time, or it may stop responding 10 minutes after a reboot, or suddenly suddenly fall, gobbling up all the free memory (I can already see this by watching it). And after updating the version, when the Tomcat version was changed from the 7th to the 8th, and JRE, it suddenly one of Fridays (having worked sane before that no less than 2 weeks) began to do such things that it’s a shame to admit it. :)
Dumps turned out to be very useful in both stories, thanks to which they managed to find all the reasons for the crash by making friends with tools such as JVisualVM (I will call it JVVM), Eclipse Memory Analyzing Tool (MAT) and OQL (maybe I don’t know how to correctly cook in MAT, but it turned out to be easier for me to make friends with the OQL implementation in JVVM).
You will also need free RAM in order to download dumps. Its volume should be commensurate with the size of the dump being opened.
Start
So, I’ll start to slowly reveal the cards, and I’ll start with the JVVM.
This tool in conjunction with jstatd and jmx allows you to remotely monitor the life of the application on the server: Heap, processor, PermGen, the number of threads and classes, thread activity, allows profiling.
The JVVM is also expandable, and I did not fail to take advantage of this opportunity by installing some plugins that allowed much more things, for example, to monitor and interact with MBeans, observe the details of the heap, conduct long-term monitoring of the application, holding much more in my head period of metrics than provided by the Monitor tab hour.
This is what the set of installed plugins looks like.
Visual GC (VGC) allows you to see hip-related metrics.
More about what hip consists of in our Java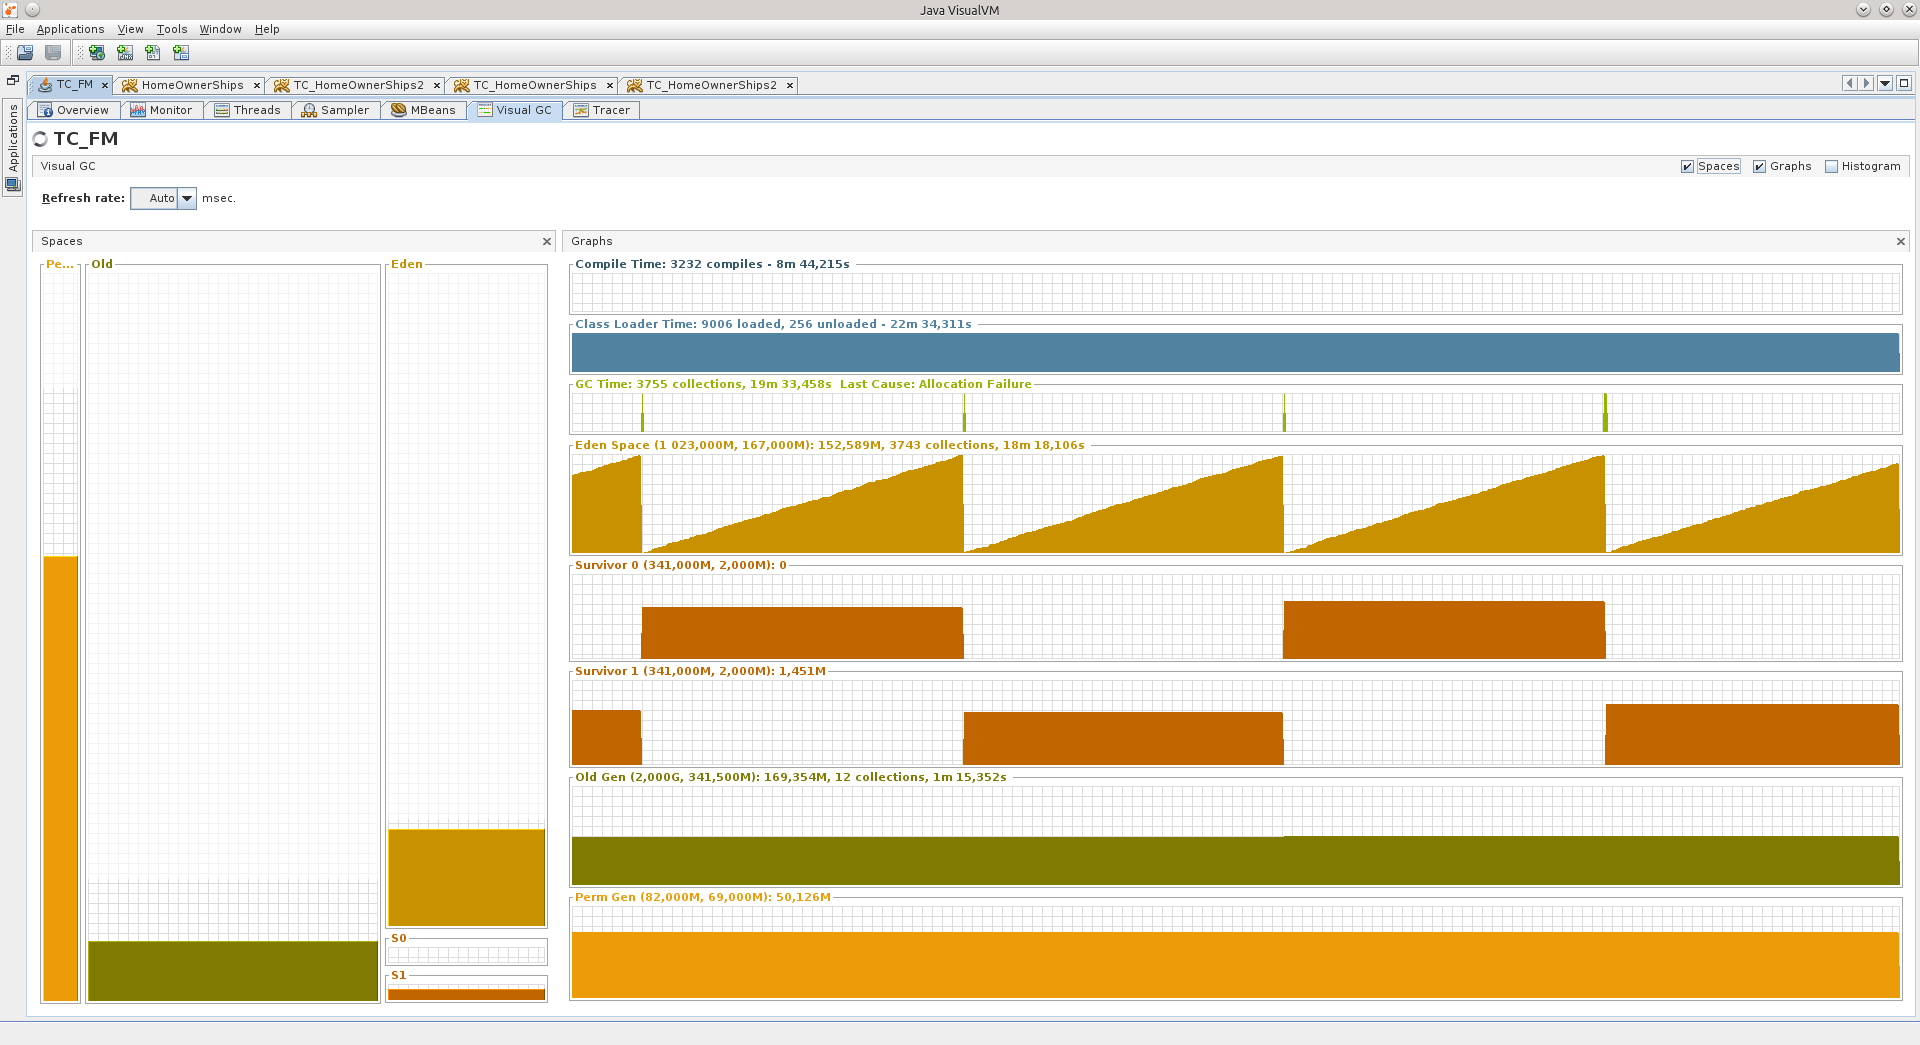
Here are two screenshots of the VGC tab that show how two different applications behave.
On the left you can see hip sections like Perm Gen, Old Gen, Survivor 0, Survivor 1, and Eden Space.
All these components are areas in the RAM into which the objects are stacked.
PermGen - Permanent Generation is a memory area in the JVM designed to store Java class descriptions and some additional data.
Old Gen is a memory area for fairly old objects that survived several shifts from place to place in Survivor areas, and at the time of another transfusion, they fall into the area of "old" objects.
Survivor 0 and 1 are areas where objects enter that after creating the object in Eden Space survived its cleaning, that is, did not become garbage at the time Eden Space began to be cleaned by Garbage Collector (GC). Each time you start cleaning Eden Space, objects from the currently active Survivor are transferred to passive, plus new ones are added, and after that Survivors change their status, passive becomes active, and active becomes passive.
Eden Space is a memory area in which new objects are spawned. When there is not enough memory in this area, the GC cycle starts.
Each of these areas can be adjusted in size during the application by the virtual machine itself.
If you specify -Xmx to 2 gigabytes, for example, then this does not mean that all 2 gigabytes will be immediately occupied (unless you start immediately something that actively eats memory, of course). The virtual machine will first try to keep itself in check.
The third screenshot shows the inactive stage of the application, which is not used at the weekend - Eden grows evenly, Survivors are shifted at regular intervals, Old practically does not grow. The application worked for more than 90 hours, and in principle, the JVM believes that the application does not need so much, about 540 MB.
There are peak situations when a virtual machine even allocates a lot more memory for hip, but I think that these are some other “unaccounted for” ones, which I will discuss in more detail below, or maybe just a virtual machine allocated more memory for Eden, for example so that the objects in it have time to become garbage before the next cleaning cycle.
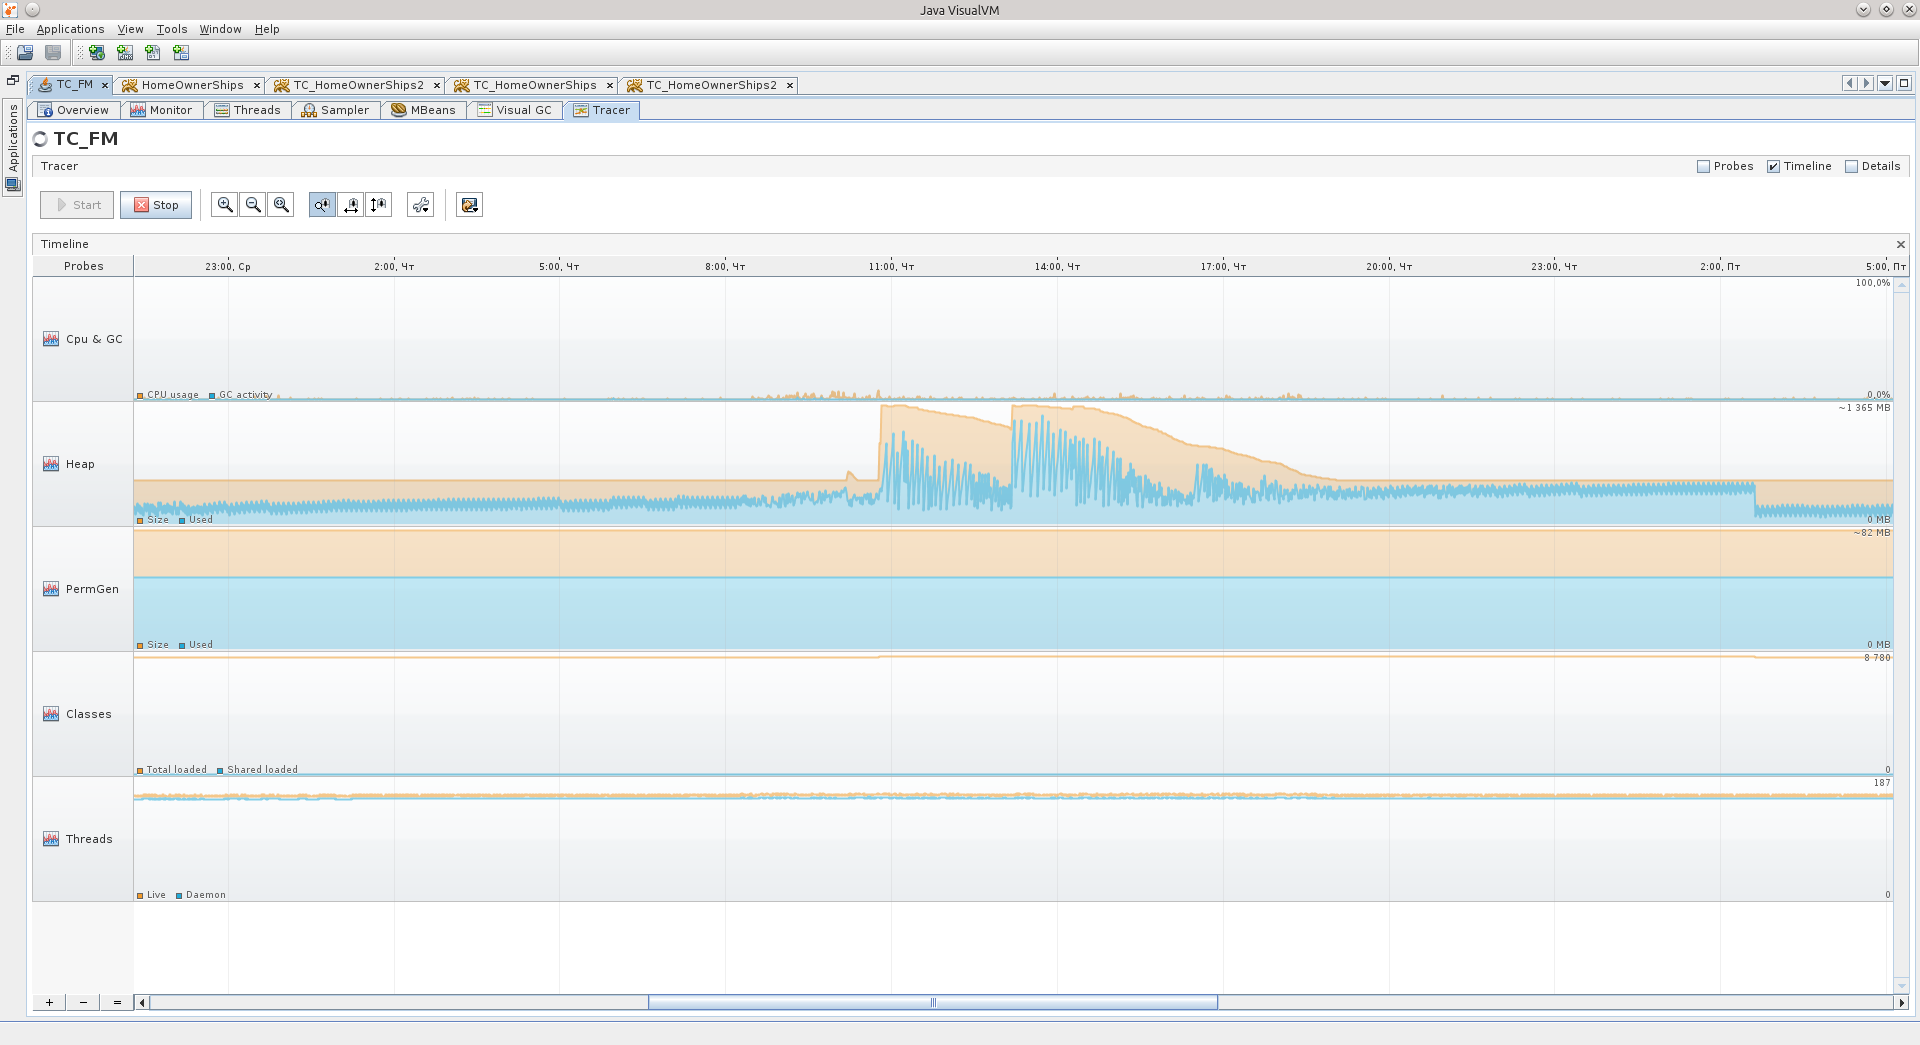
The areas that I marked in red in the next screenshot are just an increase in Old, when some objects do not have time to become garbage in order to be deleted from memory earlier, and still fall into Old. The blue area is an exception. You can see the comb over the red sections - this is Eden's behavior.
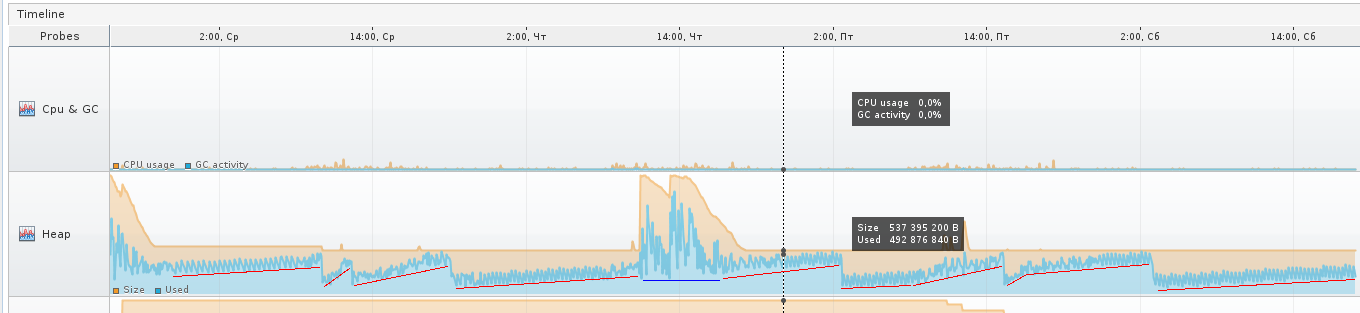
Over the course of the blue section, the virtual machine most likely decided that it was necessary to increase the size of the Eden area, because when you zoom in on Tracer, you can see that the GC has ceased to “part” and there are no such small vibrations as before, the oscillations have become slow and rare.
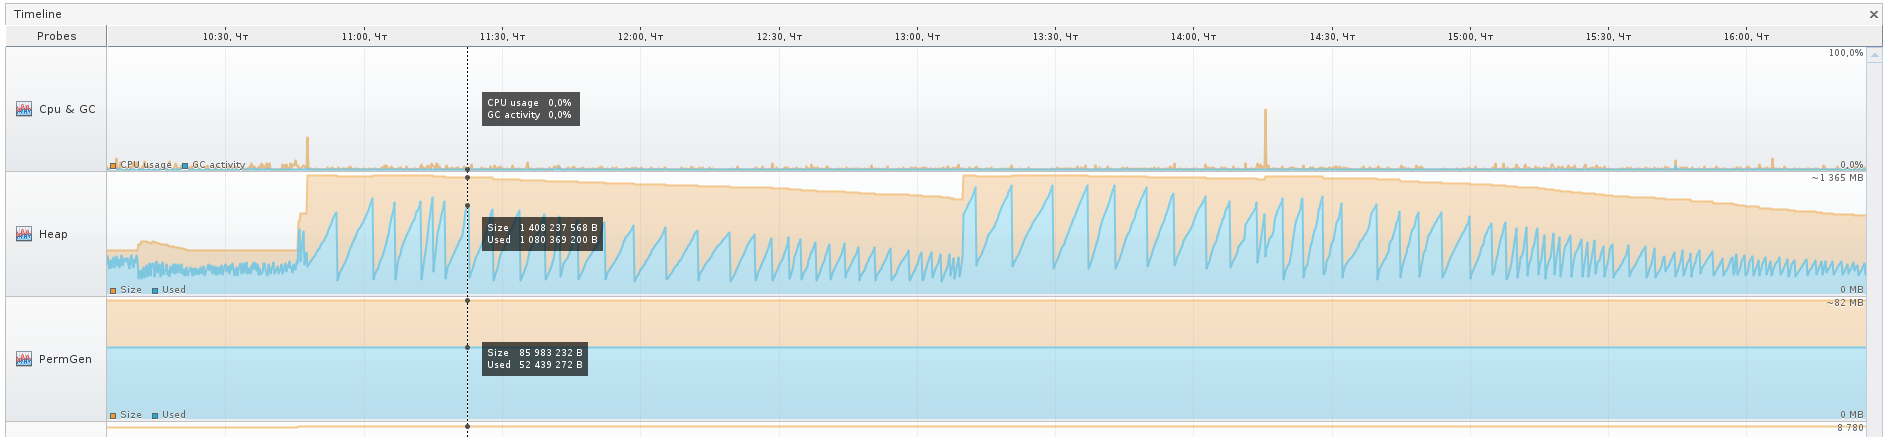
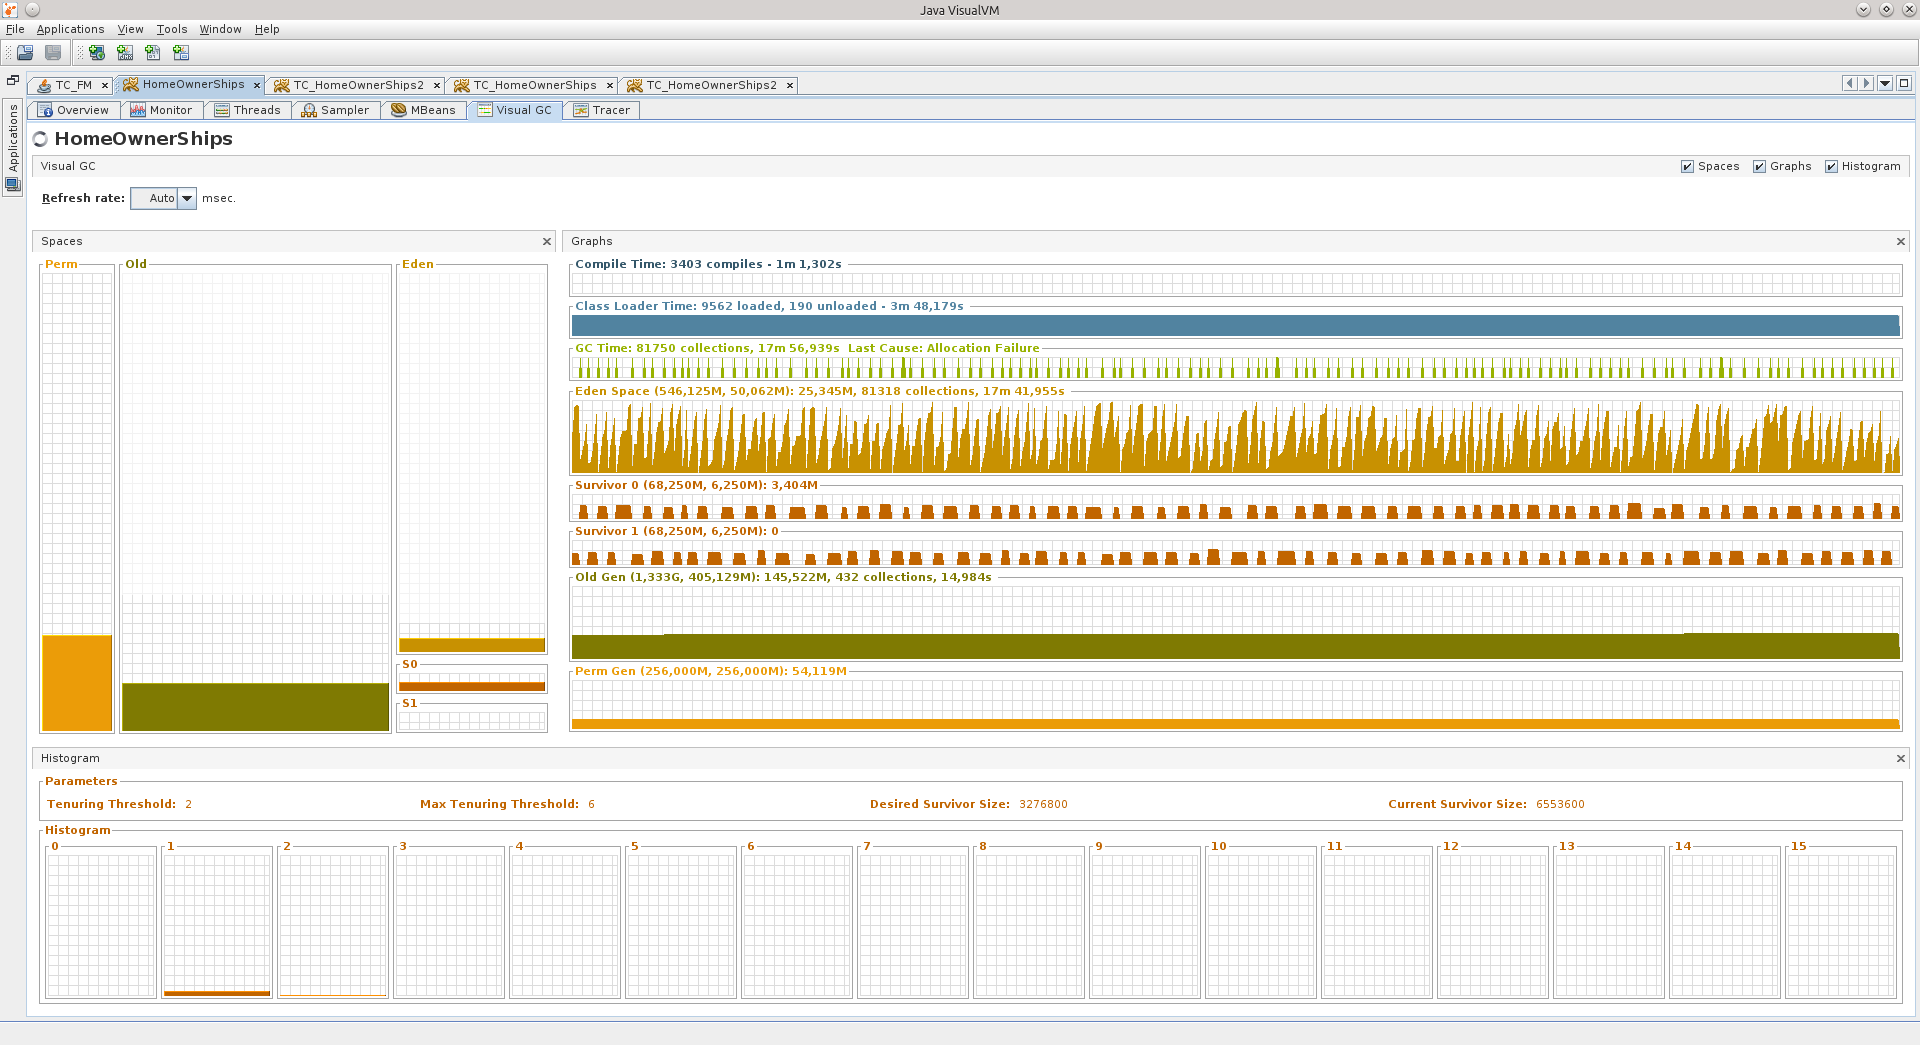
Let's move on to the second application:
In it, Eden reminds me of some level from Mortal Kombat, an arena with spikes. It was like that, it seems ... And the GC Schedule is the spikes from the NFS Hot Pursuit, but these are still flat.
The numbers to the right of the area names indicate:
1) that Eden has a size of 50 megabytes, and what is drawn at the end of the graph, the last of the values at the moment is 25 megabytes. In total, it can grow up to 546 megabytes.
2) that Old can grow up to 1.333 gigabytes, now it occupies 405 MB, and is crammed at 145.5 MB.
Also for Survivor areas and Perm Gen.
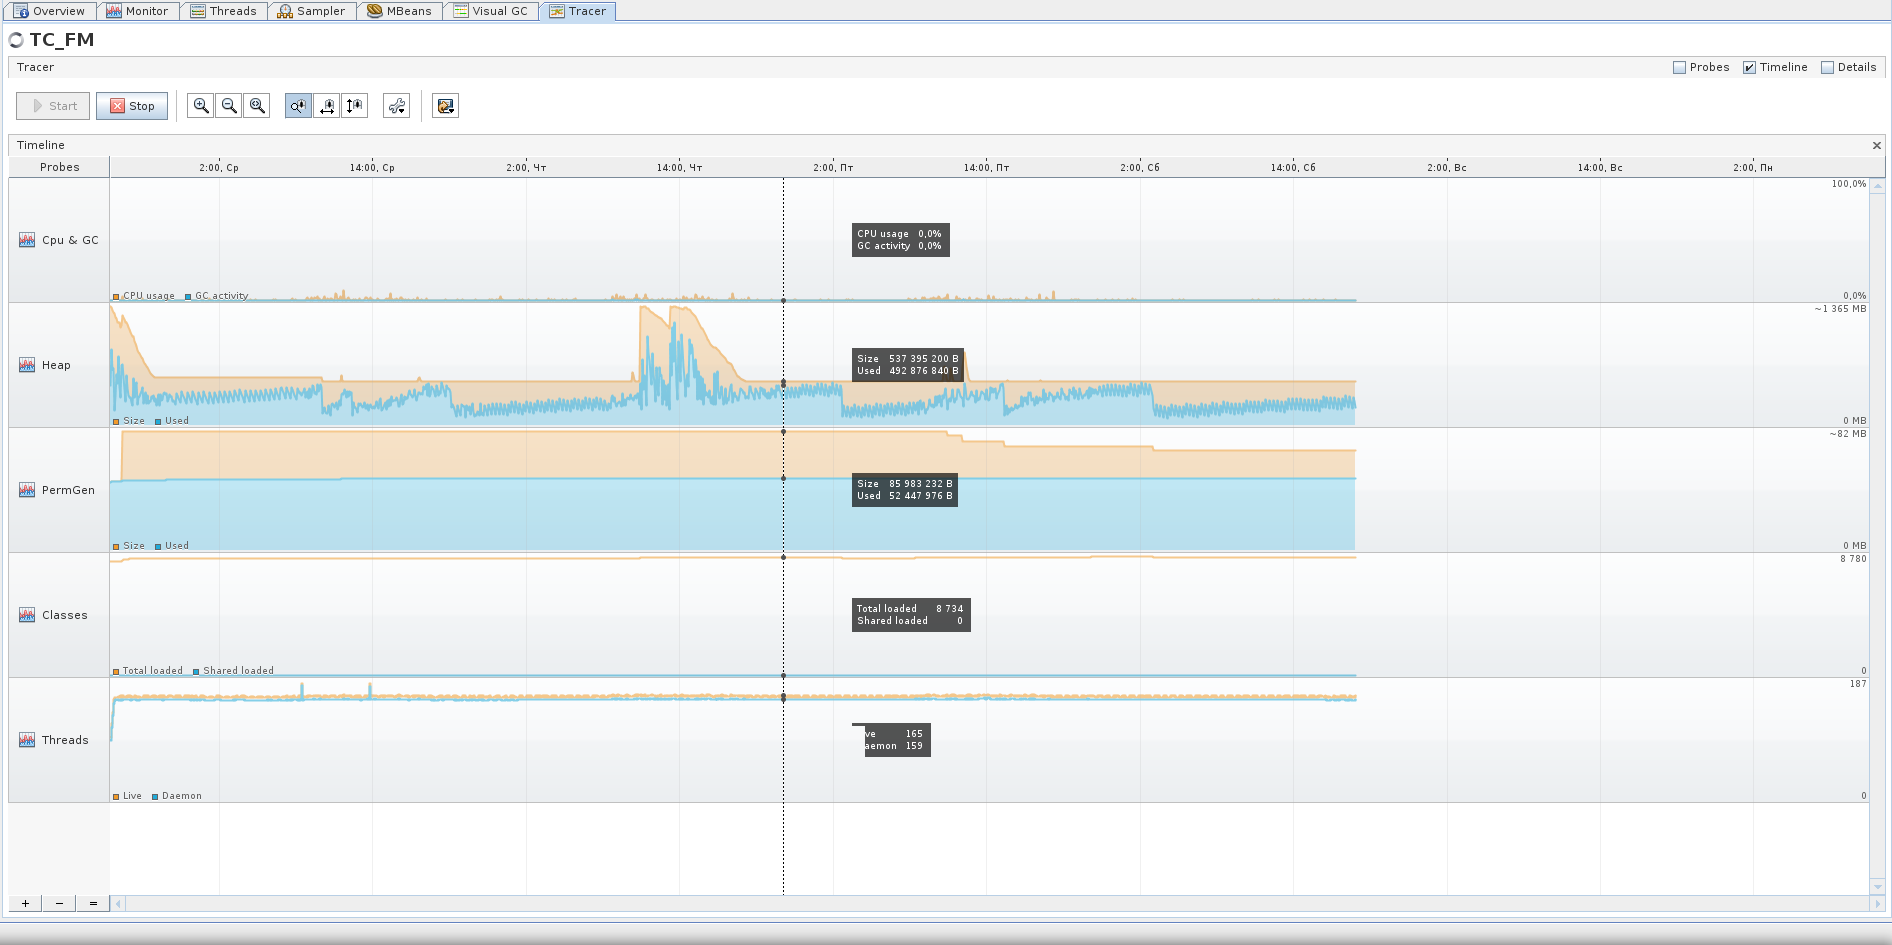
For comparison - here's a Tracer chart for 75 hours of the second application, I think you can draw some conclusions from it. For example, that the active phase of this application is from 8:30 to 17:30 on weekdays, and that it also works on weekends :)

If you suddenly see in your application that the Old area is full, just try to wait until it will overflow, most likely it is already filled with garbage.
Garbage is objects that are not actively referenced from other objects, or entire complexes of such objects (for example, some kind of “cloud” of interconnected objects can become garbage if a set of links points only to objects inside this “cloud”, and not to one object in this "cloud" does not refer to "outside").
It was a brief retelling of what I learned about the structure of hip during the time I googled.
Here are two screenshots of the VGC tab that show how two different applications behave.
On the left you can see hip sections like Perm Gen, Old Gen, Survivor 0, Survivor 1, and Eden Space.
All these components are areas in the RAM into which the objects are stacked.
PermGen - Permanent Generation is a memory area in the JVM designed to store Java class descriptions and some additional data.
Old Gen is a memory area for fairly old objects that survived several shifts from place to place in Survivor areas, and at the time of another transfusion, they fall into the area of "old" objects.
Survivor 0 and 1 are areas where objects enter that after creating the object in Eden Space survived its cleaning, that is, did not become garbage at the time Eden Space began to be cleaned by Garbage Collector (GC). Each time you start cleaning Eden Space, objects from the currently active Survivor are transferred to passive, plus new ones are added, and after that Survivors change their status, passive becomes active, and active becomes passive.
Eden Space is a memory area in which new objects are spawned. When there is not enough memory in this area, the GC cycle starts.
Each of these areas can be adjusted in size during the application by the virtual machine itself.
If you specify -Xmx to 2 gigabytes, for example, then this does not mean that all 2 gigabytes will be immediately occupied (unless you start immediately something that actively eats memory, of course). The virtual machine will first try to keep itself in check.
The third screenshot shows the inactive stage of the application, which is not used at the weekend - Eden grows evenly, Survivors are shifted at regular intervals, Old practically does not grow. The application worked for more than 90 hours, and in principle, the JVM believes that the application does not need so much, about 540 MB.
There are peak situations when a virtual machine even allocates a lot more memory for hip, but I think that these are some other “unaccounted for” ones, which I will discuss in more detail below, or maybe just a virtual machine allocated more memory for Eden, for example so that the objects in it have time to become garbage before the next cleaning cycle.
The areas that I marked in red in the next screenshot are just an increase in Old, when some objects do not have time to become garbage in order to be deleted from memory earlier, and still fall into Old. The blue area is an exception. You can see the comb over the red sections - this is Eden's behavior.
Over the course of the blue section, the virtual machine most likely decided that it was necessary to increase the size of the Eden area, because when you zoom in on Tracer, you can see that the GC has ceased to “part” and there are no such small vibrations as before, the oscillations have become slow and rare.
Let's move on to the second application:
In it, Eden reminds me of some level from Mortal Kombat, an arena with spikes. It was like that, it seems ... And the GC Schedule is the spikes from the NFS Hot Pursuit, but these are still flat.
The numbers to the right of the area names indicate:
1) that Eden has a size of 50 megabytes, and what is drawn at the end of the graph, the last of the values at the moment is 25 megabytes. In total, it can grow up to 546 megabytes.
2) that Old can grow up to 1.333 gigabytes, now it occupies 405 MB, and is crammed at 145.5 MB.
Also for Survivor areas and Perm Gen.
For comparison - here's a Tracer chart for 75 hours of the second application, I think you can draw some conclusions from it. For example, that the active phase of this application is from 8:30 to 17:30 on weekdays, and that it also works on weekends :)
If you suddenly see in your application that the Old area is full, just try to wait until it will overflow, most likely it is already filled with garbage.
Garbage is objects that are not actively referenced from other objects, or entire complexes of such objects (for example, some kind of “cloud” of interconnected objects can become garbage if a set of links points only to objects inside this “cloud”, and not to one object in this "cloud" does not refer to "outside").
It was a brief retelling of what I learned about the structure of hip during the time I googled.
Background
So, two things happened at once:
1) after the transition to newer libraries / tomkety / java on one of the Fridays, the application that I have been running for a long time suddenly began to behave very badly two weeks after the exposure.
2) they gave me a refactoring project, which also did not behave very well for some time.
I no longer remember the exact order in which these events occurred, but after "Black Friday" I decided to finally deal with memory dumps in more detail so that it would no longer be a black box for me. I warn you that I could already forget some details.
In the first case, the symptoms were as follows: all the flows responsible for processing requests were saved, only 11 connections were open to the database, and they did not say that they were being used, the database said that they were in recv sleep state, that is, they were waiting for them will start to use.
After the reboot, the application came to life, but it could not live long, on the evening of the same Friday it lived the longest, but after the end of the working day it fell again. The picture has always been the same: 11 connections to the database, and only one, it seems, is doing something.
Memory, by the way, was at a minimum. I can’t say that OOM led me to the search for reasons, but the knowledge gained in the search for reasons allowed me to start an active fight against OOM.
When I opened the dump in JVVM, it was hard to understand anything from it.
The subconscious mind suggested that the reason was somewhere in working with the base.
A search among the classes told me that there were already 29 DataSource in my memory, although there should be only 7.
This gave me a point from which I could push off, start to unravel the tangle.
Oql
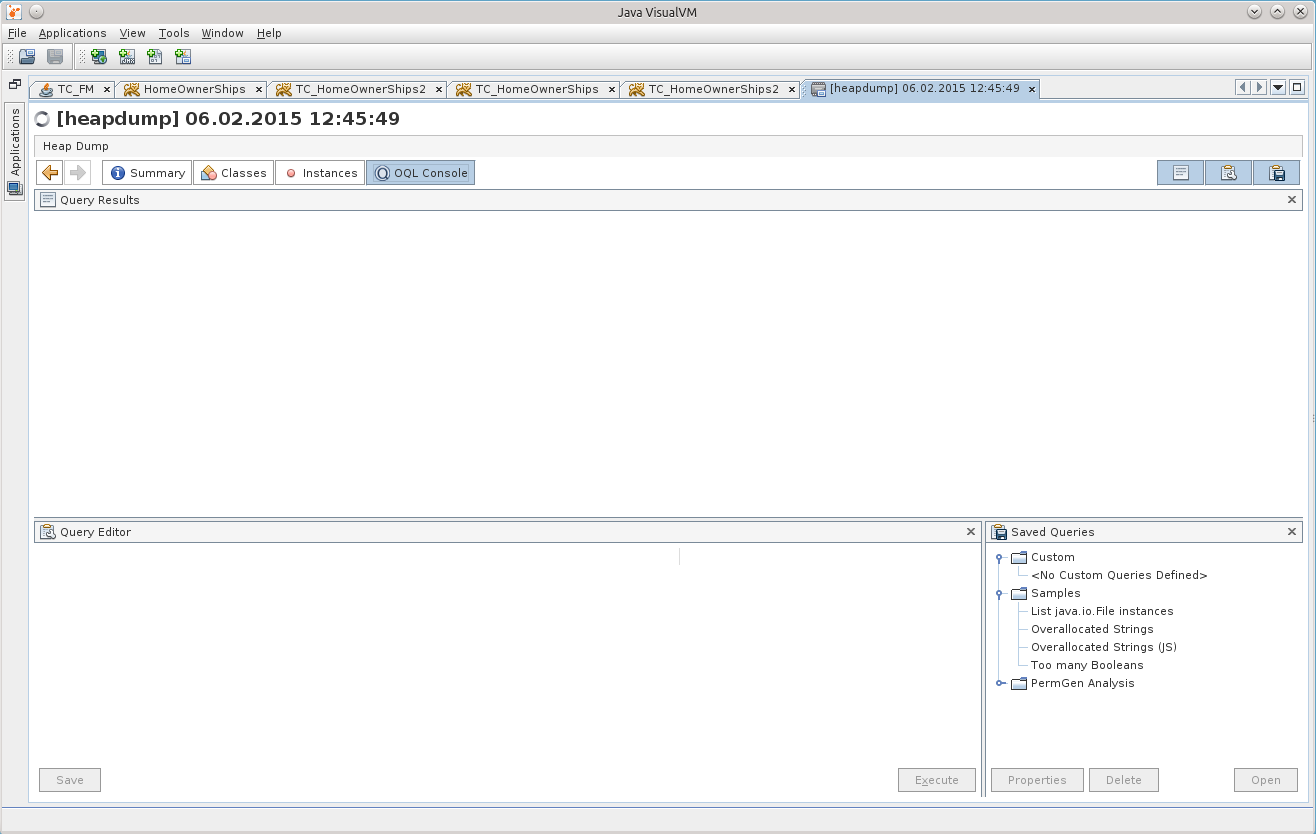
There was no time to sit in the viewer in the viewer, and my attention was finally drawn to the OQL Console tab, I thought that here it is, the moment of truth - I’ll either start using it to its fullest, or I’ll forget about all this.
Before starting, of course, a question was asked of Google, and he kindly provided a cheat sheet for using OQL in JVVM: http://visualvm.java.net/oqlhelp.html
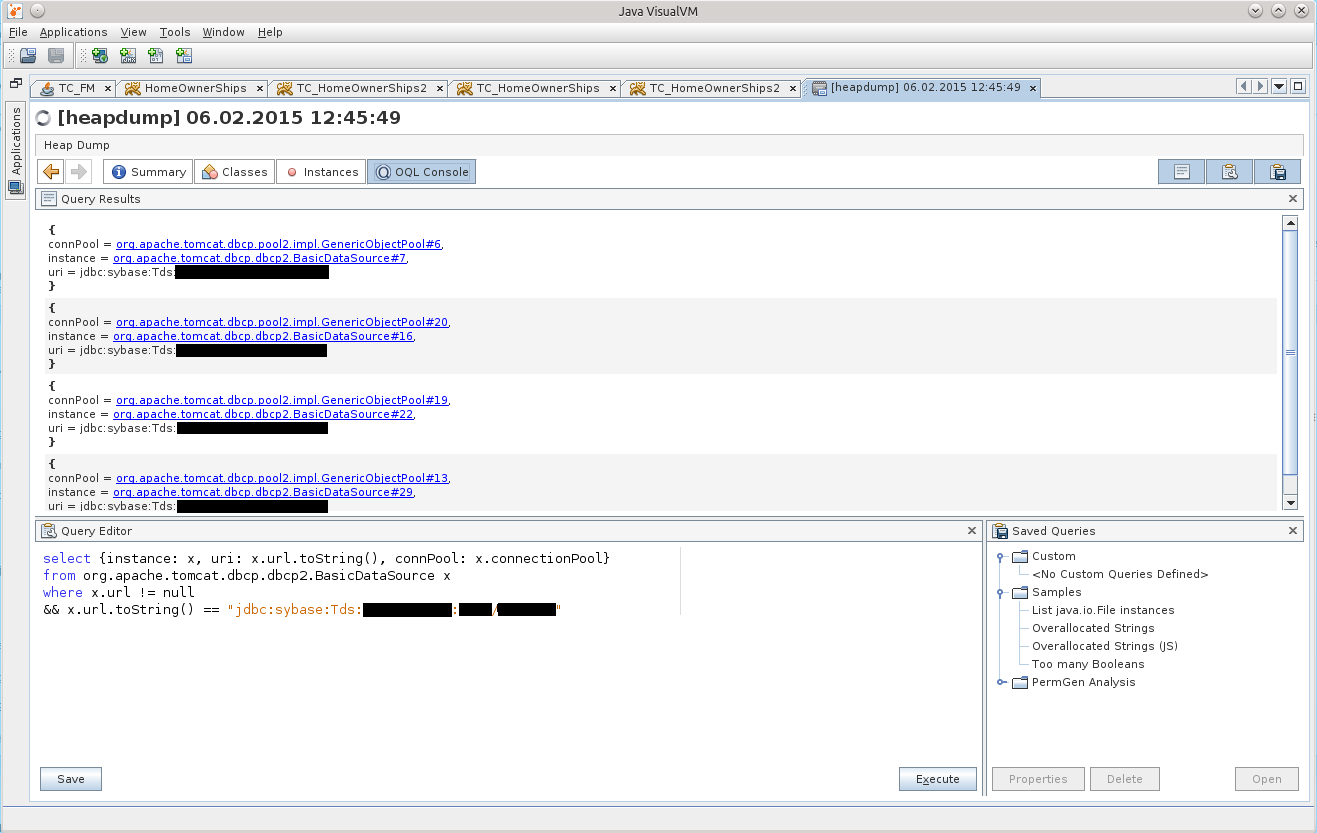
At first, the abundance of compressed information made me discouraged, but after using google fu, the following OQL query appeared:
select {instance: x, uri: x.url.toString(), connPool: x.connectionPool}
from org.apache.tomcat.dbcp.dbcp2.BasicDataSource x
where x.url != null
&& x.url.toString() == "jdbc:sybase:Tds:айпишник:порт/базаДанных"
This is already amended and supplemented, the final version of this request :)
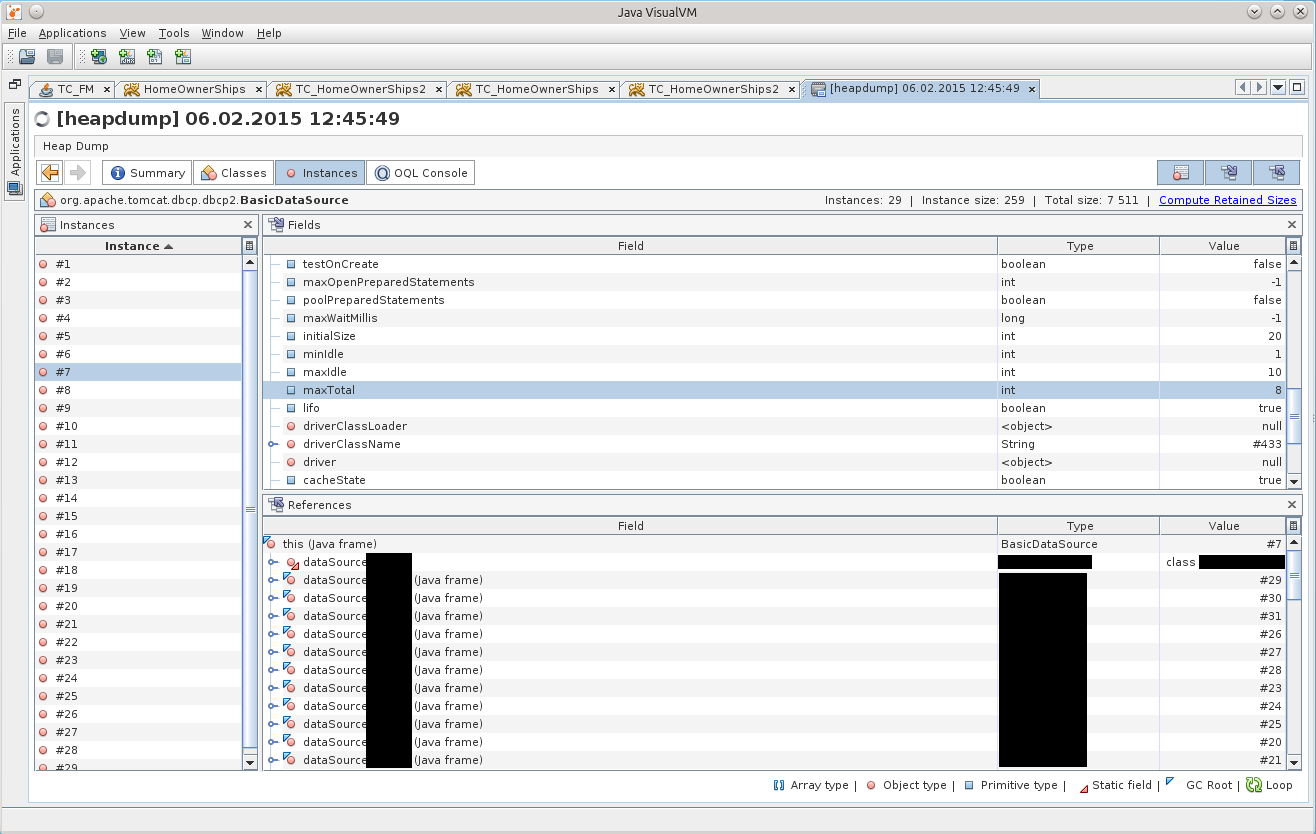
The result can be seen in the screenshot:
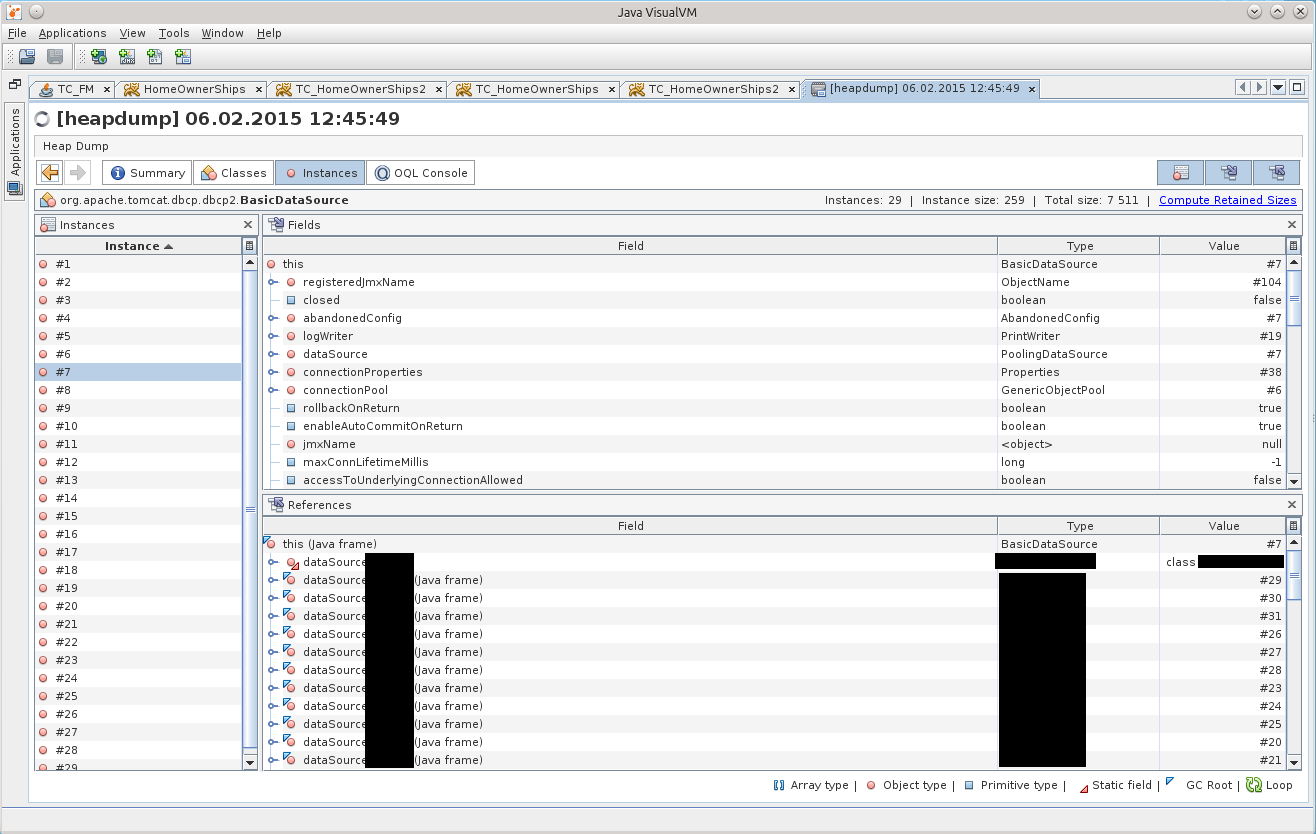
After clicking on BasicDataSource # 7 we get to the desired object in the Instances tab:
After a while, it dawned on me that there is one discrepancy with the configuration indicated in the tag Resource on the tomkette, in the /conf/context.xml file. Indeed, the maxTotal parameter has a value of 8 in the dump, while we set maxActive to 20 ...
Then it started to come to me that the application had been living with the wrong connection pool configuration for all these two weeks!
For brevity, I’ll write here that if you use Tomcat and use DBCP as the connection pool, then DBCP version 1.4 is used in the 7th volume and DBCP 2.0 is used in the 8th volume, which, as I later found out, decided to rename some parameters! And about maxTotal in general, it is written on the main page of the site :)
http://commons.apache.org/proper/commons-dbcp/
“Users should also be aware that some configuration options (eg maxActive to maxTotal) have been renamed to align them with the new names used by Commons Pool 2. "
Causes
He called them anyway, calmed down, and decided to figure it out.
As it turned out, the BasicDataSourceFactory class simply simply receives this Resource, looks to see if it has the parameters it needs, and picks them up into the generated BasicDataSource object, silently completely ignoring everything that doesn't interest it.
It so happened that they renamed the funniest parameters, maxActive => maxTotal, maxWait => maxWaitMillis, removeAbandoned => removeAbandonedOnBorrow & removeAbandonedOnMaintenance.
By default, maxTotal, as before, is 8; removeAbandonedOnBorrow, removeAbandonedOnMaintenance = false, maxWaitMillis is set to wait forever.
It turned out that the pool turned out to be configured with a minimum number of connections; if free connections end, the application silently waits for them to free; and the silence finishes everything in the logs about the "abandoned" connections - something that could immediately show in which place the
This is now the whole mosaic has developed quickly, and this knowledge has been extracted longer.
“It shouldn't be like that,” I decided, and gash the patch ( https://issues.apache.org/jira/browse/DBCP-435 , put it at http://svn.apache.org/viewvc/commons/proper/ dbcp / tags / DBCP_2_1 / src / main / java / org / apache / commons / dbcp2 / BasicDataSourceFactory.java? view = markup), the patch was adopted and entered into DBCP version 2.1. When and if Tomcat 8 upgrades the DBCP version to 2.1+, I think that many secrets will be revealed to administrators about their Resource configuration :)
As for this incident, I just have to tell one more detail - what the hell in the dump was already 29 DataSource's instead of only 7 pieces. The answer lies in the banal arithmetic, 7 * 4 = 28 + 1 = 29.
More about why you cannot drop Resource into the /conf/context.xml file of the tomket
For each subfolder inside the / webapps folder, its own copy /conf/context.xml is raised, which means that the number of Resource that is there should be multiplied by the number of applications to get the total number of pools raised in the memory of the socket. To the question "what should I do in this case?" the answer is this: you need to make all Resource declarations from /conf/context.xml to the /conf/server.xml file, inside the GlobalNamingResources tag. There you can find one, by default, Resource name = "UserDatabase", here under it and place your pools. Next, you need to use the ResourceLink tag, it is desirable to place it in the application, in the project, inside the file /META-INF/context.xml - this is the so-called “per-app context”, that is, a context that contains declarations of components that will be available only for deployable application.
For example:
This link will snatch from the globally declared DataSource named "jdbc / MyDB" and the resource will be available to the application.
ResourceLink can also be (but not necessary) placed in /conf/context.xml, but in this case all applications will have access to resources declared globally, even if there will not be as many copies of the DataSource in memory.
You can read the details here: GlobalNamingResources - http://tomcat.apache.org/tomcat-7.0-doc/config/globalresources.html#Environment_Entries , ResourceLink - http://tomcat.apache.org/tomcat-7.0-doc /config/globalresources.html#Resource_Links , you can also view this page: tomcat.apache.org/tomcat-7.0-doc/config/context.html .
For TC8 the same pages:http://tomcat.apache.org/tomcat-8.0-doc/config/globalresources.html and http://tomcat.apache.org/tomcat-8.0-doc/config/context.html .
After that, everything became clear: 11 connections were because in one active DataSource 8 connections were eaten (maxTotal = 8), and another minIdle = 1 in three other unused DataSource copies.
That Friday, we rolled back to Tomcat 7, which was lying next to it, and waited for it to get rid of, it gave us time to calmly figure it out.
Plus later, already on TC7, a connection leak was discovered, all thanks to removeAbandoned + logAbandoned. DBCP happily reported to the catalina.log logfile that
"org.apache.tomcat.dbcp.dbcp.AbandonedTrace$AbandonedObjectException: DBCP object created 2015-02-10 09:34:20 by the following code was never closed:
	at org.apache.tomcat.dbcp.dbcp.AbandonedTrace.setStackTrace(AbandonedTrace.java:139)
	at org.apache.tomcat.dbcp.dbcp.AbandonedObjectPool.borrowObject(AbandonedObjectPool.java:81)
	at org.apache.tomcat.dbcp.dbcp.PoolingDataSource.getConnection(PoolingDataSource.java:106)
	at org.apache.tomcat.dbcp.dbcp.BasicDataSource.getConnection(BasicDataSource.java:1044)
	at наш.пакет.СуперКласс.getConnection(СуперКласс.java:100500)
	at наш.пакет.СуперКласс.плохойПлохойМетод(СуперКласс.java:100800)
	at наш.пакет.СуперКласс.вполнеВменяемыйМетод2(СуперКласс.java:100700)
	at наш.пакет.СуперКласс.вполнеВменяемыйМетод1(СуперКласс.java:100600)
	ещё куча строк..."
This bad one, the Bad Method, has a connection con in the signature, but inside it was the construction of “con = getConnection ();”, which became a stumbling block. SuperClass is rarely called, so they did not pay attention to it for so long. Plus, the calls did not occur, as I understand it, during the working day, so even if something was hanging, then no one else cared. And in TusamuyuPatnitsa just the stars converged, the head of the customer department needed to see something :)
Appendix No. 2
As for the "event number 2" - they gave me the application for refactoring, and it immediately decided to crash on the servers.
Dumps have already come to me, and I decided to try to pick them too.
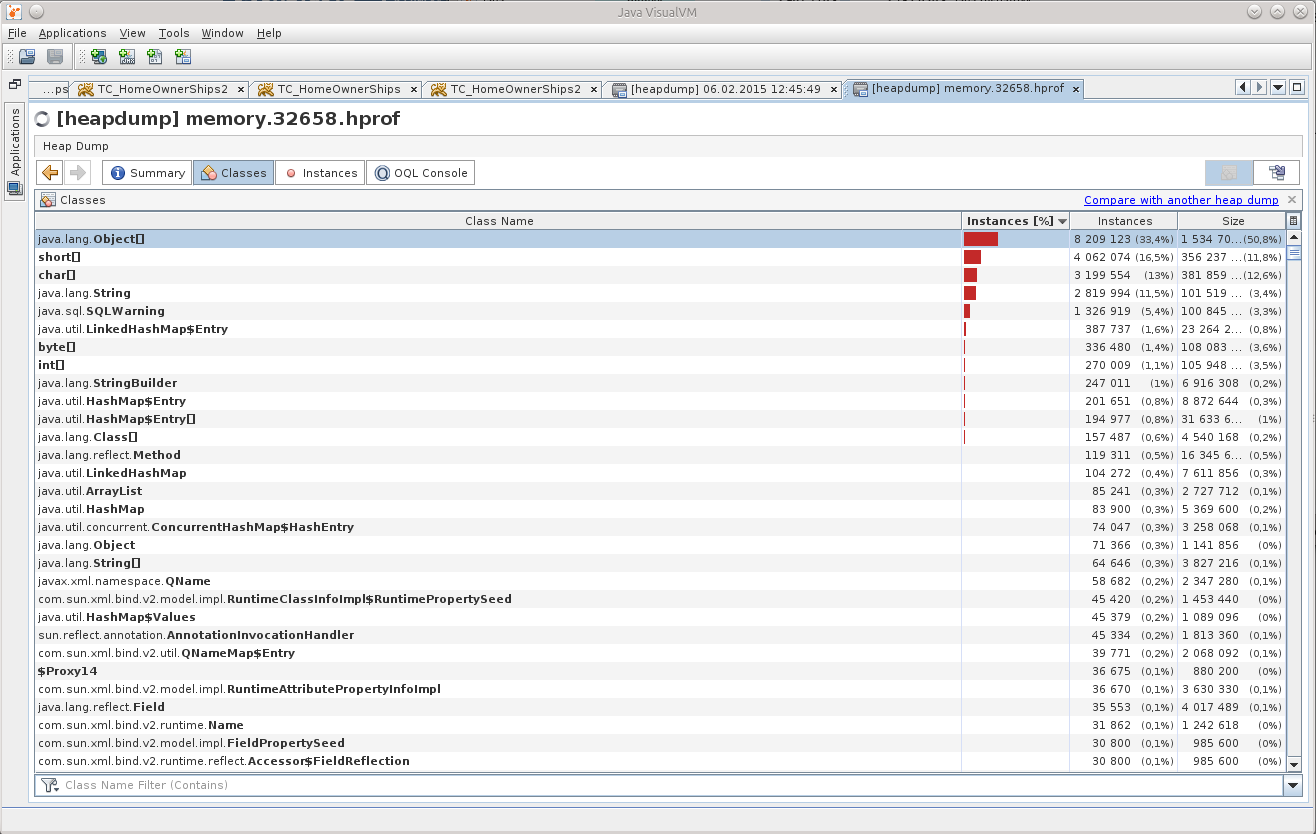
He opened a dump in the JVVM, and “cheered up a bit”:
What can be understood from Object [], and even in such quantity?
(An experienced person, of course, already saw the reason, right? :))
So I had the thought “well, really, no one has done this before, because there probably already is a ready-made tool!”. So I came across this question on StackOverflow: http://stackoverflow.com/questions/2064427/recommendations-for-a-heap-analysis-tool-for-java .
After looking at the proposed options, I decided to stop at MAT, I had to try at least something, but this is an open project, and even with a lot more votes than the rest of the items.
Eclipse Memory Analyzing Tool
So, MAT.
I recommend downloading the latest version of Eclipse, and installing MAT there, because the stand-alone version of MAT behaves badly, there is some kind of devilishness with dialogs, the contents in the fields are not visible in them. Maybe someone will tell you in the comments what he is missing, but I solved the problem by installing MAT in Eclipse.
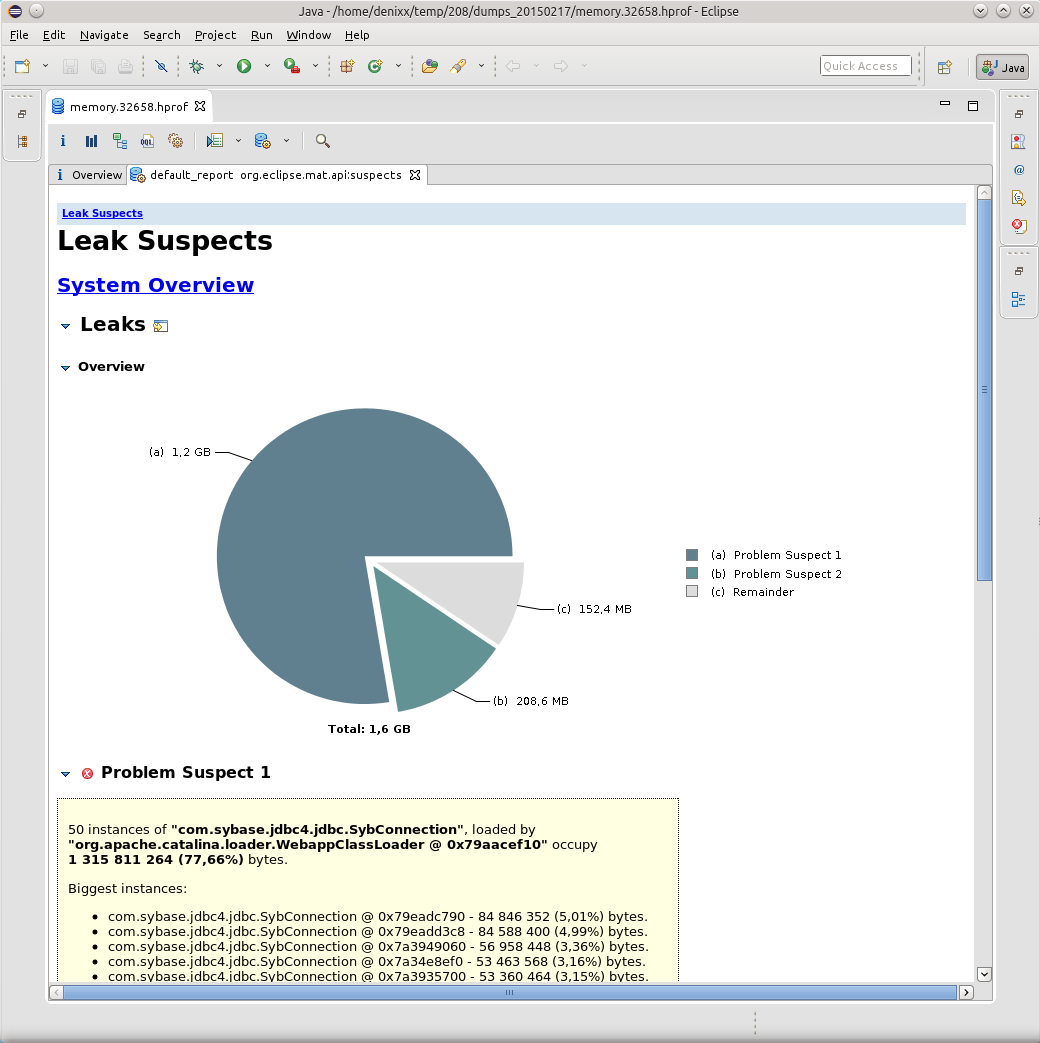
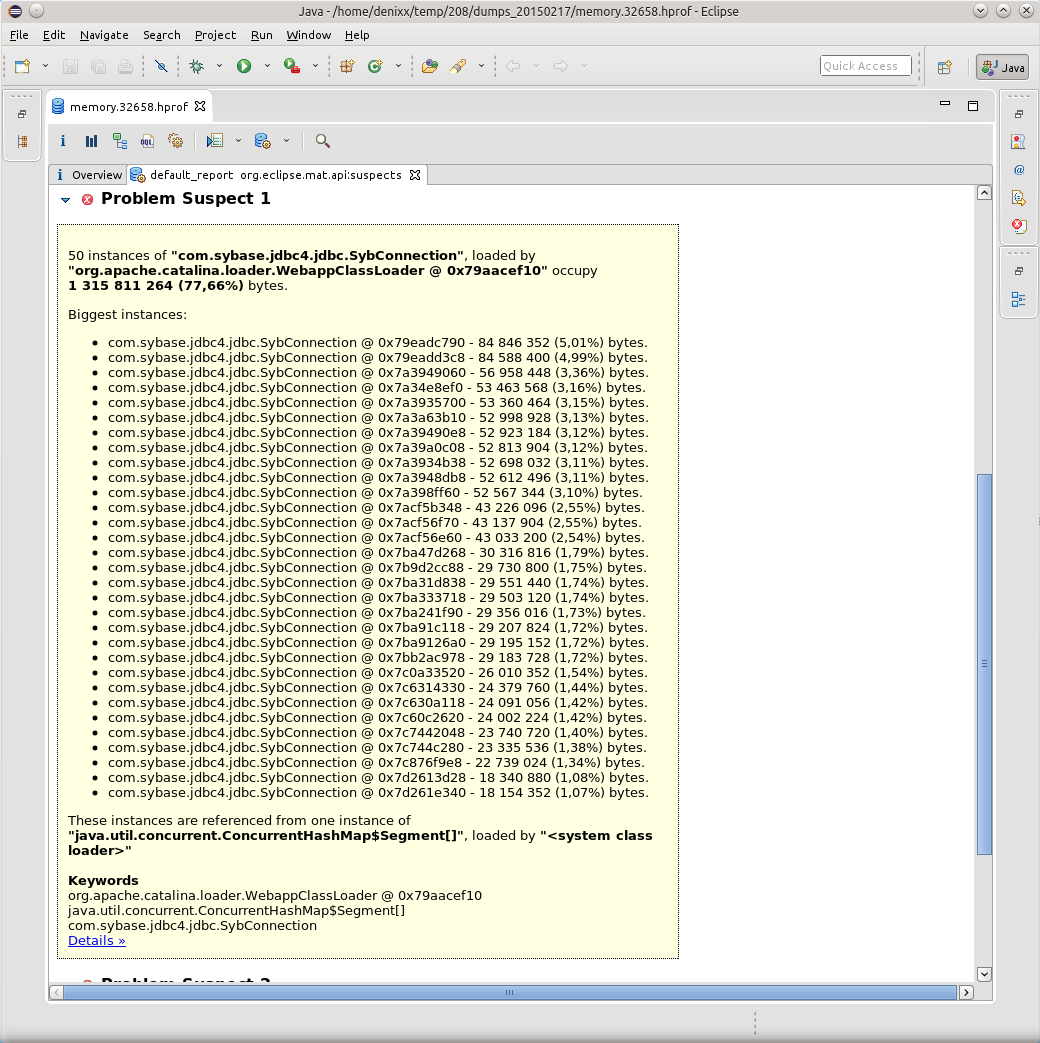
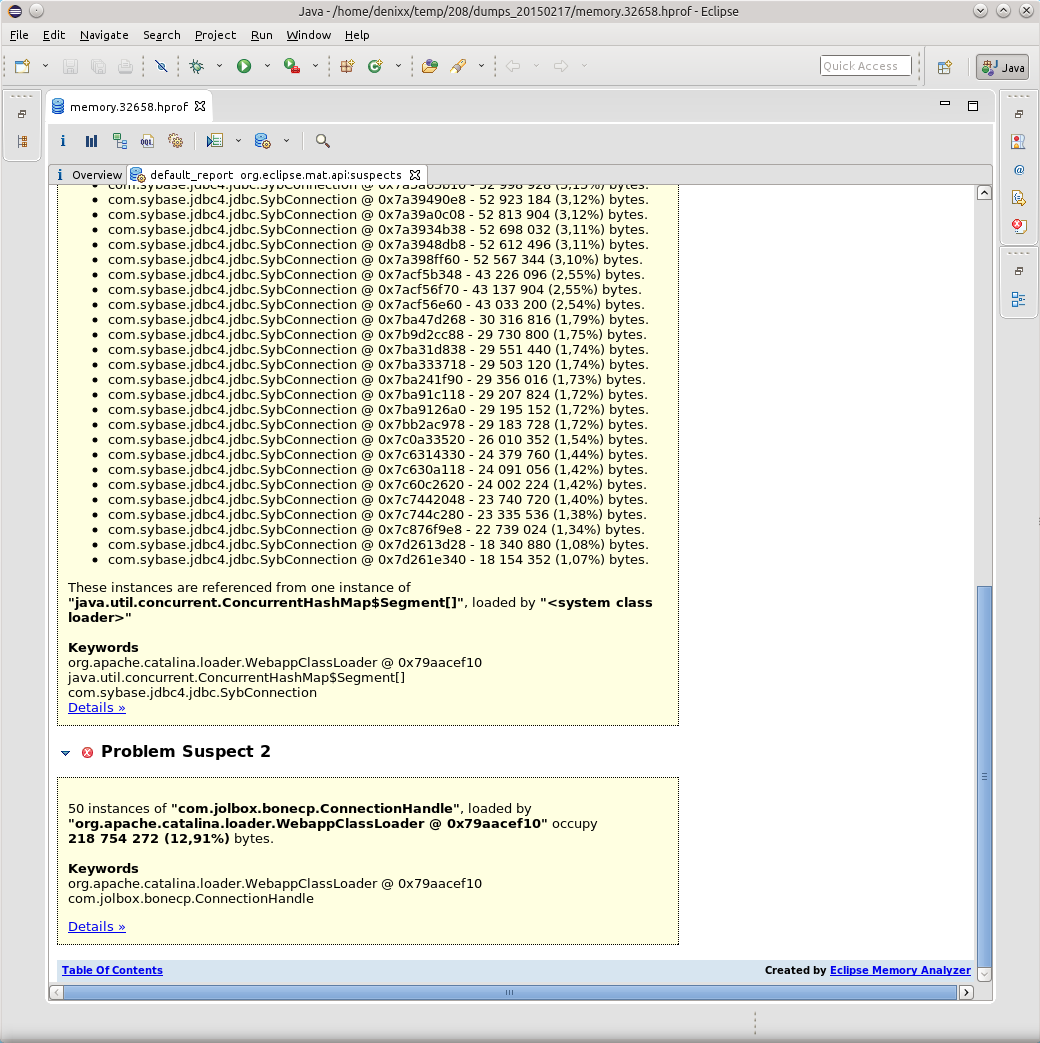
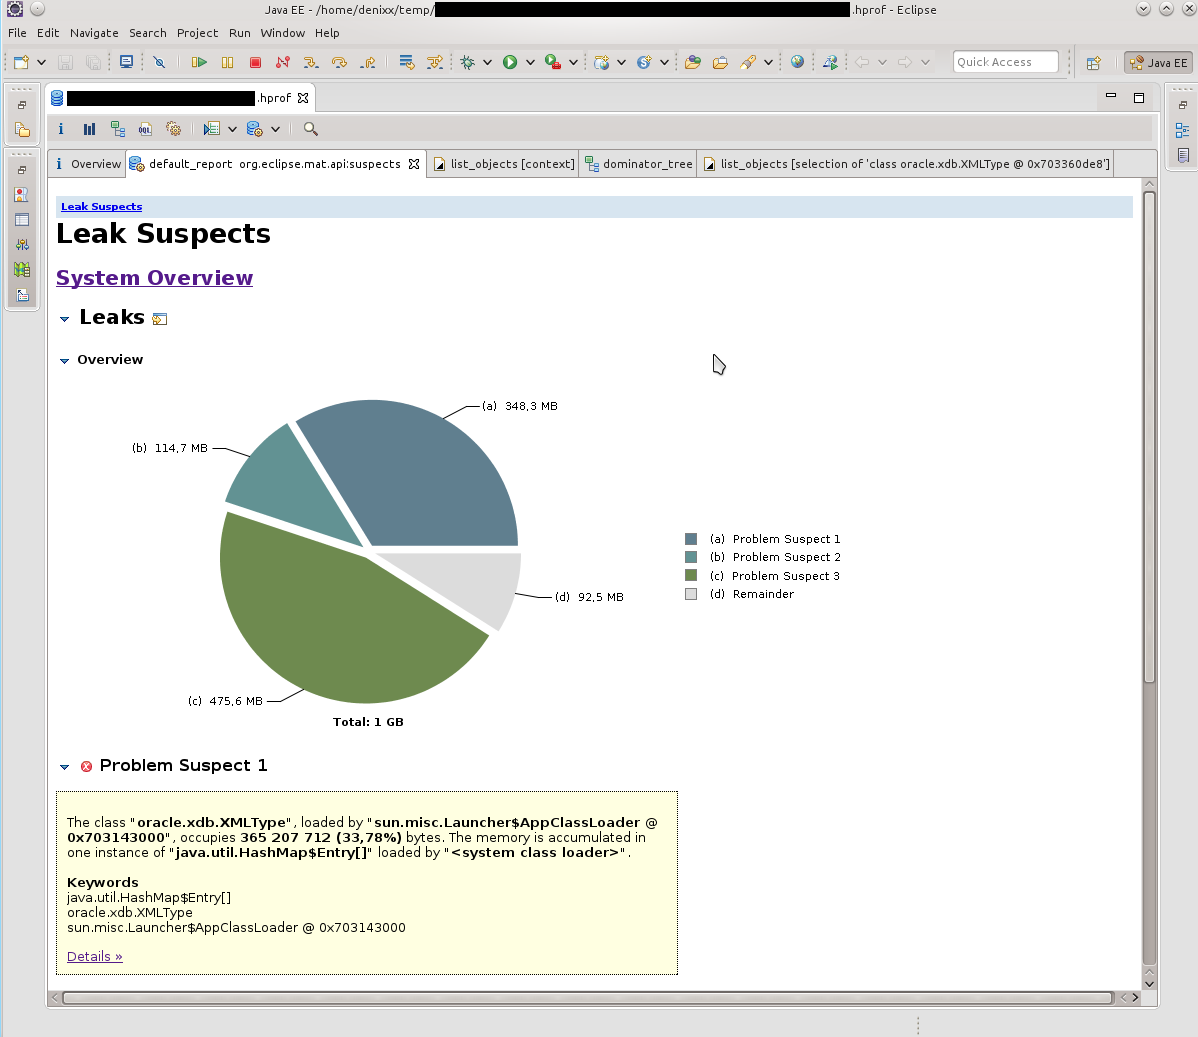
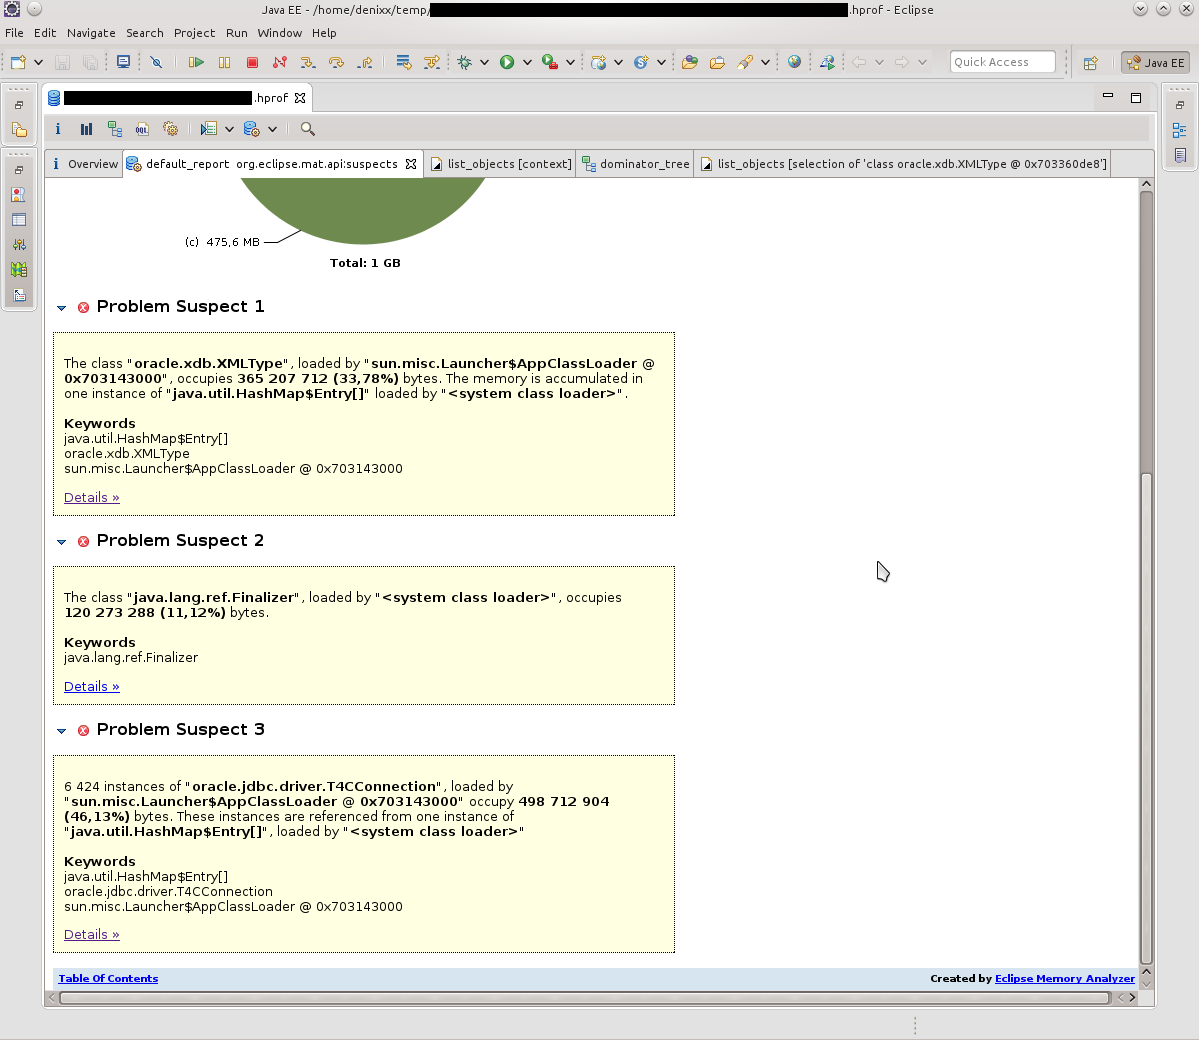
Having opened the dump in MAT, I requested the execution of the Leak Suspects Report.
Surprise knew no bounds, to be honest.
1.2 gigabytes weigh connections to the base.
Each connection weighs from 17 to 81 megabytes.
Well, the pool itself is also “a little”.
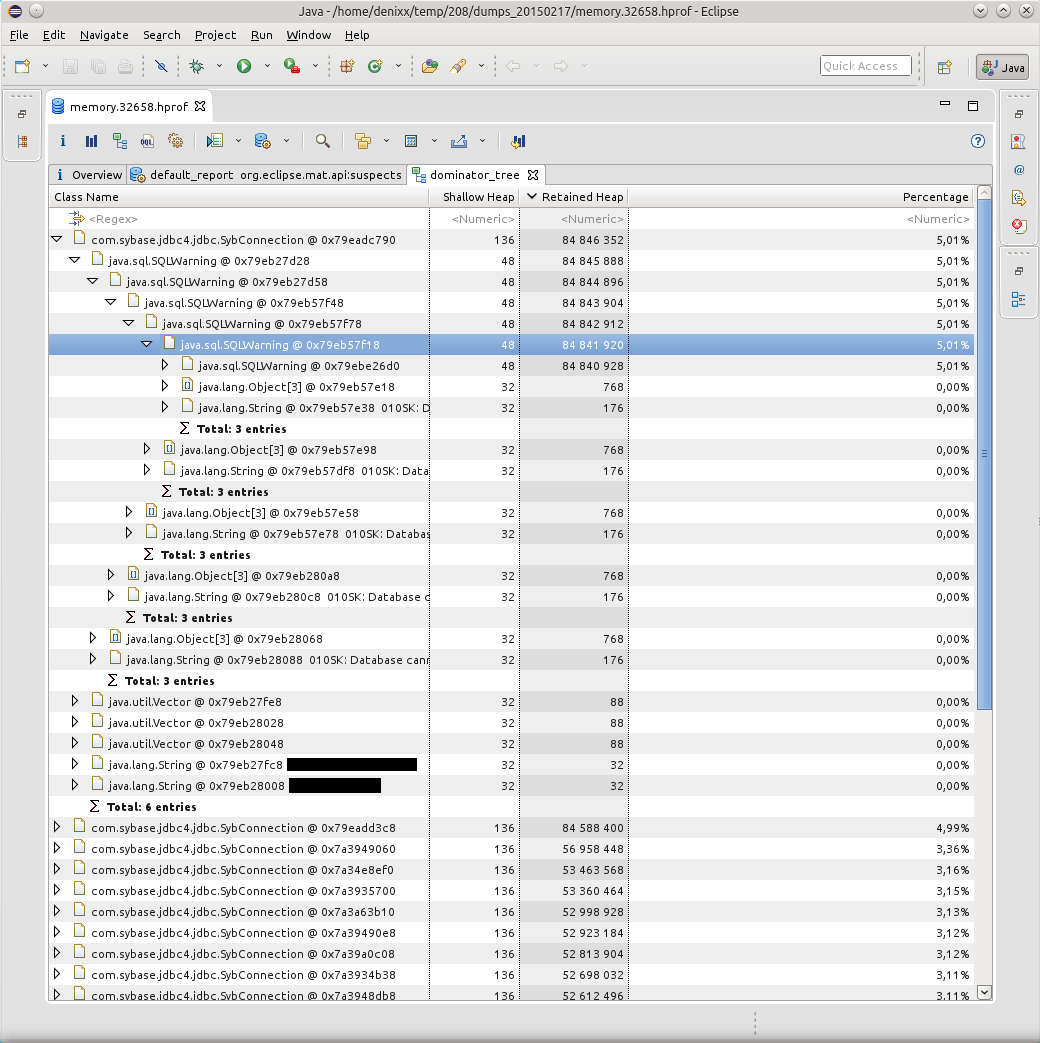
The Dominator Tree report helped visualize the problem:
Kilometers of SQLWarning turned out to be the cause of all the falls, the database persistently tried to make it clear that “010SK: Database cannot set connection option SET_READONLY_TRUE.”, And the BoneCP connection pool does not clear SQLWarning after the connections are released and returned to the pool (maybe this is somewhere then you can configure? Tell me, if anyone knows).
Google said that such a problem with Sybase ASE has been known since 2004: https://forum.hibernate.org/viewtopic.php?f=1&t=932731
In short, "Sybase ASE doesn't require any optimizations, therefore setReadOnly () produces a SQLWarning. ”, and these solutions still work.
However, this is not quite a solution to the problem, because the solution to the problem is when, when the connection is returned to the pool, all the database notifications are cleared due to the fact that no one will ever need them.
And DBCP can do this: http://svn.apache.org/viewvc/commons/proper/dbcp/tags/DBCP_1_4/src/java/org/apache/commons/dbcp/PoolableConnectionFactory.java?view=markup , method passivateObject (Object obj), on line 687 you can see conn.clearWarnings ();, this call saves SQLWarning from kilometers in memory.
I learned about this from the ticket: https://issues.apache.org/jira/browse/DBCP-102
I was also told about this ticket in the bugtracker: https://issues.apache.org/jira/browse/DBCP- 234 , but it already applies to DBCP 2.0.
As a result, I switched the application to DBCP (albeit version 1.4). Although the load on the service is rather big (from 800 to 2k requests per minute), but still the application behaves well, and this is the main thing. And he did it right, because BoneCP has not been supported for five months, however, HikariCP has replaced him. You will need to see how things are in its source ...
Fighting OOM
Impressed by how MAT laid out everything on the shelves, I decided not to throw this powerful tool, and later it came in handy for me, because in the first application there were all sorts of “unaccounted for” things — unaccounted for things in the application code or stored procedure code that sometimes lead to the fact that the application glues fins. I still catch them.
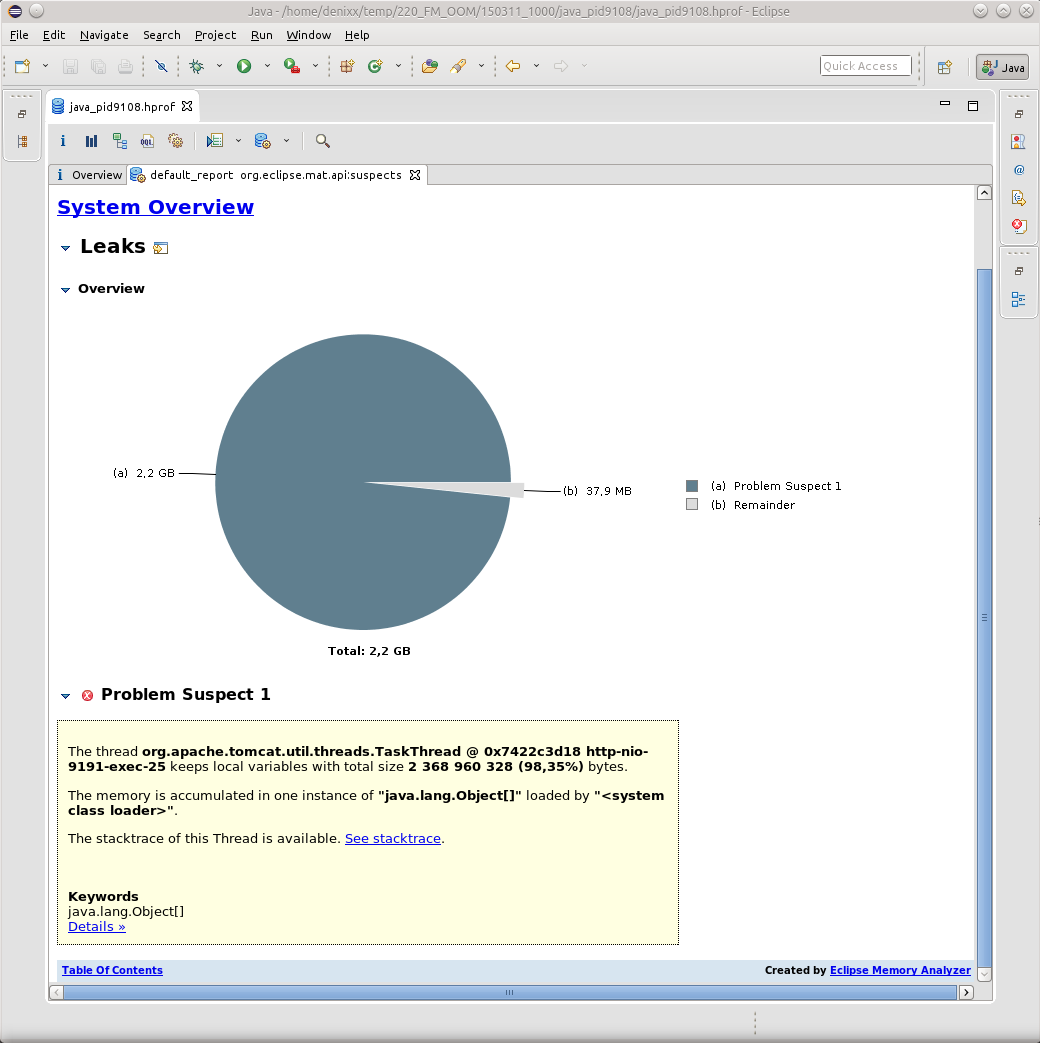
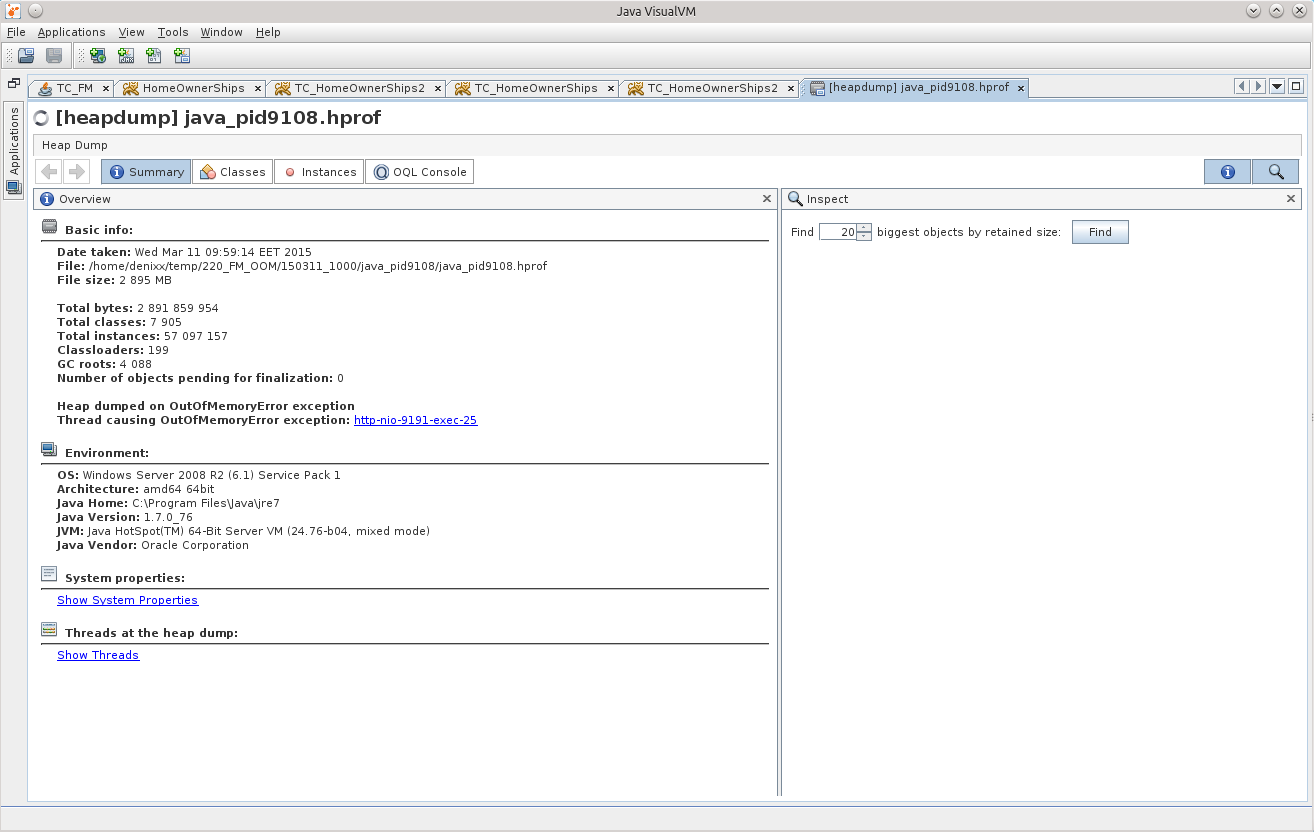
Armed with both tools, I began to pick each sent dump in search of the reasons for the fall on OOM.
As a rule, all OOMs led me to TaskThread.
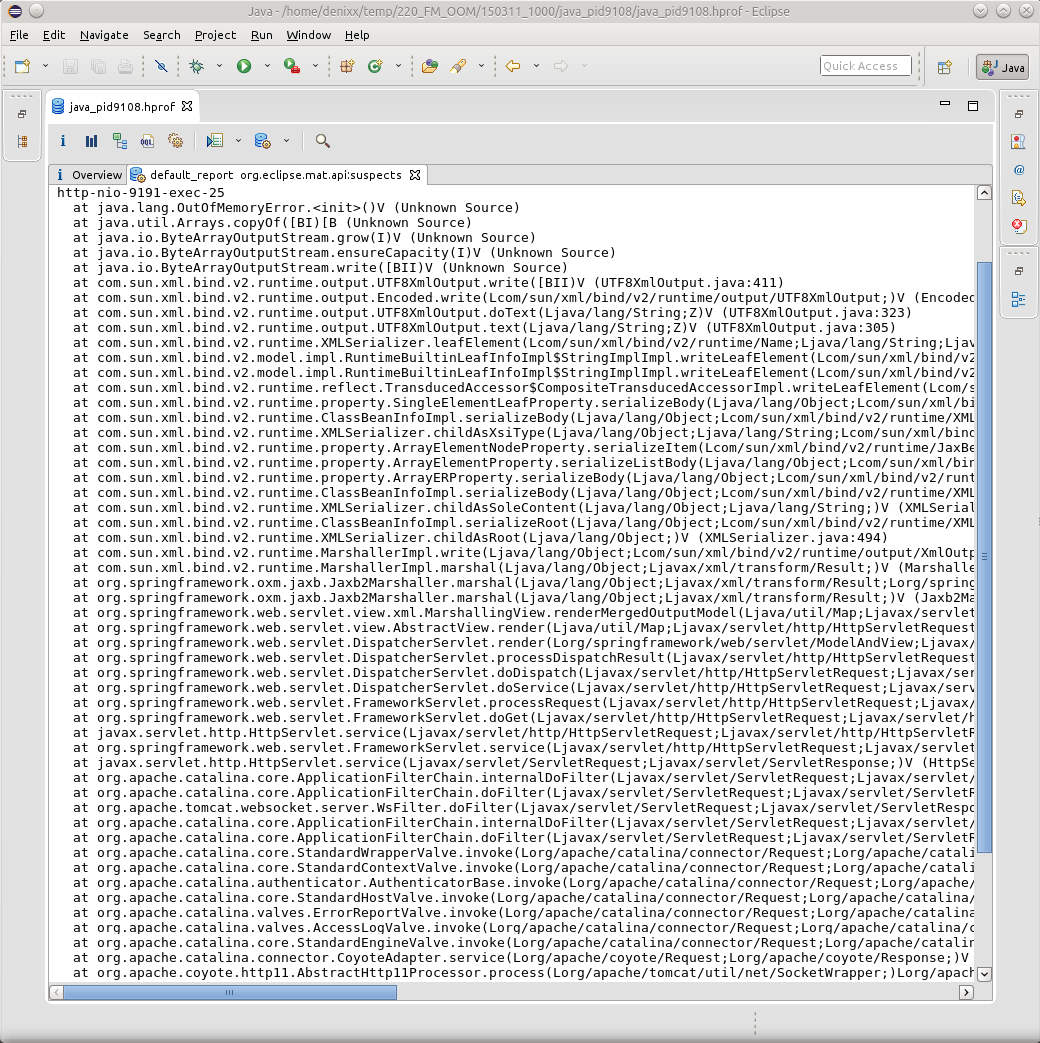
And if you click on the inscription See stacktrace, then yes, it will be just a trivial case, when some thread suddenly fell while trying to marshal the result of its work.
However, nothing here indicates the cause of OOM; here it is only the result. So far, because of the lack of knowledge of all the magic of OQL in MAT, it is JVVM that helps me find the reason.
We load the dump there, and try to find the reason!
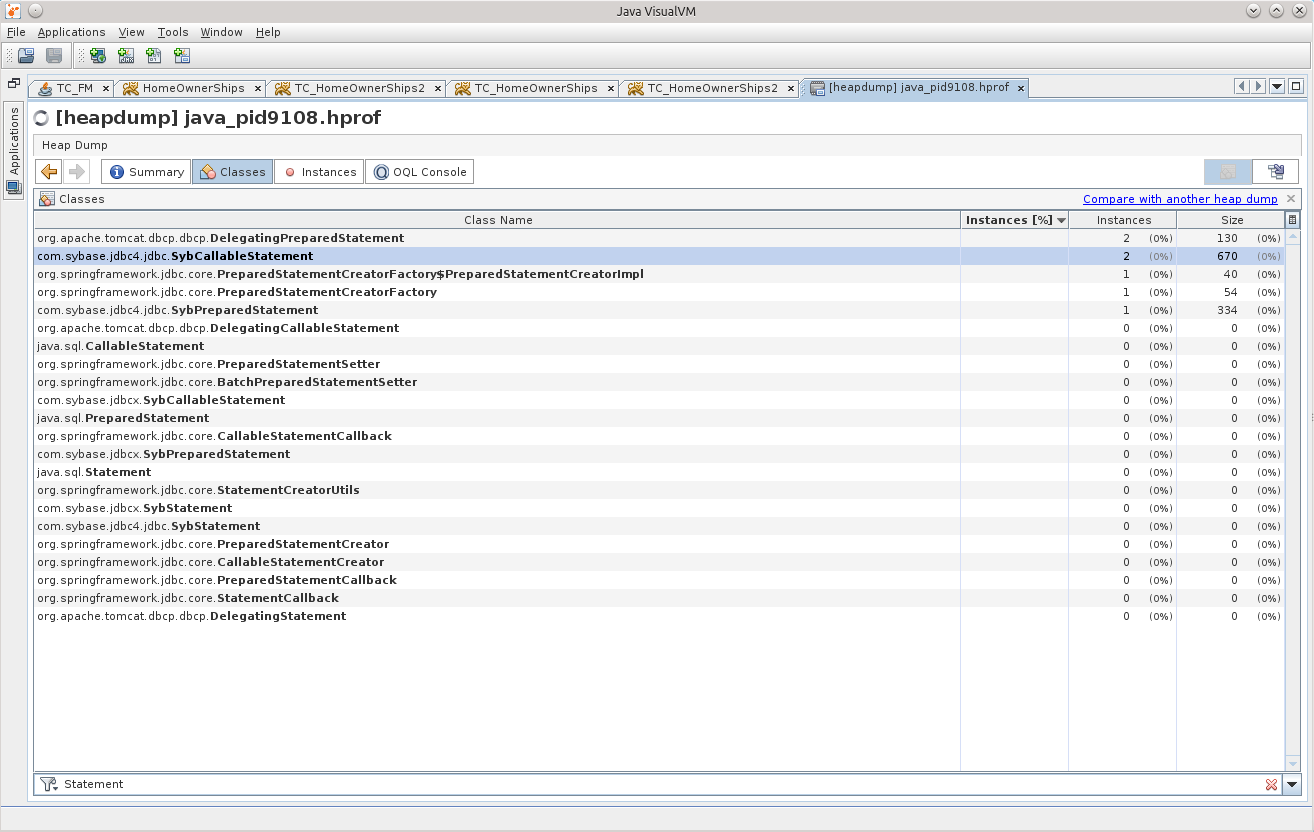
Of course, I should look for exactly the things related to the database, and therefore let us first try to see if there are Statements in memory.
Two SybCallableStatement, and one SybPreparedStatement.
I think that the matter will become more complicated if Statement'ov will be much larger, but having a little bit of lining up one of the following queries, indicating in the where the necessary conditions, I think everything will work out for you. Plus, of course, it's worth a good look in the MAT, what kind of results it is trying to marshal the stream, which object, and it will become clearer which of the Statement's to look for.
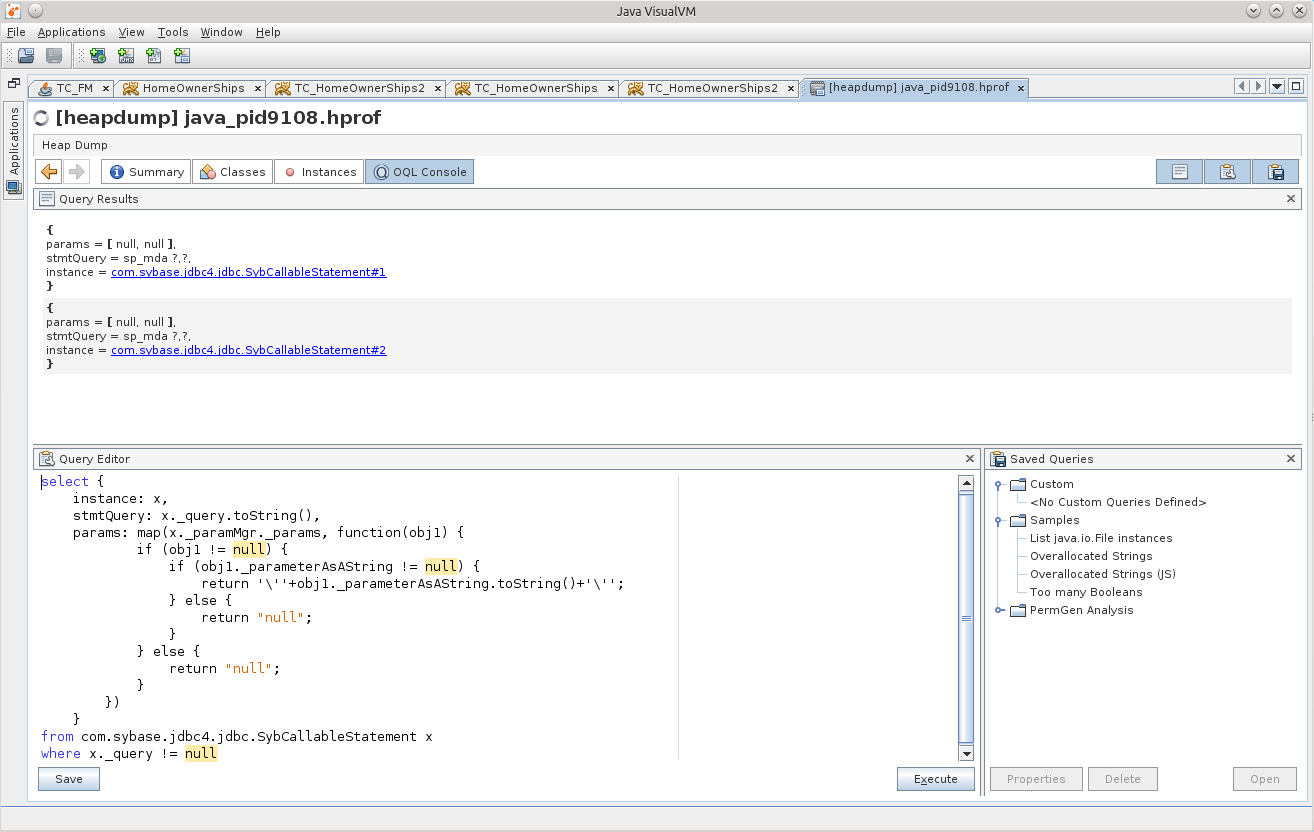
select {
    instance: x,
    stmtQuery: x._query.toString(),
    params: map(x._paramMgr._params, function(obj1) {
            if (obj1 != null) {
                if (obj1._parameterAsAString != null) {
                    return '\''+obj1._parameterAsAString.toString()+'\'';
                } else {
                    return "null";
                }
            } else {
                return "null";
            }
        })
    }
from com.sybase.jdbc4.jdbc.SybCallableStatement x
where x._query != null
Not that these are “internal” challenges.
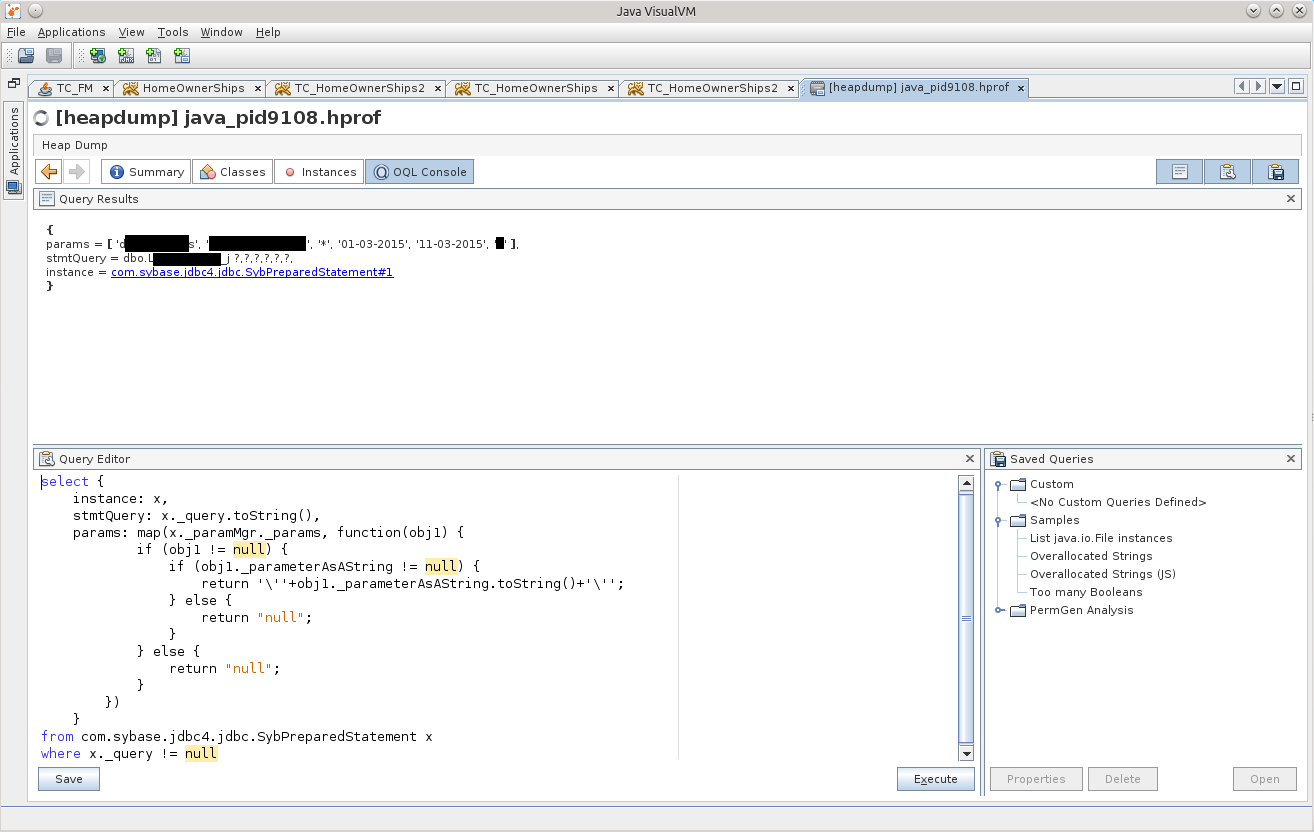
select {
    instance: x,
    stmtQuery: x._query.toString(),
    params: map(x._paramMgr._params, function(obj1) {
            if (obj1 != null) {
                if (obj1._parameterAsAString != null) {
                    return '\''+obj1._parameterAsAString.toString()+'\'';
                } else {
                    return "null";
                }
            } else {
                return "null";
            }
        })
    }
from com.sybase.jdbc4.jdbc.SybPreparedStatement x
where x._query != null
And here is the game!
For the purity of the experiment, you can throw the same query in your favorite DB-IDE, and it will work out for a very long time, and if you delve into the bowels of the storage, it will be clear that there simply from the database that does not belong to us, 2 million rows are selected by such a query with such parameters. These two million even get into the application’s memory, but an attempt to marshal the result becomes fatal for the application. This is Harakiri. :)
At the same time, GC carefully removes all the evidence, but this did not save him, yet the source remained in his memory, and he will be punished.
For some reason, after all this story, I felt like I was still a failure.
Parting
So my story ended, I hope you enjoyed it :)
I would like to express my gratitude to my boss, he gave me time to figure it out. I think this new knowledge is very useful.
Thanks to the girls from Scorini for the invariably delicious coffee, but they will not read these words of gratitude - I even doubt that they know about the existence of Habrahabr :)
I would like to see even more useful information and additions in the comments, I will be very grateful.
I think it's time to read the documentation for MAT ...
UPD1 : Yes, I completely forgot to talk about such useful things as creating memory dumps.
docs.oracle.com/javase/7/docs/webnotes/tsg/TSG-VM/html/clopts.html#gbzrr
Options
-XX: + HeapDumpOnOutOfMemoryError
-XX: HeapDumpPath = / disk2 / dumps are
very useful for generating dumps when the application crashes with OutOfMemoryError,
and it is also possible to remove the memory dump from the application "in cash" in the middle of its operation.
There is a jmap utility for this.
An example of a call for Windows:
"C: \ install \ PSTools \ PsExec.exe" -s "C: \ Program Files \ Java \ jdk1.7.0_55 \ bin \ jmap.exe" -dump: live, format = b, file = C: \ dump.hprof 3440
the last parameter is the PID of the java process. The PsExec application from the PSTools suite allows you to run other applications with system rights, using the "-s" switch for this. The live option is useful to call GC before saving the dump, clearing the memory of garbage. In the case when OOM occurs, there is no need to clear the memory, there is no more garbage left there, so do not look for how you can set the live option in case of OOM.
UPD2 (2015-10-28) | Case number
(It was decided to add this here as an update, rather than sawing a new article about the same one):
Another interesting case, but with an Oracle database.
One of the projects uses a feature with XML, searches the contents of a saved XML document. In general, this project sometimes made itself felt by the fact that suddenly suddenly one of the instances stopped showing signs of life.
Sensing a “good” chance to practice
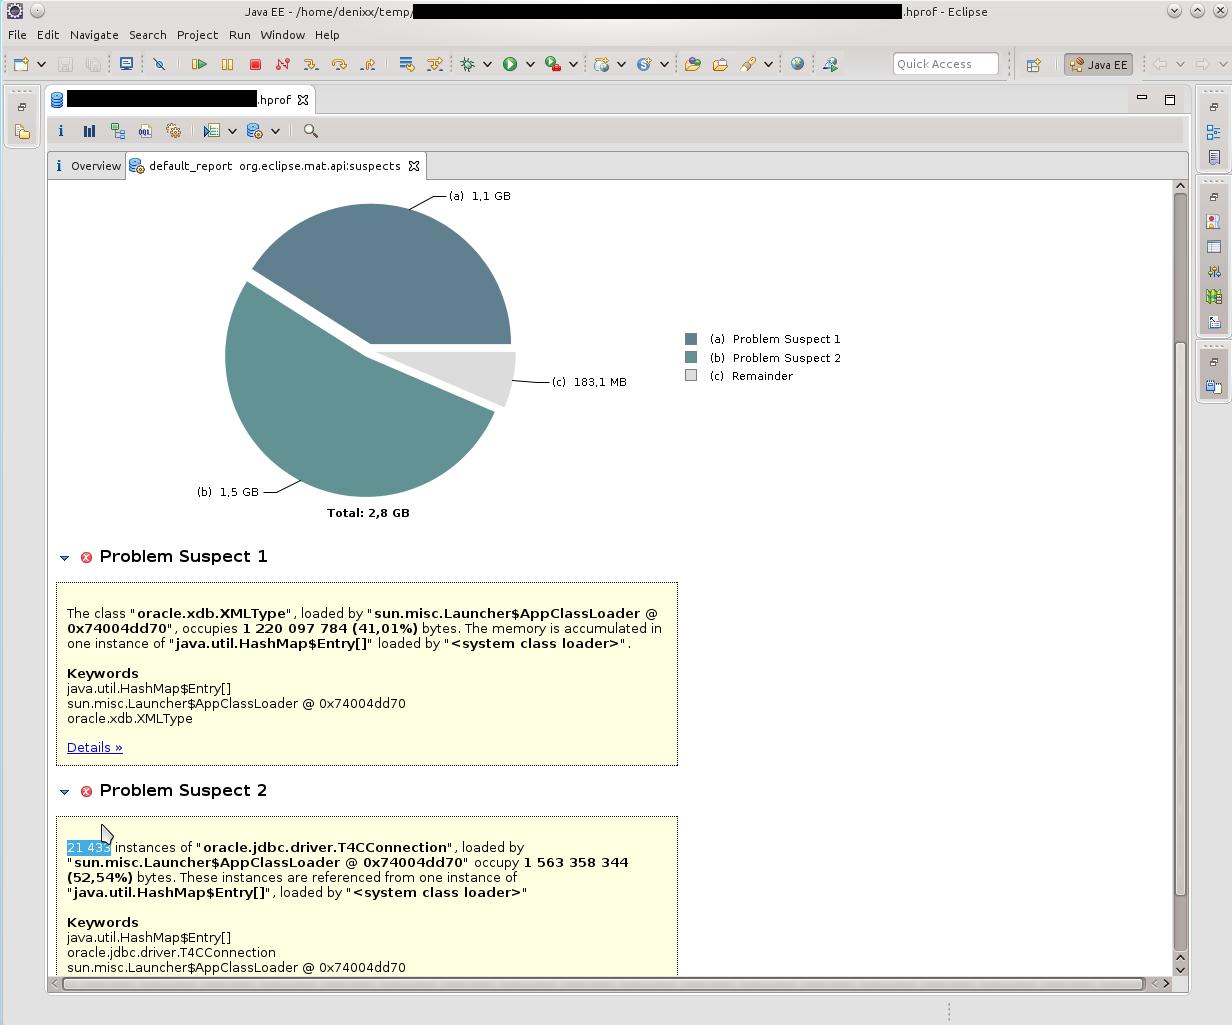
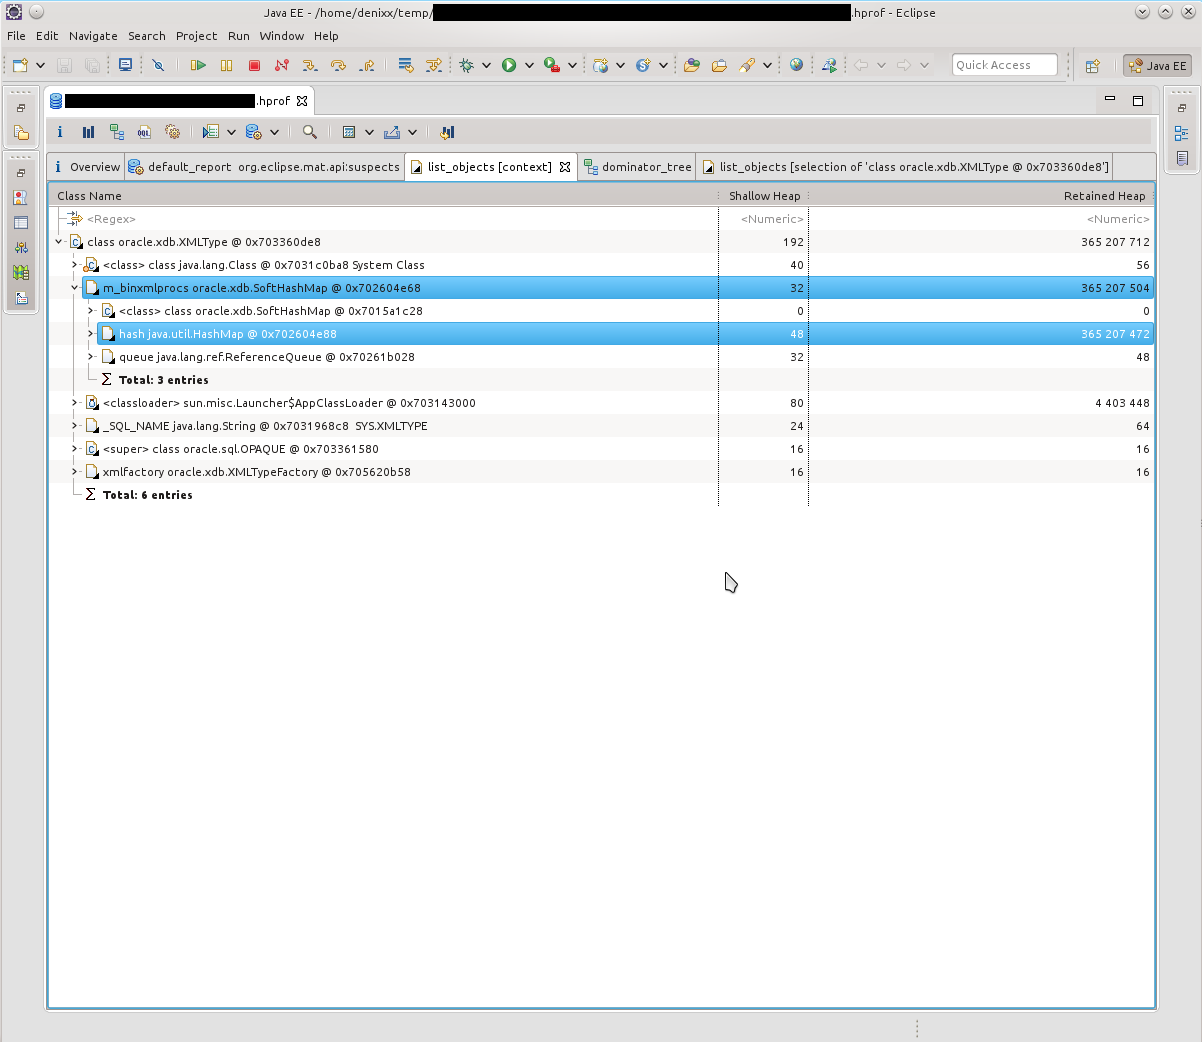
The first thing I saw was "you have a lot of connections left in your memory." 21k !!! And some interesting oracle.xdb.XMLType also gave heat. “But this is Oracle!”, Spun in my head. Looking ahead, I’ll say that yes, he’s to blame.
So, we see a bunch of T4CConnection that lie in the HashMap $ Entry. I noticed immediately that it seems to be SoftHashMap, which, like, should mean that it should not grow to such a size. But you see the result yourself - 50-60 kilobytes per connection, and there are really LOTS of them.
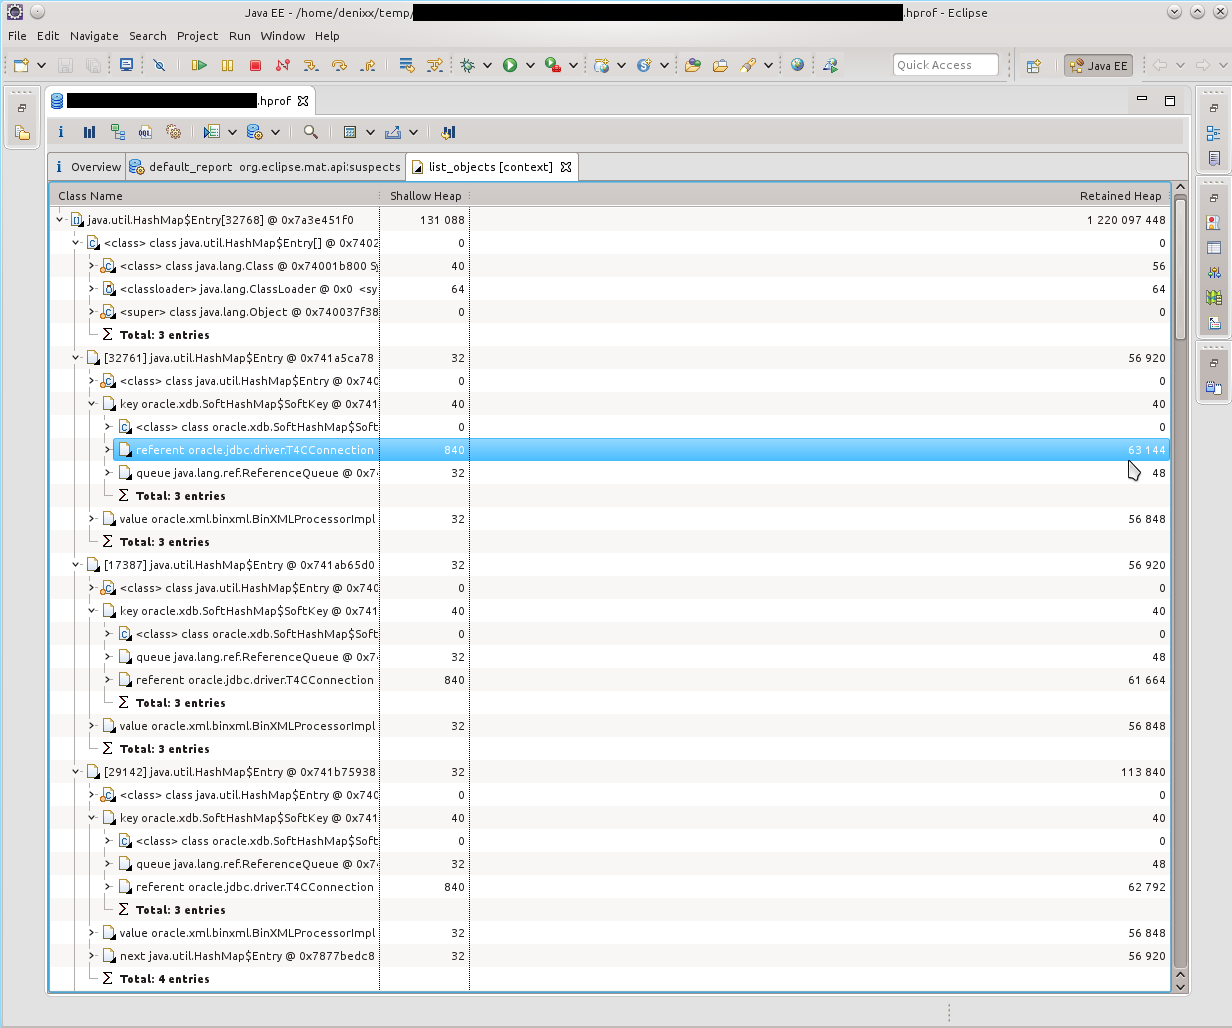
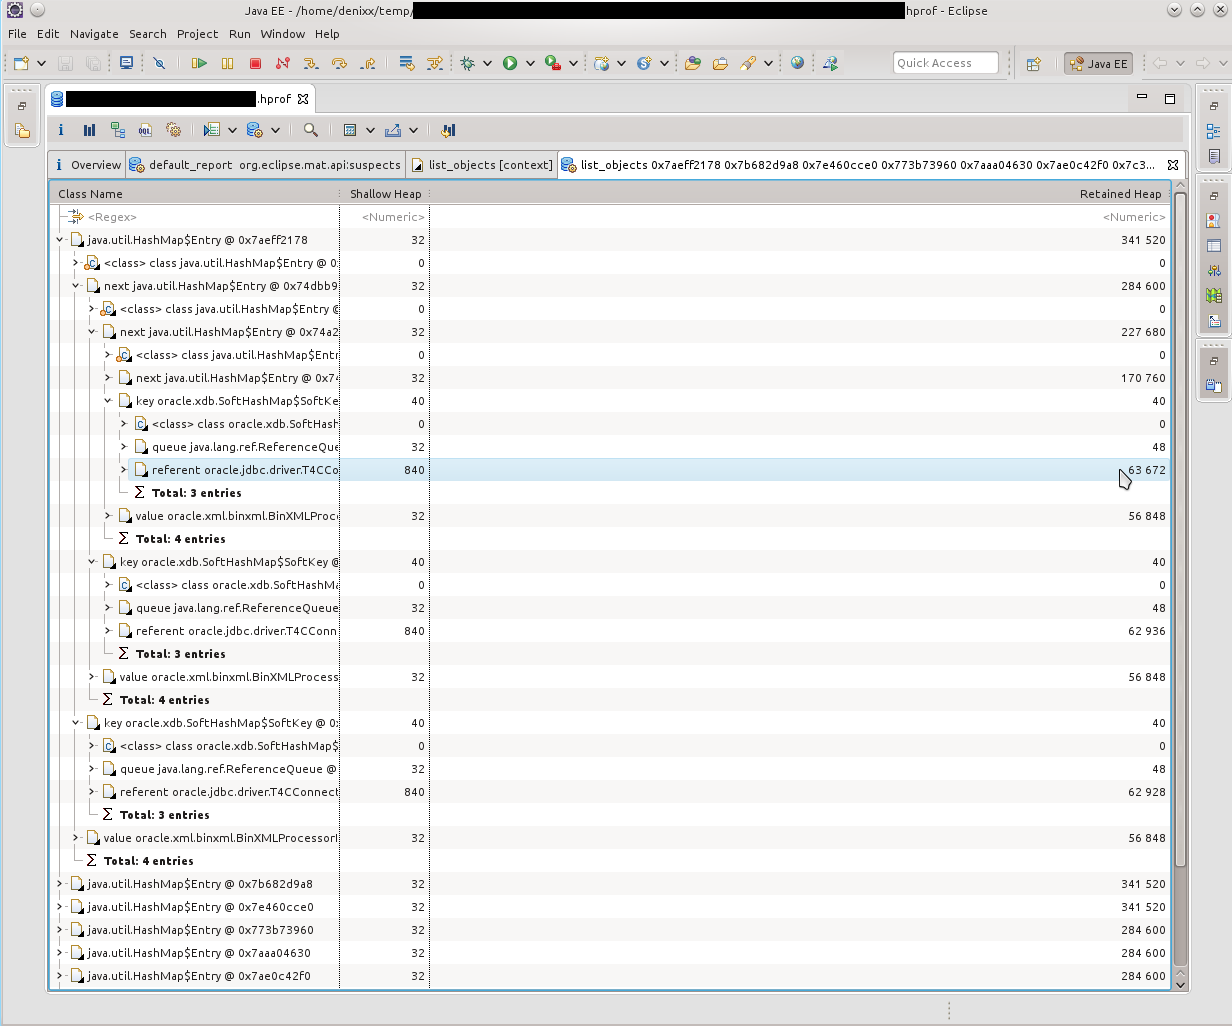
After seeing what HashMap $ Entry is, I saw that the picture is about the same, everything is connected with SoftHashMap, with Oracle connections.
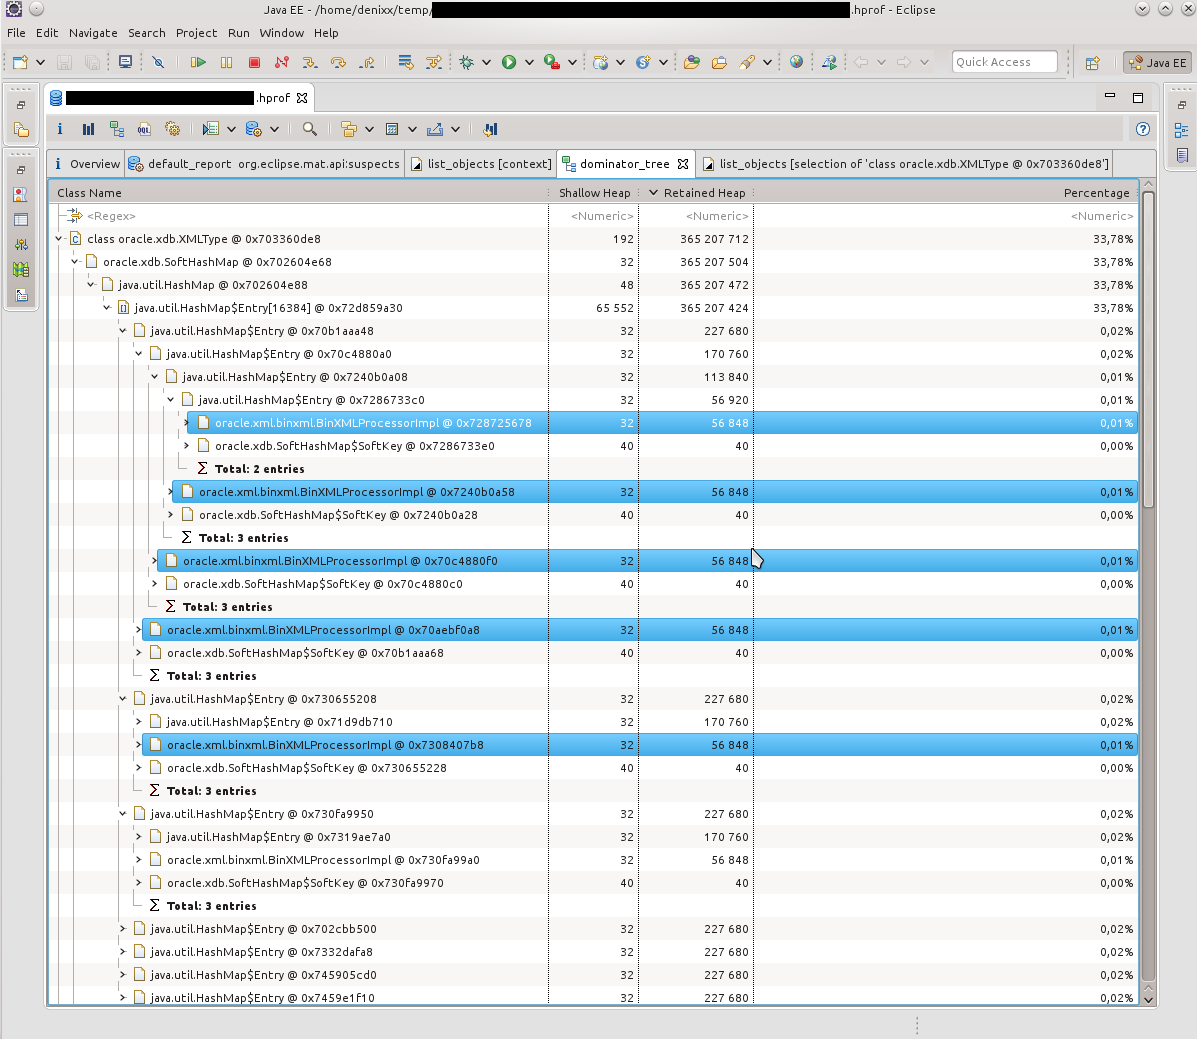
Which, in fact, was confirmed by such a picture. HashMap $ Entry was just a sea, and they more or less cumulated inside oracle.xdb.SoftHashMap.
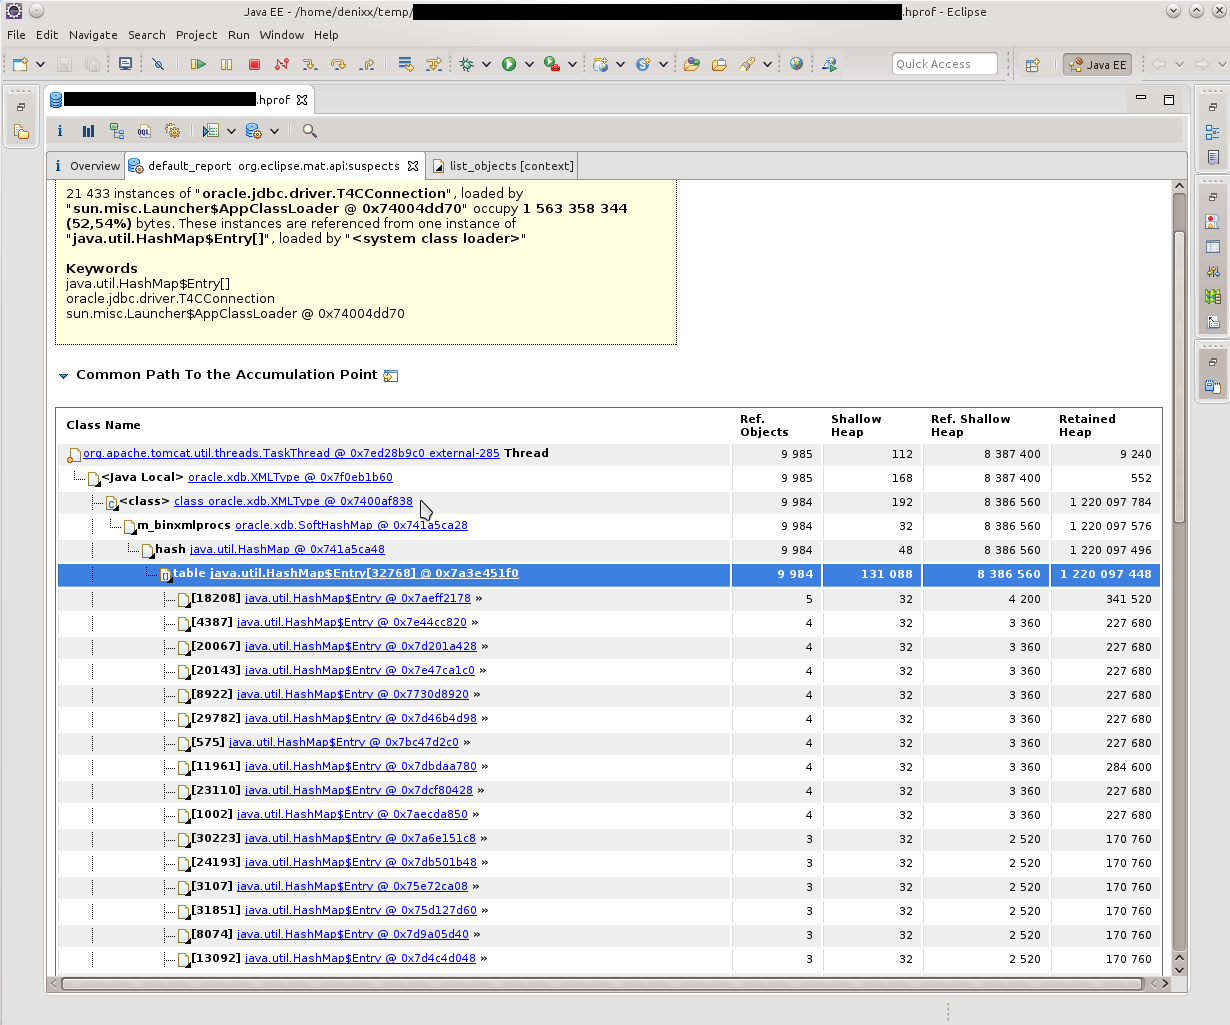
In the next dump, the picture was about the same. According to the Dominator Tree, it was clear that inside each Entry there is a heavy such BinXmlProcessorImpl.
- = - = -
If you take into account that at that moment I was not strong in what xdb is and how it is related to XML, then, somewhat confused, I decided that we should google, maybe someone already knows that with everything this needs to be done. And I didn’t deceive you, at the request “oracle.xdb.SoftHashMap T4CConnection” there were
times piotr.bzdyl.net/2014/07/memory-leak-in-oracle-softhashmap.html
and two leakfromjavaheap.blogspot.com/2014/02/ memory-leak-detection-in-real-life.html
Having affirmed that there is still a jamb at Oracle, the matter remained small.
I asked the DBA to see information on the detected problem:
xxx: Ключевые слова: SoftHashMap XMLType
yyy: Bug 17537657 Memory leak from XDB in oracle.xdb.SoftHashMap
yyy: The fix for 17537657 is first included in
12.2 (Future Release)
12.1.0.2 (Server Patch Set)
12.1.0.1.4 Database Patch Set Update
12.1.0.1 Patch 11 on Windows Platforms
yyy: нда. Описание
Description
When calling either getDocument() using the thin driver, or getBinXMLStream()
using any driver, memory leaks occur in the oracle.xdb.SoftHashMap class.
BinXMLProcessorImpl classes accumulate in this SoftHashMap, but are never
removed.
xxx: Всё так и есть :)
Here is the fix description: updates.oracle.com/Orion/Services/download?type=readme&aru=18629243 (access requires an account in Oracle).
- = - = -
After applying the fix, the instances of our application have been living for a month, and so far without excesses. * tapped wood * * spat on his left shoulder *
Good luck on your quest!