Centralized journaling in MongoDB
From philosophies to equipment.
We are developing an ERP system optimized for high loads . As a result, clustering is present in the system. And each of the cluster nodes maintains its own log. Error messages, various messages on the progress of programs from application developers, and so on are written in the log.
How we implemented journaling - under the cut.
To begin with, according to the precepts of their ancestors, they walked a rake.
We had
- Several clusters
- Each of which has several nodes
- A crowd of developers
- Hundreds of client desktop applications.
- 20-30mb of application and system code with trace and data dump.
All applications via NLog wrote to files.
Logging to a file had only one advantage - it is very easy to administer, and even that is doubtful - log files also need to be rotated.
In all other senses, this is a failure:
So, we needed a logging solution that would allow us to easily search for messages based on various sources, easily understand the message, save objects in an easily readable structured format, and the last - the solution should be easy to install, maintain, and be convenient.
After going through several options (Elasticsearch and other similar mechanisms), we settled on a bunch of SeriLog and MongoDB .
SeriLog perfectly solved the problem of structured event storage. MongoDB is an easy-to-admin base with sufficient popularity, a user-friendly interface and C # support. It is actively developing.
MongoDB was somewhat frustrated by the quality of driver documentation for C #, so I had to tinker with it looking for ad-hoc support. However, it is not critical.
As a result, we got such an interface for viewing events that is available to any developer:
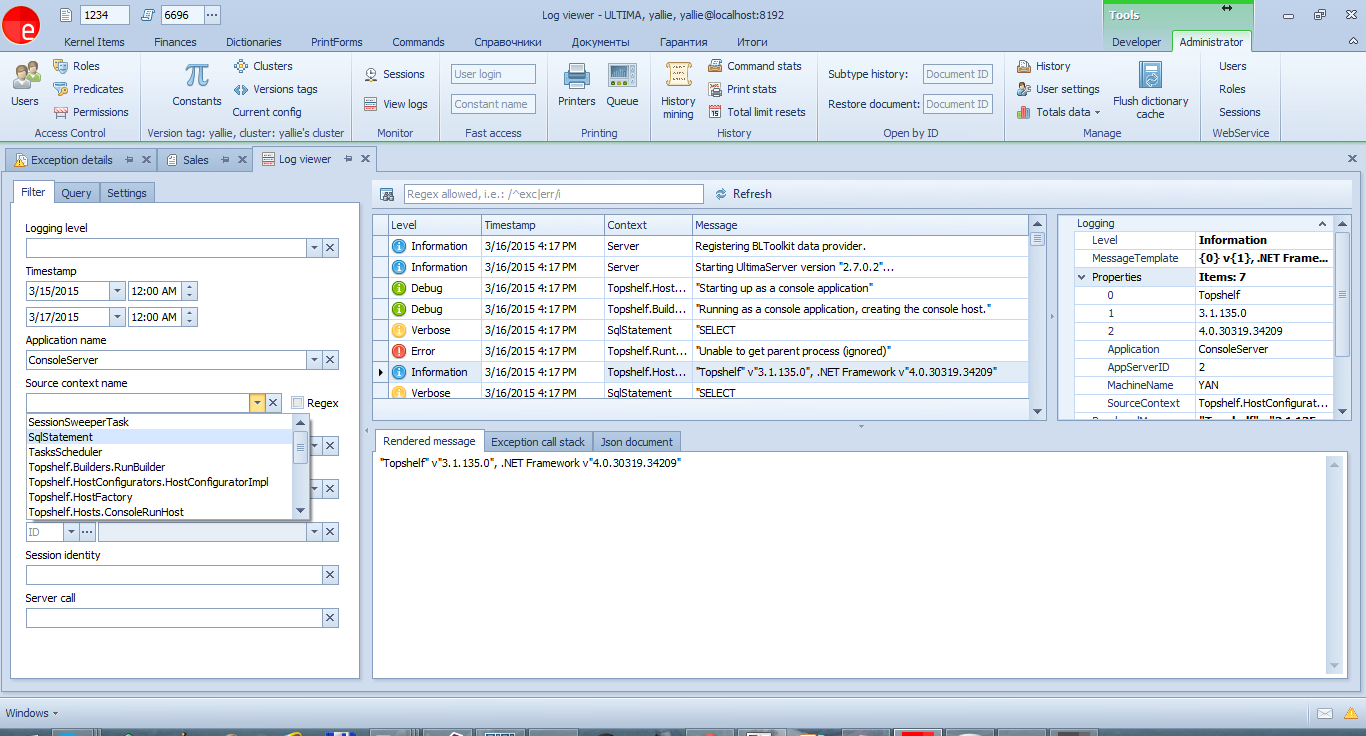
For simple cases, you can use the filter on the first tab. And on the second - a full-fledged query window, where you can write arbitrary queries.
A nice feature is that SeriLog saves the message template, which allows (having the program code in front of your eyes) to find all the relevant messages.
Well, SourceContext allows you to filter by message source - from the server, client, or SQL queries.
The latter is the most convenient means of tracking which SQL queries are executed to the database in order to optimize them.
A small digression.
In general, there are 2 tools for tracing SQL queries in our platform
Back to the above example:
In this case, the entire list of parameters will be attached to the log event,
and in the log it will be possible to find a record about the command execution with a specific value of the
desired parameter.
The example is somewhat contrived, since all SQL queries are logged.
Here is a more real one:
And the type of log entry:
When logging the state of a document or other complex object, it is better not to save its contents in a message:
The message will look like this:
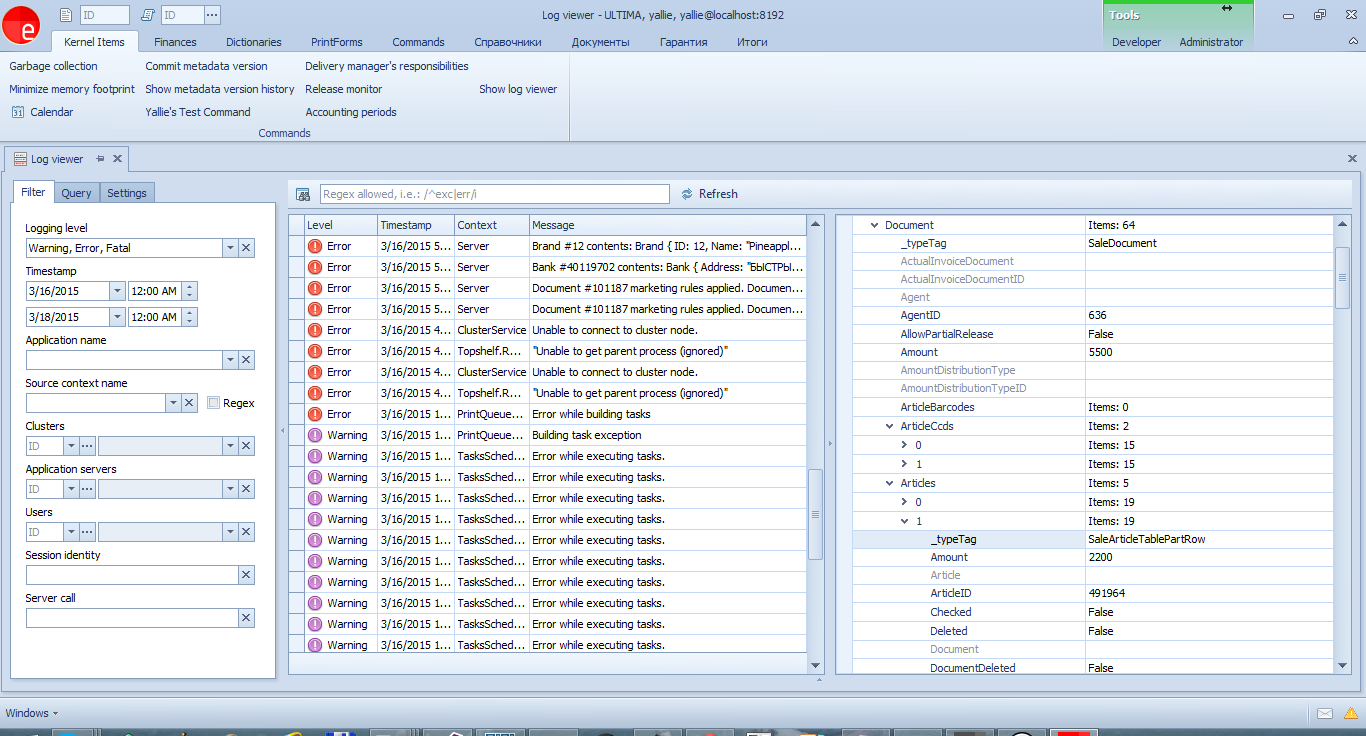
It would be more correct to display only the document number in the message, and transfer the contents in the parameters. All parameters can be viewed in JSON:
or in a structured form in the PropertyGrid:
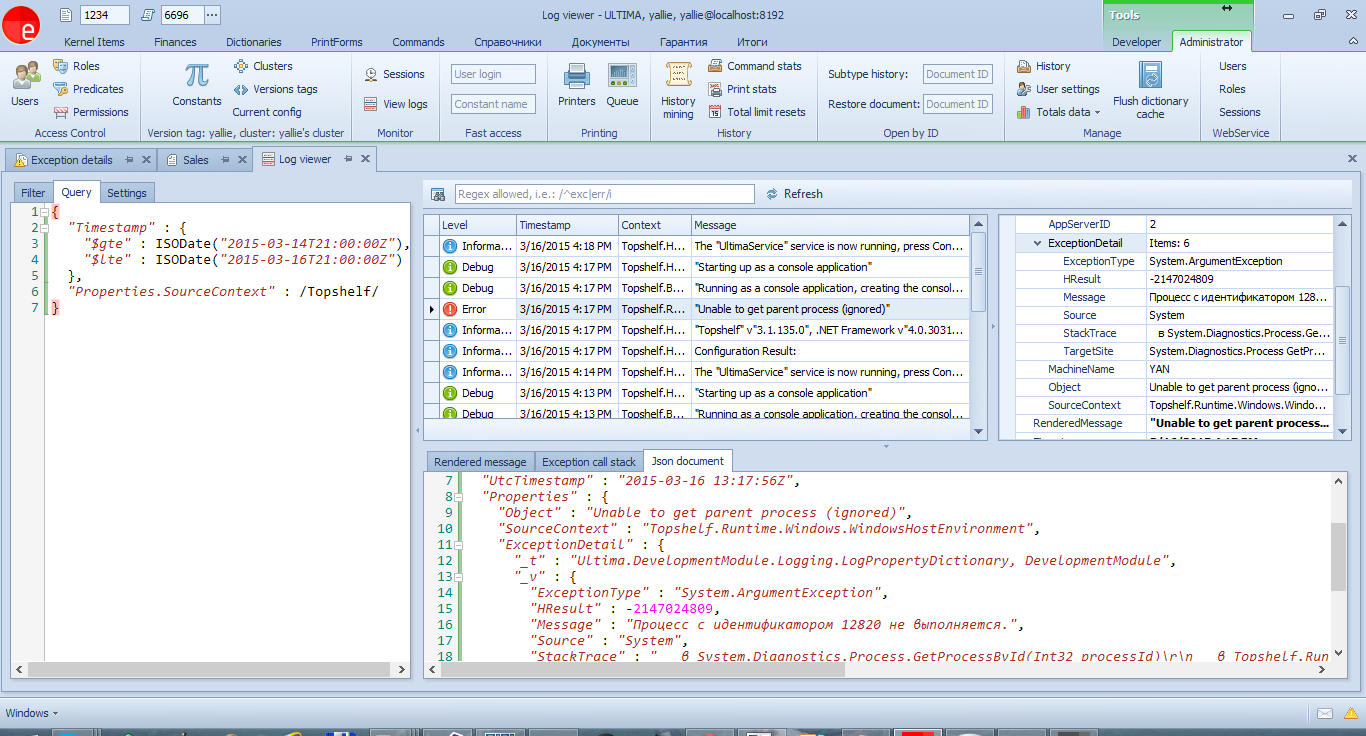
When logging exceptions, their internal structure will be preserved,
including the HResult, CallStack properties and the entire InnerException chain (unfortunately, this
functionality is not built into Serilog, and it had to be implemented independently )
To log an exception, just pass it the first parameter to the
logging methods :
The log analysis tool allows you to view the message structure in the PropertyGrid:
All unhandled exceptions will be logged automatically. By the way, all such incidents should be considered, and if there really is a mistake, corrected. A good tool to improve the quality of the application.
The described functionality is the best we could choose for our tasks. Flexibility, ease of administration, ease of use, saving events with objects in a structured form.
I hope this article helps other desktop application developers choose their own journaling implementation.
We are developing an ERP system optimized for high loads . As a result, clustering is present in the system. And each of the cluster nodes maintains its own log. Error messages, various messages on the progress of programs from application developers, and so on are written in the log.
How we implemented journaling - under the cut.
To begin with, according to the precepts of their ancestors, they walked a rake.
We had
- Several clusters
- Each of which has several nodes
- A crowd of developers
- Hundreds of client desktop applications.
- 20-30mb of application and system code with trace and data dump.
All applications via NLog wrote to files.
Logging to a file had only one advantage - it is very easy to administer, and even that is doubtful - log files also need to be rotated.
In all other senses, this is a failure:
- Structuredness of data
Often, for debugging applications, you need to save this or that object. In addition to him, save clarifying messages and other information. For example:var parameters = new Dictionary<string, object>(); parameters["id"] = id; parameters["limit"] = maxValues; ... Logger.Verbose("Executing command: {SQL} with parameters: {@Parameters}", sqlCommand, parameters); Использовавшийся NLog не позволял сохранять сообщения в удобном формате, так что разработчики писали как вздумается. - Availability of information.
Logging in files makes iterate through the log files on all servers in search of bits of information. Multiplied by the number of developers, this leads to the fact that everyone has access to all servers and becomes a permanent headache for administrators.
So, we needed a logging solution that would allow us to easily search for messages based on various sources, easily understand the message, save objects in an easily readable structured format, and the last - the solution should be easy to install, maintain, and be convenient.
After going through several options (Elasticsearch and other similar mechanisms), we settled on a bunch of SeriLog and MongoDB .
SeriLog perfectly solved the problem of structured event storage. MongoDB is an easy-to-admin base with sufficient popularity, a user-friendly interface and C # support. It is actively developing.
MongoDB was somewhat frustrated by the quality of driver documentation for C #, so I had to tinker with it looking for ad-hoc support. However, it is not critical.
As a result, we got such an interface for viewing events that is available to any developer:
For simple cases, you can use the filter on the first tab. And on the second - a full-fledged query window, where you can write arbitrary queries.
A nice feature is that SeriLog saves the message template, which allows (having the program code in front of your eyes) to find all the relevant messages.
Well, SourceContext allows you to filter by message source - from the server, client, or SQL queries.
The latter is the most convenient means of tracking which SQL queries are executed to the database in order to optimize them.
A small digression.
In general, there are 2 tools for tracing SQL queries in our platform
- Tracing sessions online
Messages will be sent online in the appropriate window. You can connect to any session in the cluster.
It looks like this: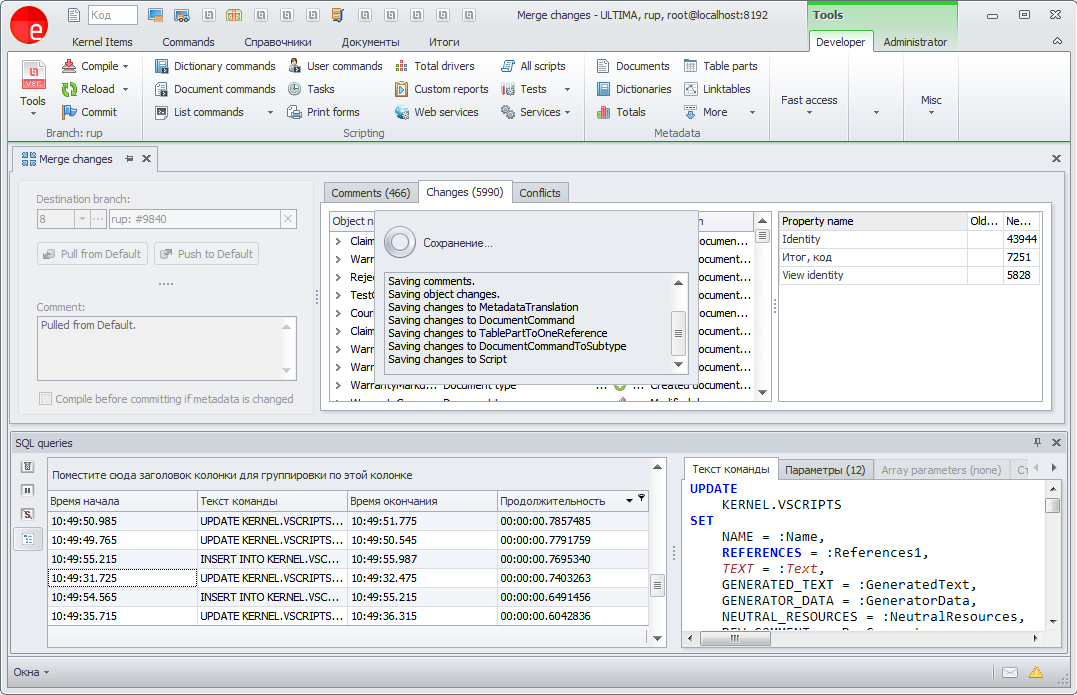
on the second tab, all parameters are listed in the label: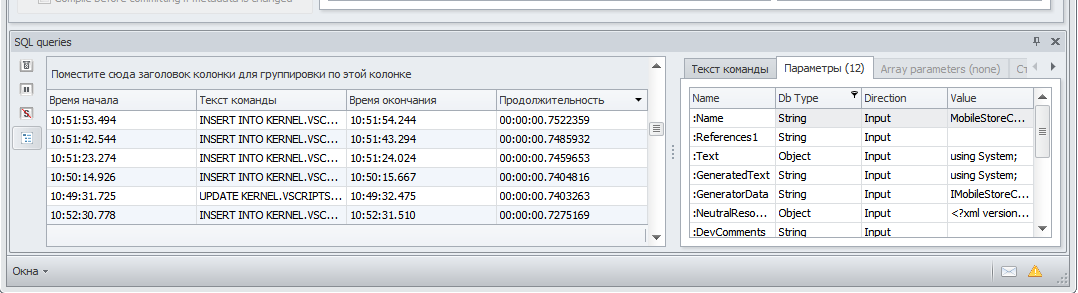
- Centralized log with all SQL queries along with parameters
All messages are available in the centralized log viewer in SourceContext SqlStatement
Back to the above example:
var parameters = new Dictionary<string, object>();
parameters["id"] = id;
parameters["limit"] = maxValues;
...
Logger.Verbose("Executing command: {SQL} with parameters: {@Parameters}",     sqlCommand, parameters);
In this case, the entire list of parameters will be attached to the log event,
and in the log it will be possible to find a record about the command execution with a specific value of the
desired parameter.
The example is somewhat contrived, since all SQL queries are logged.
Here is a more real one:
Logger.Debug("Brand #{BrandID} contents: {@Brand}", brand.ID, brand);
And the type of log entry:
Brand#12contents: Brand { ID: 12, Name: "Pineapple" }
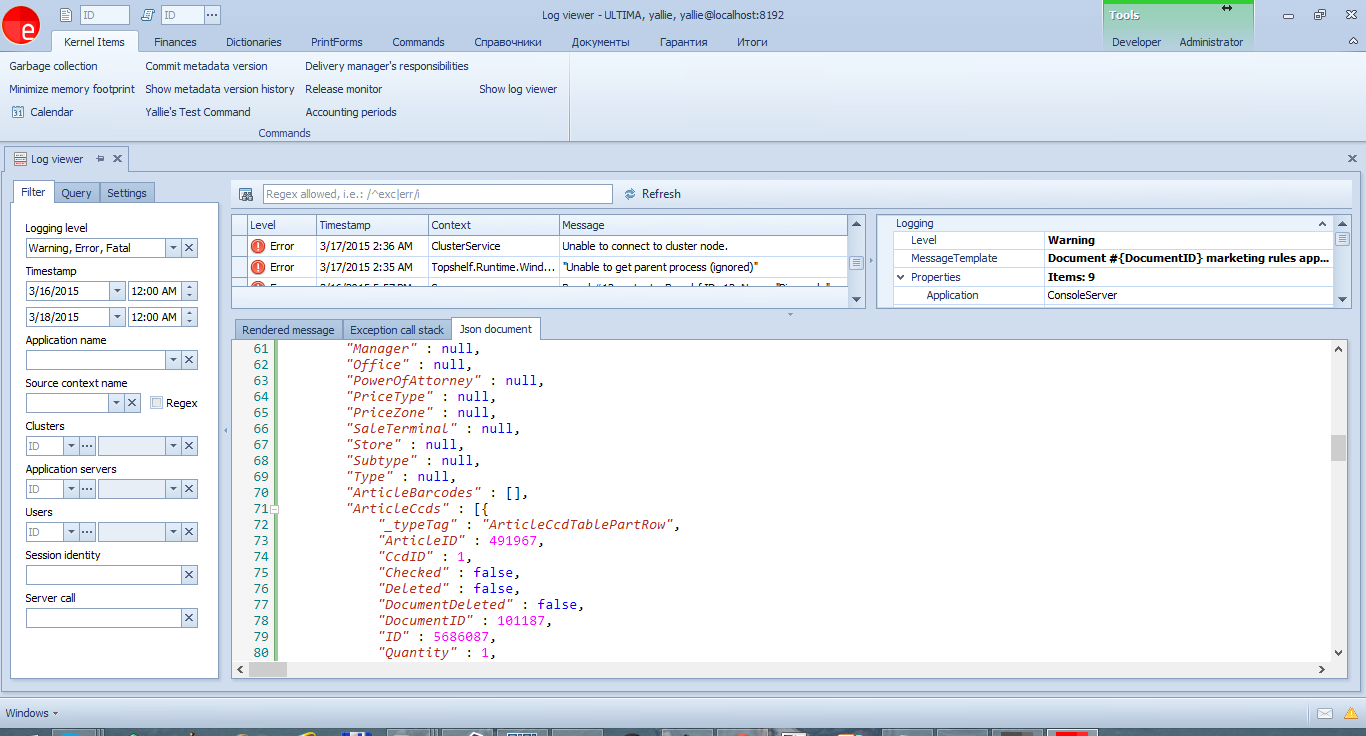
When logging the state of a document or other complex object, it is better not to save its contents in a message:
Logger.Debug("Document #{DocumentID} is saved. Document contents: {@Document}", doc.ID, doc);
....
The message will look like this:
Document #101187is saved. Document contents: SaleDocument { ActualInvoiceDocumentID: null, AgentID: 636, AllowPartialRelease: False, Amount: 5500, AmountDistributionTypeID: null, ArticlesQuantity: 3, ClientDueOnDelivery: 5500, Comments: "noreply", Convertation: null, CreationDate: 02/06/201522:21:53, CreatorID: 7, CustomerSupplyContractID: null, DeadDate: 02/11/201522:21:53, Deleted: False, DeliveryActive: False, Description: "Sales (Picking) #101187, 2/6/2015"
...
50kb of JSON follows
It would be more correct to display only the document number in the message, and transfer the contents in the parameters. All parameters can be viewed in JSON:
or in a structured form in the PropertyGrid:
When logging exceptions, their internal structure will be preserved,
including the HResult, CallStack properties and the entire InnerException chain (unfortunately, this
functionality is not built into Serilog, and it had to be implemented independently )
To log an exception, just pass it the first parameter to the
logging methods :
Logger.Error(ex, "Cannot executeuser task: {Message}", ex.Message);
The log analysis tool allows you to view the message structure in the PropertyGrid:
All unhandled exceptions will be logged automatically. By the way, all such incidents should be considered, and if there really is a mistake, corrected. A good tool to improve the quality of the application.
Finally.
The described functionality is the best we could choose for our tasks. Flexibility, ease of administration, ease of use, saving events with objects in a structured form.
I hope this article helps other desktop application developers choose their own journaling implementation.