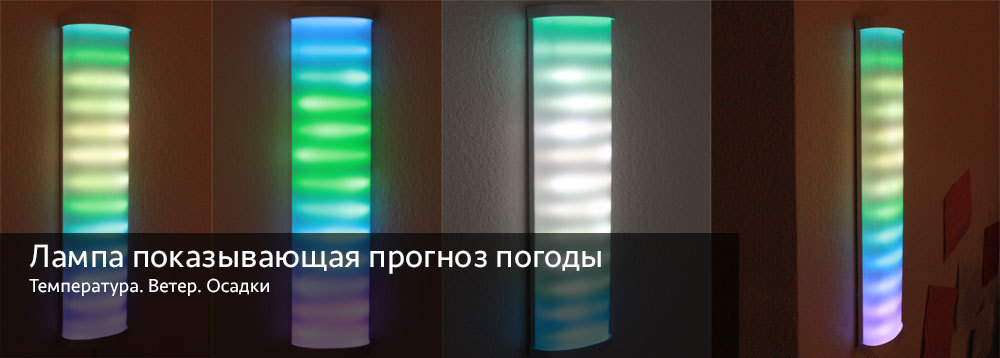
Weather forecast lamp
Many of us, before leaving the house in the morning, check the weather forecast for the coming day. I always used my smartphone for this and, once, I thought, why not make this process simpler and more convenient. So, the idea came up with the idea of creating a room lamp, which would be able to show the weather forecast in my area, as well as warn of possible precipitation and wind speed.
Under the cutscene, videos and images demonstrate the operation of this lamp and detailed instructions for its creation.
The lamp can show the weather forecast for 14 hours ahead. Technically, there are 14 horizontal levels inside the lamp (RGB LED strips of 20 LEDs each). The first level below is the weather that will be at the beginning of the next hour. Each next level is plus 1 hour. Horizontal movement at each level is the speed of the wind. There is also a rain effect - the parts at the beginning and end of each level smoothly blinking in all colors.
Here it should be warned that all the photos and videos in this article were made by long torment, since the lamp shines very strongly, and I am not a very experienced photographer and my DSLR just did not want to shoot the way it really is. I honestly tried a lot of times but never reached the same picture as in reality.
You can watch another video of the lamp without a cover and a video demonstrating the display of precipitation (the edges of the strips glowing with all colors).
First, let's try to formulate the requirements:
After some thought, I decided to stop on a rectangular lamp in which there will be 12 horizontal levels with 20 LEDs in each. This will allow us to display the weather forecast for 12 hours ahead. The color of each level depends on the air temperature at this time. At the same time, each level will have a sufficient number of LEDs to display various effects, such as rain, wind or thunder. Later, the number of levels was increased to 14, as there were extra LEDs.
First of all, you need to decide on the platform: a real-time microcontroller like Arduino or a full-fledged computer, such as the Raspberry Pi with the operating system on board. Each of these options has its pros and cons. At first glance, Arduino is ideally suited for this project, if only because we don’t have to wait 10 seconds to load the OS on the Raspberry Pi. But even if you use Arduino, an instant cold start will not work - there will still be a delay in initializing the wifi shield and requesting the weather on the server. Also, I was a little confused by the question about the simultaneous operation of the wifi shield (when requesting a forecast for the server) and the operation of the LED strip.
In turn, if you use the Raspberry Pi, we have only one drawback - boot time.
It was decided to use the Raspberry Pi with a WiFi USB dongle EdiMax. This dongle was used by me on other projects and has proven itself quite well.
Next, you need to find suitable light sources. In a rough estimate, we need at least about 240 LEDs (12 levels of 20 LEDs each). The option in which they all have to be soldered one at a time was not even considered. Our choice is not big: either LED panels or LED strip. The panels are perfect for those who want a small lamp without various curvatures on the surface. I settled on the LED strip, because I wanted to make a medium-sized lamp.
Thus, a 2 meter RGB LED strip was ordered with a pixel density of 144 pieces per meter. This tape has addressable LEDs (digitally-addressable type of LED strip), which means that we can form a signal in such a way that each LED receives its own data and displays the color that it should. The WS2811 chip, which is located in each LED on the tape, is responsible for this. Since there are 288 LEDs in the tape, it was decided to use them to the maximum and make 14 levels of 20 LEDs each)
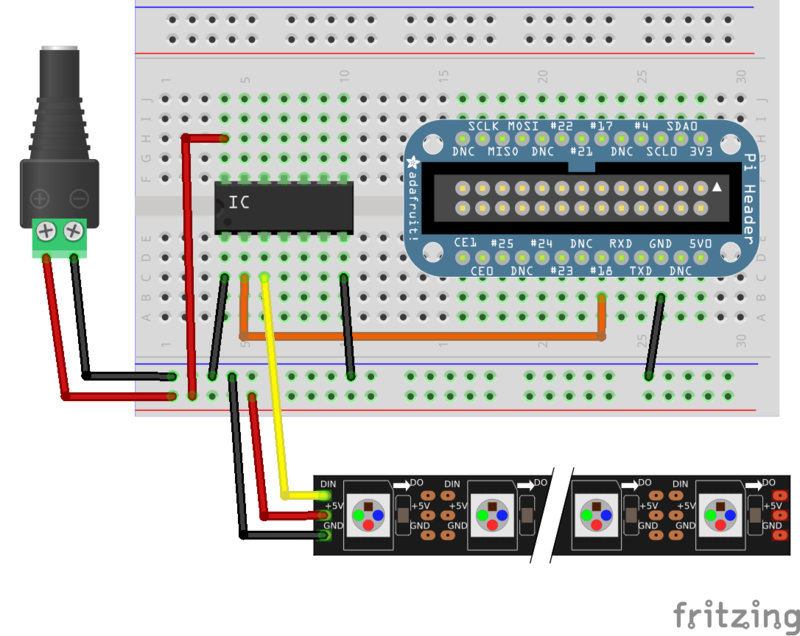
It should be noted that the Raspberry Pi gives out only 3.3 volts on its GPIO ports, but for the tape we need a 5 volt control signal . Thus, we need a voltage converter (level converter chip). I used 74AHCT125.
Connection diagram (was taken fromAdafruit tutorial ):
A donor lamp with a size of 60 by 20 cm was looked after and bought at a nearby store. The lamp was bought with the expectation that we would need to place a power supply for the LED strip there. Since we got 280 RGB LEDs + Raspberry Pi, a 5 volt 10 amp block was ordered in a fairly compact package.
The time has come to place all this in a lamp. With the power supply, the Raspberry Pi everything was clear. You can’t say about how to fix 14 segments with LEDs, which previously had to be soldered together. The LEDs should be at a certain distance from the matte cover, otherwise they would be visible and the light would be too harsh.
The original idea was to use aluminum strips and stick pieces of tape to them. But having made one frame, I quickly realized that it would take too much time. After that, I decided to print frames on a 3D printer. If you have access to a laser engraver, you will do it even faster. In extreme cases, you can do everything by hand - by cutting out of wood or cardboard (after this, gluing the layers many times).
Frame Printing:
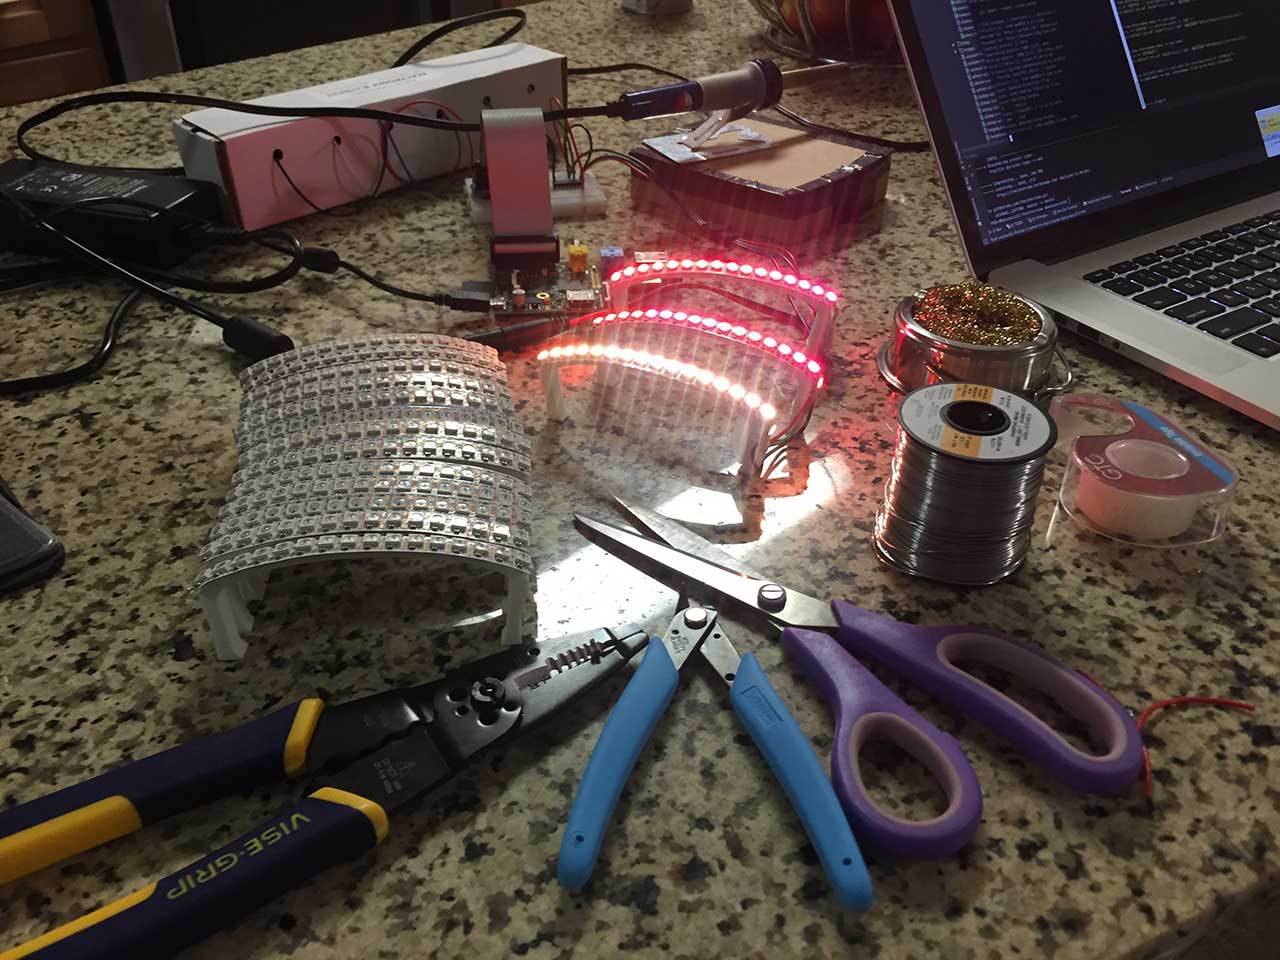
The first tests of the tape on the framework:
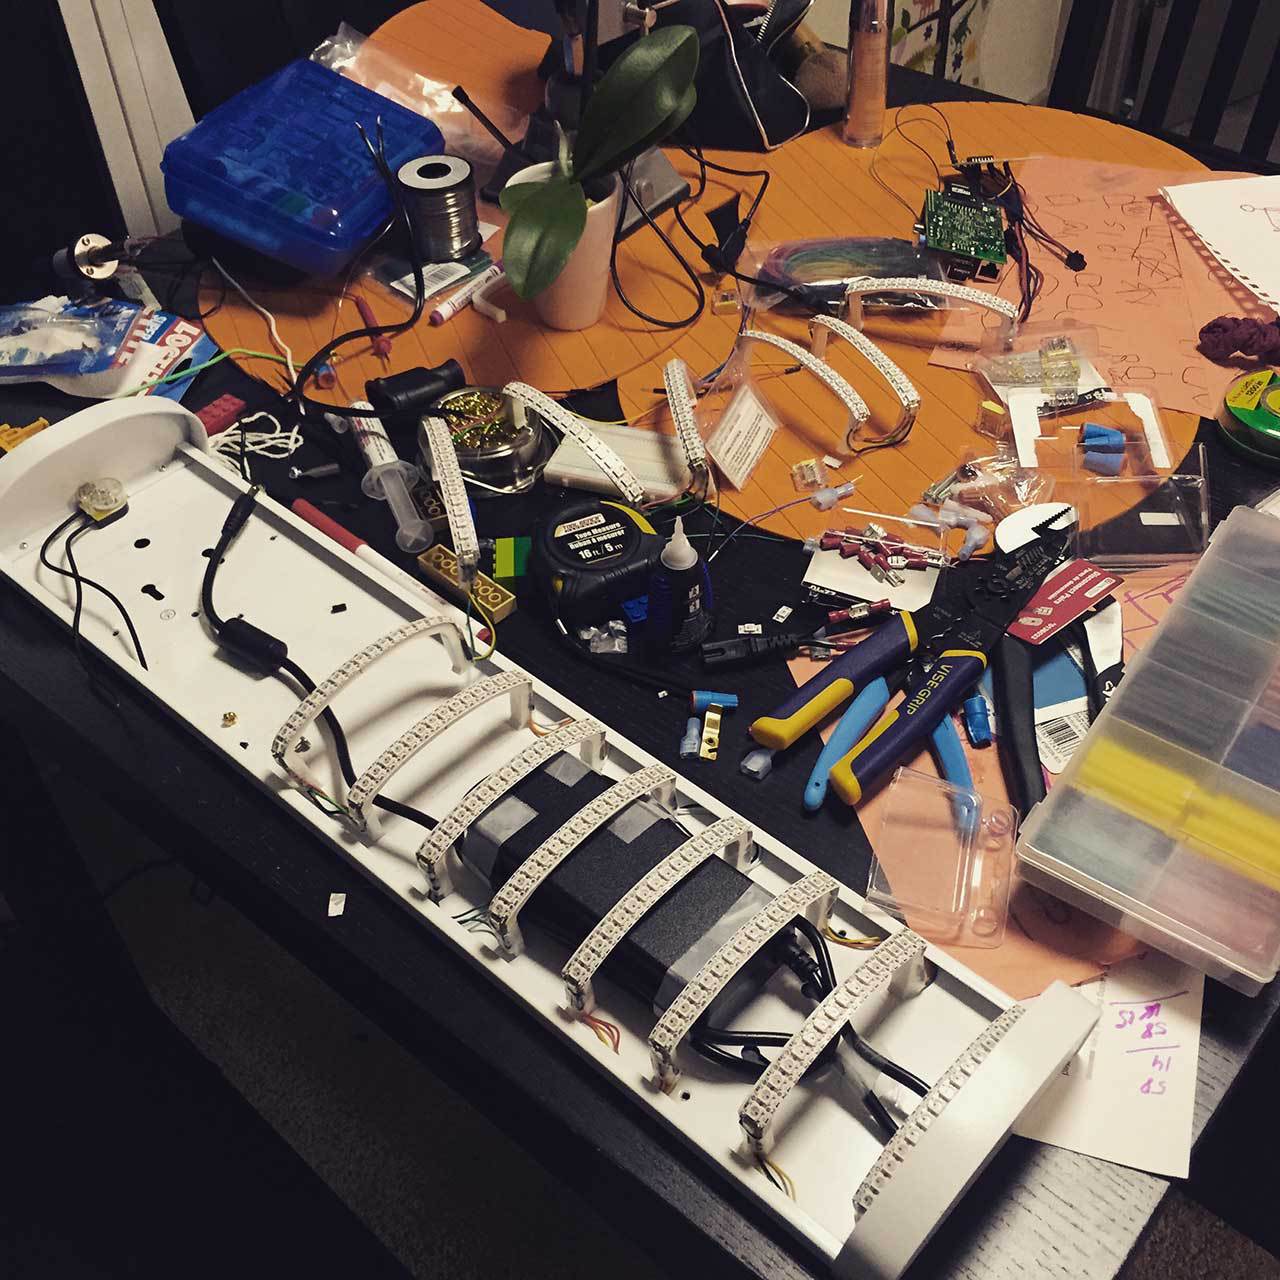
So we got all the necessary components and it was the turn of the assembly. The LED strip was cut into pieces of 20 LEDs. The pieces were soldered together and glued to the frames. Frames, in turn, were glued to the body. The power supply, all wiring, and the Raspberry Pi were placed in the space between the frames and the chassis.
Lamp Assembly Process:
Result ( Higher Resolution ):
For the lamp to work, a service is required to obtain a weather forecast. There are a large number of free and shareware services for this. For example openweathermap.org or forecast.io . All of them have their own limitations or some specific features.
One of my main criteria was the ability to get hourly weather forecasts for the next 12+ hours. Unfortunately, openweathermap can only return weather forecasts for 3 hours free of charge. I also did not like the speed of this service, although it was not at all critical given that we are not going to update the weather forecast more than once every half an hour.
At the same time, the forecast is not entirely free. I was pleased with the speed of work and data granularity. It allowed me to get all the data that I needed (temperature, wind speed and rainfall) 12 hours in advance and even more with one request. The number of requests that you can make is limited to 1000 per day in a free mode, but this completely fit into my requirements. In the end, I chose this resource, frankly, just relying on my intuition.
It was necessary to decide how we would receive the data: through an intermediate resource or directly from forecast.io. The JSON file that the forecast.io service returned returned about 40 kilobytes for my location, which seemed redundant to me. I needed only 3 values for each of 12 hours. As a result, I decided to create my own small service for 2 reasons - to minimize the amount of data sent to the lamp and to ensure future extensibility if I have to change the data source or change the provider in the future. Given that we only need 3 values (temperature, wind speed and rainfall) for each hour, a total of 168 bytes is required (14 * 3 * size int = 4). Also, my service will allow you to set the coordinates of the area and the minimum and maximum temperatures for a given area,
I wrote a Java servlet for working with forecast.io that can cache values between requests and, in case of too frequent requests, returns a value from the cache (in order not to exceed the limit of 1000 free requests per day). We request a new forecast only once every 5 minutes. The coordinates of the terrain as well as the API key for forecast.io are taken from the system servlet, so if we need to change the terrain, we can do this from outside the web application.
It is necessary to explain what 5 properties mean, the values of which we request in runtime:
AL_API_KEY - Secret key of the developer forecast.io
AL_LAT, AL_LON - Coordinates of the area
AL_MAX_TEMP, AL_MIN_TEMP - The values of the minimum and maximum temperatures for this area. This is necessary so as not to waste some areas in the color range used: let's say in my area (Texas, USA) - the temperature never drops below zero, and I would like the violet color (the lowest in our palette) to indicate 0 and not -25, as one could set for Moscow. Thus, our service does not return the actual temperature - it returns one hundredth of a percent between AL_MIN_TEMP & AL_MAX_TEMP.
The source code of the web application along with the maven assembly file is available in the github.com/manusovich/aladdin-service repository.
Next, we need any hosting for our Java web application. I took advantage of my favorite heroku , but you can use any other. The repository already contains the file necessary to run the application in the heroku environment with the name Procfile.
So if we use heroku, all we need to do is:
Now our servlet can be executed by opening the https://aladdin-service.herokuapp.com/forecast link in the browser . This will return a file with a weather forecast (168 bytes in size) for a given area (property for the application in heroku)
First of all, you need to decide how we will send a signal to our LED strip. The tape uses the WS2811 chip to control the LED. After a short search, I came across a tutorial from Adafruit - learn.adafruit.com/neopixels-on-raspberry-pi , where I found a mention of the rpi_ws281x library , which just allows you to generate a signal for a tape based on WS281x chips.
I forked the library into my repository and added the necessary code to main.c (see below in the lamp controller section) to simplify development to a minimum.
A little digression should be made and how I usually develop code for my projects based on Raspberry Pi. I found code editing via ssh not at all convenient. Copy code permanently through ssh too. So I just create a GitHub repository, upload all the code there and use my favorite IDE for development. On the Raspberry Pi side, I create a shell script that tries to get changes from the repository once every 10 seconds. If they are, then the script stops the execution of the program, downloads updates, compiles everything and launches the program. The script is hung at startup. This allows you to develop code remotely and at the same time speeds up the process of checking for changes on the device. But at the same time it loads the wifi network. When software development is complete,
The algorithm in this case is as follows:
This script updates the forecast, launches the application, as well as updates the weather forecast every 10 minutes and checks the project repository for changes every 60 minutes. If there are changes, they are taken from the repository, compiled and launched.
Some points should be clarified:
Now let's look at the code for controlling LEDs on an LED strip. This code is located in the main.c file and is an endless loop and a set of procedures for changing the color of LEDs.
The main method of the program contains the initialization of the rpi_ws281x library for working with LED strip and starts an endless loop for rendering states:
The update_forecast method reads the current weather forecast from the file / home / pi / rpi_ws281x / forecast
The matrix_render_forecast method fills the matrix with the current weather forecast values. In doing so, we use a palette of 23 colors taken from paletton.com :
The matrix_fade method damps any color fluctuations from the predicted temperature.
The matrix_render_wind method draws an excitation that moves horizontally forward and backward at a speed that is equal to wind speed * by a factor.
The matrix_render_precip method draws precipitation along the edges of the levels. He needs a general counter, since the total refresh rate is 30 frames per second and it turned out very quickly in order to change colors. Therefore, we do this only 15 times per second.
All rendering goes to the XRGB matrix [WIDTH] [HEIGHT]. We need the XRGB structure in order to store floating point numbers instead of integers for colors. This allows us to increase the smoothness of transitions and directly convert to RGB we do in the matrix_render method
When launched, the program displays the current forecast value (temperature, wind and precipitation) in the console. It should be noted that the temperature value is the basis point (one hundredth of a percent).
You can consider the resulting product as a platform for displaying anything. At your disposal there are about 300 independent LEDs and you decide what can be displayed there. For example, you can organize the display of assembly states on a continuous integration server or simply make an unusual lamp that will play with rainbow colors as in the next video.
Power supply unit 5 volt 10 amperes - 25 $
2 meters RGB tape (144 LEDs per meter) - 78 $
Raspberry Pi - 30 $
Edimax Wifi USB - 8 $
3D frame printing for LED strip - 15 $ per PLA plastic
Donor lamp - 35 $
In total, the total cost of the product was about 200 US dollars for manufacturing at home.
I hope this article will be useful to you. If you have any questions, feel free to ask in the comments.
Under the cutscene, videos and images demonstrate the operation of this lamp and detailed instructions for its creation.
Work demonstration
The lamp can show the weather forecast for 14 hours ahead. Technically, there are 14 horizontal levels inside the lamp (RGB LED strips of 20 LEDs each). The first level below is the weather that will be at the beginning of the next hour. Each next level is plus 1 hour. Horizontal movement at each level is the speed of the wind. There is also a rain effect - the parts at the beginning and end of each level smoothly blinking in all colors.
Here it should be warned that all the photos and videos in this article were made by long torment, since the lamp shines very strongly, and I am not a very experienced photographer and my DSLR just did not want to shoot the way it really is. I honestly tried a lot of times but never reached the same picture as in reality.
You can watch another video of the lamp without a cover and a video demonstrating the display of precipitation (the edges of the strips glowing with all colors).
Requirements and Design
First, let's try to formulate the requirements:
- Permanent internet connection. We will need to receive a weather forecast from the Internet
- Autonomy. The lamp should not be dependent on other devices
- The ability to display various weather data (temperature, rain, thunderstorm, wind)
After some thought, I decided to stop on a rectangular lamp in which there will be 12 horizontal levels with 20 LEDs in each. This will allow us to display the weather forecast for 12 hours ahead. The color of each level depends on the air temperature at this time. At the same time, each level will have a sufficient number of LEDs to display various effects, such as rain, wind or thunder. Later, the number of levels was increased to 14, as there were extra LEDs.
Iron
First of all, you need to decide on the platform: a real-time microcontroller like Arduino or a full-fledged computer, such as the Raspberry Pi with the operating system on board. Each of these options has its pros and cons. At first glance, Arduino is ideally suited for this project, if only because we don’t have to wait 10 seconds to load the OS on the Raspberry Pi. But even if you use Arduino, an instant cold start will not work - there will still be a delay in initializing the wifi shield and requesting the weather on the server. Also, I was a little confused by the question about the simultaneous operation of the wifi shield (when requesting a forecast for the server) and the operation of the LED strip.
In turn, if you use the Raspberry Pi, we have only one drawback - boot time.
It was decided to use the Raspberry Pi with a WiFi USB dongle EdiMax. This dongle was used by me on other projects and has proven itself quite well.
Next, you need to find suitable light sources. In a rough estimate, we need at least about 240 LEDs (12 levels of 20 LEDs each). The option in which they all have to be soldered one at a time was not even considered. Our choice is not big: either LED panels or LED strip. The panels are perfect for those who want a small lamp without various curvatures on the surface. I settled on the LED strip, because I wanted to make a medium-sized lamp.
Thus, a 2 meter RGB LED strip was ordered with a pixel density of 144 pieces per meter. This tape has addressable LEDs (digitally-addressable type of LED strip), which means that we can form a signal in such a way that each LED receives its own data and displays the color that it should. The WS2811 chip, which is located in each LED on the tape, is responsible for this. Since there are 288 LEDs in the tape, it was decided to use them to the maximum and make 14 levels of 20 LEDs each)
It should be noted that the Raspberry Pi gives out only 3.3 volts on its GPIO ports, but for the tape we need a 5 volt control signal . Thus, we need a voltage converter (level converter chip). I used 74AHCT125.
Connection diagram (was taken fromAdafruit tutorial ):
A donor lamp with a size of 60 by 20 cm was looked after and bought at a nearby store. The lamp was bought with the expectation that we would need to place a power supply for the LED strip there. Since we got 280 RGB LEDs + Raspberry Pi, a 5 volt 10 amp block was ordered in a fairly compact package.
The time has come to place all this in a lamp. With the power supply, the Raspberry Pi everything was clear. You can’t say about how to fix 14 segments with LEDs, which previously had to be soldered together. The LEDs should be at a certain distance from the matte cover, otherwise they would be visible and the light would be too harsh.
The original idea was to use aluminum strips and stick pieces of tape to them. But having made one frame, I quickly realized that it would take too much time. After that, I decided to print frames on a 3D printer. If you have access to a laser engraver, you will do it even faster. In extreme cases, you can do everything by hand - by cutting out of wood or cardboard (after this, gluing the layers many times).
Frame Printing:
The first tests of the tape on the framework:
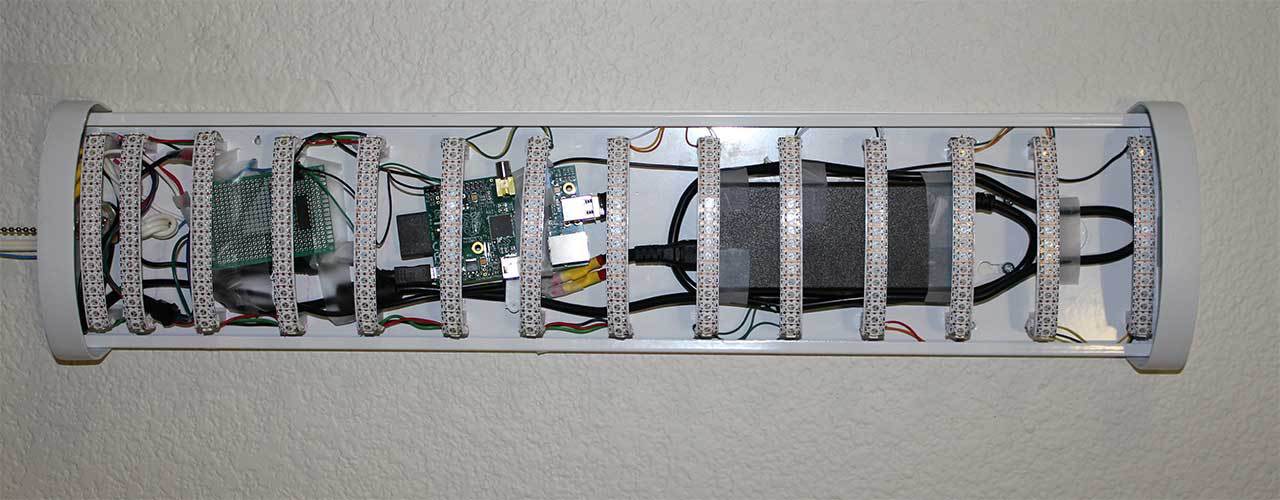
So we got all the necessary components and it was the turn of the assembly. The LED strip was cut into pieces of 20 LEDs. The pieces were soldered together and glued to the frames. Frames, in turn, were glued to the body. The power supply, all wiring, and the Raspberry Pi were placed in the space between the frames and the chassis.
Lamp Assembly Process:
Result ( Higher Resolution ):
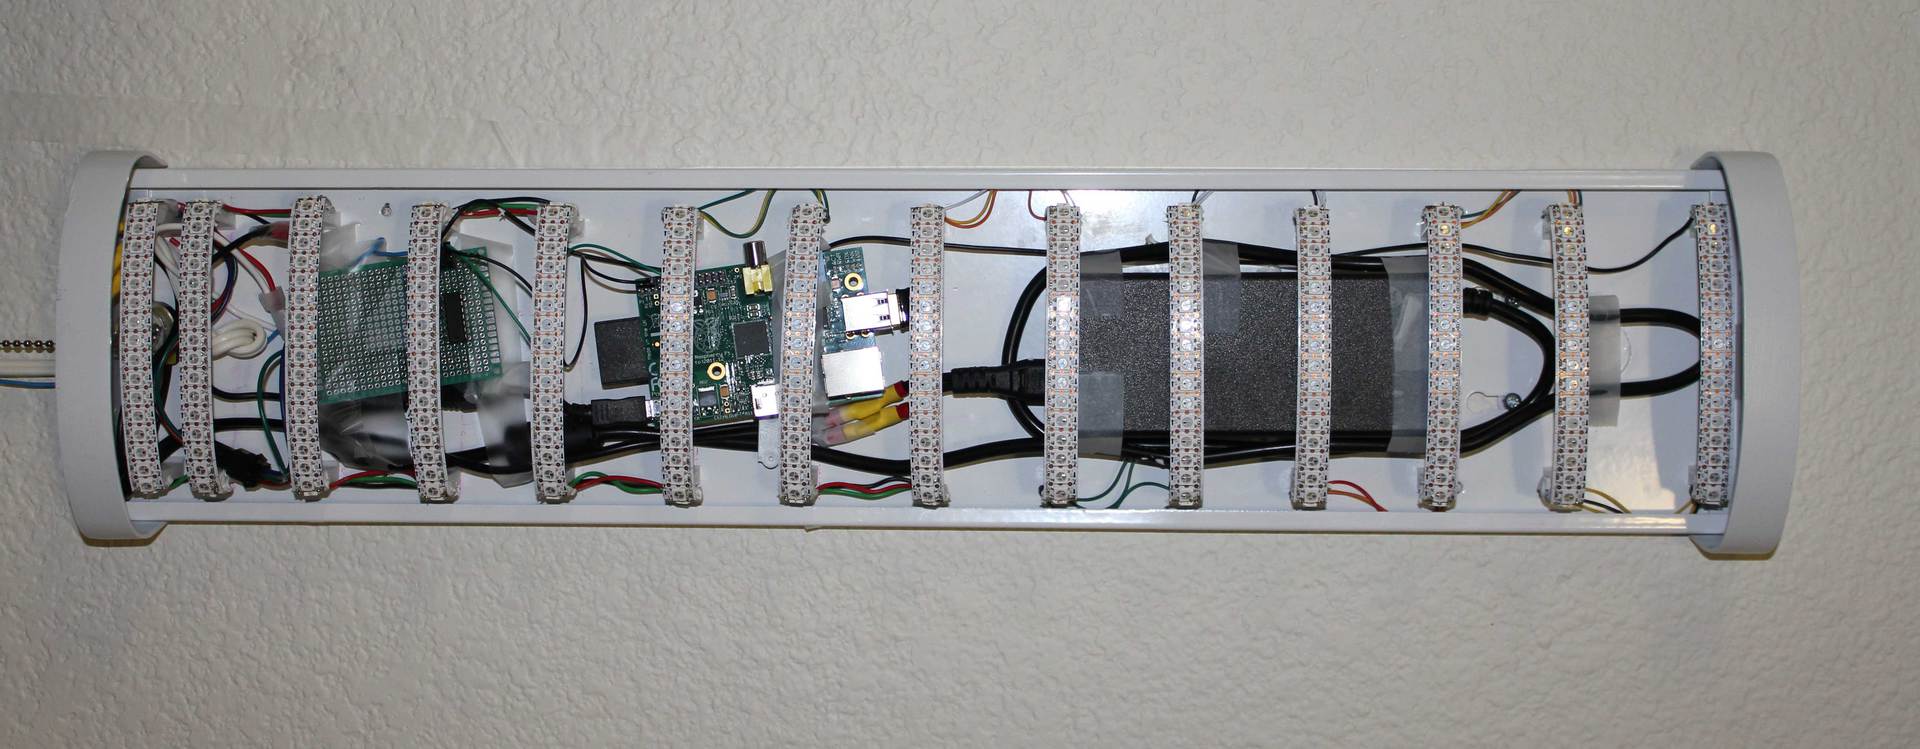
Service for obtaining a weather forecast
For the lamp to work, a service is required to obtain a weather forecast. There are a large number of free and shareware services for this. For example openweathermap.org or forecast.io . All of them have their own limitations or some specific features.
One of my main criteria was the ability to get hourly weather forecasts for the next 12+ hours. Unfortunately, openweathermap can only return weather forecasts for 3 hours free of charge. I also did not like the speed of this service, although it was not at all critical given that we are not going to update the weather forecast more than once every half an hour.
At the same time, the forecast is not entirely free. I was pleased with the speed of work and data granularity. It allowed me to get all the data that I needed (temperature, wind speed and rainfall) 12 hours in advance and even more with one request. The number of requests that you can make is limited to 1000 per day in a free mode, but this completely fit into my requirements. In the end, I chose this resource, frankly, just relying on my intuition.
It was necessary to decide how we would receive the data: through an intermediate resource or directly from forecast.io. The JSON file that the forecast.io service returned returned about 40 kilobytes for my location, which seemed redundant to me. I needed only 3 values for each of 12 hours. As a result, I decided to create my own small service for 2 reasons - to minimize the amount of data sent to the lamp and to ensure future extensibility if I have to change the data source or change the provider in the future. Given that we only need 3 values (temperature, wind speed and rainfall) for each hour, a total of 168 bytes is required (14 * 3 * size int = 4). Also, my service will allow you to set the coordinates of the area and the minimum and maximum temperatures for a given area,
I wrote a Java servlet for working with forecast.io that can cache values between requests and, in case of too frequent requests, returns a value from the cache (in order not to exceed the limit of 1000 free requests per day). We request a new forecast only once every 5 minutes. The coordinates of the terrain as well as the API key for forecast.io are taken from the system servlet, so if we need to change the terrain, we can do this from outside the web application.
Servlet code
public class ForecastServlet extends HttpServlet {
    private static final String API_KEY = System.getenv("AL_API_KEY");
    private static final int REQUEST_PERIOD = 5 * 60 * 1000;
    private static final int START_HOUR = 0;
    private static final int END_HOUR = 14;
    private static final int DATA_SIZE = 3 * 4 * (END_HOUR - START_HOUR);
    private static final int TEMP_MULTIPLY = 100;
    private static final int WIND_MULTIPLY = 100;
    private static final int PRECIP_MULTIPLY = 1000;
    private final String mutex = "";
    private final ByteArrayOutputStream data = new ByteArrayOutputStream(DATA_SIZE);
    private long lastRequestTime;
    @Override
    protected void doGet(HttpServletRequest req, HttpServletResponse response) throws ServletException, IOException {
        synchronized (mutex) {
            if ((System.currentTimeMillis() - lastRequestTime) > REQUEST_PERIOD) {
                try {
                    updateForecast();
                } catch (IOException e) {
                    e.printStackTrace();
                }
            }
            response.setHeader("Content-Type", "application/octet-stream");
            response.setHeader("Content-Length", "" + data.size());
            response.getOutputStream().write(data.toByteArray());
            response.getOutputStream().flush();
            response.getOutputStream().close();
            lastRequestTime = System.currentTimeMillis();
        }
    }
    private void updateForecast() throws IOException {
        int maxTemp = Integer.valueOf(System.getenv("AL_MAX_TEMP")) * TEMP_MULTIPLY;
        int minTemp = Integer.valueOf(System.getenv("AL_MIN_TEMP")) * TEMP_MULTIPLY;
        BufferedReader reader = null;
        try {
            String urlTemplate = "https://api.forecast.io/forecast/%s/%s,%s";
            URL url = new URL(String.format(urlTemplate, API_KEY, System.getenv("AL_LAT"), System.getenv("AL_LON")));
            InputStreamReader streamReader = new InputStreamReader(url.openStream());
            reader = new BufferedReader(streamReader);
            JSONParser jsonParser = new JSONParser();
            try {
                JSONObject jsonObject = (JSONObject) jsonParser.parse(reader);
                JSONArray hourly = (JSONArray) ((JSONObject) jsonObject.get("hourly")).get("data");
                for (int i = START_HOUR; i < END_HOUR; i++) {
                    JSONObject hour = (JSONObject) hourly.get(i);
                    int temperature = safeIntFromJson(hour, "apparentTemperature", TEMP_MULTIPLY);
                    if (temperature > maxTemp) {
                        temperature = maxTemp;
                    } else if (temperature < minTemp) {
                        temperature = minTemp;
                    } else {
                        float tempFloat = (float) 100 / (maxTemp - minTemp) * (temperature - minTemp);
                        temperature = (int) (tempFloat * TEMP_MULTIPLY);
                    }
                    int wind = safeIntFromJson(hour, "windSpeed", WIND_MULTIPLY);
                    int precip = safeIntFromJson(hour, "precipIntensity", PRECIP_MULTIPLY);
                    data.write(intToBytes(temperature));
                    data.write(intToBytes(wind));
                    data.write(intToBytes(precip));
                }
            } catch (ParseException e) {
                e.printStackTrace();
            }
        } finally {
            try {
                if (reader != null) reader.close();
            } catch (IOException ioe) {
                ioe.printStackTrace();
            }
        }
    }
    private byte[] intToBytes(int value) {
        return ByteBuffer.allocate(4).putInt(value).array();
    }
    private int safeIntFromJson(final JSONObject data,
                                final String dataKey,
                                final int multiply) throws IOException {
        Object jsonAttrValue = data.get(dataKey);
        if (jsonAttrValue instanceof Long) {
            return (int) ((Long) jsonAttrValue * multiply);
        } else {
            return (int) ((Double) jsonAttrValue * multiply);
        }
    }
}
It is necessary to explain what 5 properties mean, the values of which we request in runtime:
AL_API_KEY - Secret key of the developer forecast.io
AL_LAT, AL_LON - Coordinates of the area
AL_MAX_TEMP, AL_MIN_TEMP - The values of the minimum and maximum temperatures for this area. This is necessary so as not to waste some areas in the color range used: let's say in my area (Texas, USA) - the temperature never drops below zero, and I would like the violet color (the lowest in our palette) to indicate 0 and not -25, as one could set for Moscow. Thus, our service does not return the actual temperature - it returns one hundredth of a percent between AL_MIN_TEMP & AL_MAX_TEMP.
The source code of the web application along with the maven assembly file is available in the github.com/manusovich/aladdin-service repository.
Next, we need any hosting for our Java web application. I took advantage of my favorite heroku , but you can use any other. The repository already contains the file necessary to run the application in the heroku environment with the name Procfile.
So if we use heroku, all we need to do is:
- Create a new application
- Define 3 new system properties
- Link it to our git repository
- Expand the application. To do this, you must perform Manual Deploy, while all the code will be automatically downloaded from the github repository, compiled and launched
Now our servlet can be executed by opening the https://aladdin-service.herokuapp.com/forecast link in the browser . This will return a file with a weather forecast (168 bytes in size) for a given area (property for the application in heroku)
Lamp side software
First of all, you need to decide how we will send a signal to our LED strip. The tape uses the WS2811 chip to control the LED. After a short search, I came across a tutorial from Adafruit - learn.adafruit.com/neopixels-on-raspberry-pi , where I found a mention of the rpi_ws281x library , which just allows you to generate a signal for a tape based on WS281x chips.
I forked the library into my repository and added the necessary code to main.c (see below in the lamp controller section) to simplify development to a minimum.
A little digression should be made and how I usually develop code for my projects based on Raspberry Pi. I found code editing via ssh not at all convenient. Copy code permanently through ssh too. So I just create a GitHub repository, upload all the code there and use my favorite IDE for development. On the Raspberry Pi side, I create a shell script that tries to get changes from the repository once every 10 seconds. If they are, then the script stops the execution of the program, downloads updates, compiles everything and launches the program. The script is hung at startup. This allows you to develop code remotely and at the same time speeds up the process of checking for changes on the device. But at the same time it loads the wifi network. When software development is complete,
The algorithm in this case is as follows:
- Request changes in git
- If there are changes in the repository then
- Refresh Code
- Compile code
- If compilation is successful then
- Stop running application
- Launch new application
Configure RaspberryPi
- First of all, you need to configure Wifi
- After that, we need to clone the repository into the directory / home / pi / rpi_ws281x (execute in the directory / home / pi):
git clone https://github.com/manusovich/rpi_ws281x
The shell script /home/pi/rpi_ws281x/forecast.sh should be added to startup /etc/rc.local:sudo sh /home/pi/rpi_ws281x/forecast.sh >> /home/pi/ws281.log &
This script updates the forecast, launches the application, as well as updates the weather forecast every 10 minutes and checks the project repository for changes every 60 minutes. If there are changes, they are taken from the repository, compiled and launched.
Script code
#!/bin/bash
echo "Read forecast"
curl https://aladdin-service.herokuapp.com/forecast > /home/pi/rpi_ws281x/forecast
echo "Kill old instance..."
pkill test
echo "Run new instance..."
exec /home/pi/rpi_ws281x/test &
echo "Start pooling for changes"
C=0
while true; do
    C=$((C+1))
    # once per 10 minutes
    if [ $((C%60)) -eq 0 ]
    then
        echo "Update forecast... "
        curl https://aladdin-service.herokuapp.com/forecast > /home/pi/rpi_ws281x/forecast
    fi
    # once per one hour
    if [ $((C%360)) -eq 0 ]
    then
        echo "Check repository... "
        cd /home/pi/rpi_ws281x
        git fetch > build_log.txt 2>&1
        if [ -s build_log.txt ]
        then
            echo "Application code has been changed. Getting changes..."
            cd /home/pi/rpi_ws281x
            git pull
            echo "Bulding application..."
            scons
            echo "Kill old application..."
            pkill test
            echo "Launch new application..."
            exec /home/pi/rpi_ws281x/test &
            echo "Done"
        else
            echo "No changes in the repository ($N)"
        fi
    fi
   sleep 10s
done
Some points should be clarified:
- Absolute paths - this script will be launched from autorun and we need to specify all the paths. Thus, it turns out that on Raspberry Pi our repository should be cloned to the directory / home / pi / rpi_ws281x. If you have a different path, you will need to update this shell script
- This script must be run as administrator, because the tape management code uses direct memory access and must be run as administrator
Lamp controller
Now let's look at the code for controlling LEDs on an LED strip. This code is located in the main.c file and is an endless loop and a set of procedures for changing the color of LEDs.
The main method of the program contains the initialization of the rpi_ws281x library for working with LED strip and starts an endless loop for rendering states:
Main method code
int main(int argc, char *argv[]) {
    int frames_per_second = 30;
    int ret = 0;
    setup_handlers();
    if (ws2811_init(&ledstring)) {
        return -1;
    }
    long c = 0;
    update_forecast();
    matrix_render_forecast();
    while (1) {
        matrix_fade();
        matrix_render_wind();
        matrix_render_precip(c);
        matrix_render();
        if (ws2811_render(&ledstring)) {
            ret = -1;
            break;
        }
        usleep((useconds_t) (1000000 / frames_per_second));
        c++;
        if (c % (frames_per_second * 60 * 5) == 0) {
            // each 5 minutes update forecast
            update_forecast();
        }
    }
    ws2811_fini(&ledstring);
    return ret;
}
The update_forecast method reads the current weather forecast from the file / home / pi / rpi_ws281x / forecast
The matrix_render_forecast method fills the matrix with the current weather forecast values. In doing so, we use a palette of 23 colors taken from paletton.com :
ws2811_led_t dotcolors[] = {
        0x882D61, 0x6F256F, 0x582A72, 0x4B2D73, 0x403075, 0x343477, 0x2E4272, 0x29506D, 0x226666,
        0x277553, 0x2D882D, 0x609732, 0x7B9F35, 0x91A437, 0xAAAA39, 0xAAA039, 0xAA9739, 0xAA8E39,
        0xAA8439, 0xAA7939, 0xAA6C39, 0xAA5939, 0xAA3939
};
The matrix_fade method damps any color fluctuations from the predicted temperature.
The matrix_render_wind method draws an excitation that moves horizontally forward and backward at a speed that is equal to wind speed * by a factor.
The matrix_render_precip method draws precipitation along the edges of the levels. He needs a general counter, since the total refresh rate is 30 frames per second and it turned out very quickly in order to change colors. Therefore, we do this only 15 times per second.
All rendering goes to the XRGB matrix [WIDTH] [HEIGHT]. We need the XRGB structure in order to store floating point numbers instead of integers for colors. This allows us to increase the smoothness of transitions and directly convert to RGB we do in the matrix_render method
When launched, the program displays the current forecast value (temperature, wind and precipitation) in the console. It should be noted that the temperature value is the basis point (one hundredth of a percent).
pi@raspberrypi ~/rpi_ws281x $ sudo ./test
Temp: 5978, Wind: 953, Precip: 0
Temp: 5847, Wind: 1099, Precip: 0
Temp: 5744, Wind: 1157, Precip: 0
Temp: 5657, Wind: 1267, Precip: 0
Temp: 5612, Wind: 1249, Precip: 1
Temp: 5534, Wind: 1357, Precip: 1
Temp: 5548, Wind: 1359, Precip: 0
Temp: 5605, Wind: 1378, Precip: 0
Temp: 5617, Wind: 1319, Precip: 0
Temp: 5597, Wind: 1281, Precip: 0
Temp: 5644, Wind: 1246, Precip: 0
Temp: 5667, Wind: 1277, Precip: 0
Alternative operating modes
You can consider the resulting product as a platform for displaying anything. At your disposal there are about 300 independent LEDs and you decide what can be displayed there. For example, you can organize the display of assembly states on a continuous integration server or simply make an unusual lamp that will play with rainbow colors as in the next video.
Estimate and conclusion
Power supply unit 5 volt 10 amperes - 25 $
2 meters RGB tape (144 LEDs per meter) - 78 $
Raspberry Pi - 30 $
Edimax Wifi USB - 8 $
3D frame printing for LED strip - 15 $ per PLA plastic
Donor lamp - 35 $
In total, the total cost of the product was about 200 US dollars for manufacturing at home.
I hope this article will be useful to you. If you have any questions, feel free to ask in the comments.