The quality of data networks. Software and hardware measurements
- From the sandbox
- Tutorial
 I would like to publish a series of articles on measuring the characteristics of communication systems and data networks. This article is introductory and will cover only the very basics. In the future I plan to have a deeper look in the style of “how is this done”.
When buying a product or service, we often operate with such a concept as quality. What is quality? If we turn to Ozhegov’s dictionary, then we will see the following: “a set of essential features, properties, features that distinguish an object or phenomenon from others and give it certainty”. Transferring the definition to the field of communication networks, we conclude that we need to define “essential features, properties and features” that allow us to unambiguously determine the difference between one line or communication network from another. The enumeration of all signs and properties are generalized by the concept of "metric". When someone talks about the metrics of communication networks, he means those characteristics and properties that will make it possible to accurately judge the communication system as a whole. The need for quality assessment lies mostly in the economic field, although its technical part is no less interesting.
I ask everyone interested under cat.
Monitoring and diagnostics of communication systems
As I wrote above, quality metrics determine the economic component of ownership of a network or communication system. Those. the cost of renting or leasing a communication line directly depends on the quality of this communication line. Cost, in turn, is determined by supply and demand in the market. Further patterns are described by Adam Smith and developed by Milton Friedman. Even in Soviet times, when there was a planned economy, and they thought of the “market” as a crime against the government and the people, there was an institution of state acceptance, both for military and civilian purposes, designed to ensure proper quality. But back in our time and try to determine these metrics.
Consider the network based on Ethernet, as the most popular technology at the moment. We will not consider the quality metrics of the data transmission medium, since they are of little interest to the end user (unless the material of the medium itself is sometimes interesting: radio, copper, or optics). The very first metric that comes to mind is bandwidth, i.e. how much data we can transfer per unit of time. The second , associated with the first, is packet throughput (PPS, Packets Per Second), which reflects how many frames can be transferred per unit of time. Since network equipment operates with frames, the metric allows you to evaluate whether the equipment is able to cope with the load and whether its performance matches the declared one.
Thirdmetric is an indicator of frame loss. If it is impossible to restore the frame, or the restored frame does not match the checksum, then the receiving or intermediate system will reject it. This refers to the second level of the OSI system. If we look in more detail, then most protocols do not guarantee delivery of the packet to the recipient, their task is only to forward the data in the right direction, and those who guarantee (for example, TCP) can lose a lot in bandwidth just because of frame transfers (retransmit), but that's all they rely on L2 frames, the loss of which this metric takes into account.
Fourth- delay (delay, latency), i.e. after how much the packet sent from point A to be at point B. Two more can be distinguished from this characteristic: one-trip delay (one-trip) and circular (round-trip). The trick is that the path from A to B can be one, but from B to A is already completely different. Just dividing the time will not work. And the delay can change from time to time, or “tremble” - such a metric is called jitter. Jitter shows the variation in delay relative to neighboring frames, i.e. the delay deviation of the first packet relative to the second, or fifth relative to the fourth, followed by averaging over a given period. However, if you need to analyze the overall picture or are interested in changing the delay during the entire test time, and the jitter does not accurately reflect the picture, then the delay variation indicator is used.The fifth metric is the minimum MTU of the channel. Many do not attach importance to this parameter, which can be critical when operating “heavy” applications, where it is advisable to use jumbo frames. The sixth , and unobvious for many parameter - burst - normalized maximum bit rate. Using this metric, you can judge the quality of the equipment that makes up the network or data transfer system, allows you to judge the size of the equipment buffer and calculate the reliability conditions.
About measurements
Since we have decided on the metrics, it is worth choosing a measurement method and a tool.
Delay
A well-known tool that ships with most operating systems is the ping utility (ICMP Echo-Request). Many people use it several times a day to check the availability of nodes, addresses, etc. Designed just for measuring RTT (Round Trip Time). The sender forms a request and sends to the recipient, the recipient forms a response and sends to the sender, the sender measures the time between the request and the response, calculates the delay time. Everything is clear and simple, nothing needs to be invented. There are some accuracy issues and are discussed in the next section.
But what if we need to measure the delay in only one direction? Everything is more complicated here. The fact is that in addition to just estimating the delay, it will come in handy to synchronize the time on the sender and the receiving nodes. For this, the PTP protocol (Precision Time Protocol, IEEE 1588) was invented. What I’ll better describe NTP, because everything is already painted here, I’ll only say that it allows you to synchronize time with an accuracy of nanoseconds. As a result, it comes down to ping-like testing: the sender generates a packet with a time stamp, the packet goes through the network, reaches the receiver, the receiver calculates the difference between the time in the packet and its own, if the time is synchronized, then the correct delay is calculated, if not, that measurement is wrong.
If you accumulate information about the measurements, then based on the historical data on the delay, you can easily plot and calculate the jitter and delay variation - an important indicator in VoIP and IPTV networks. Its importance is primarily associated with the operation of the encoder and decoder. With a “floating” delay and an adaptive codec buffer, the likelihood of not having time to recover information increases, there is a “ringing” in the voice (VoIP) or frame “mixing” (IPTV).
Frame loss
When measuring delay, if the response packet was not received, it is assumed that the packet was lost. This is what ping does. It seems that everything is also simple, but this is only at first glance. As described above, in the case of ping, the sender forms one packet and sends it, and the recipient forms its own and sends it in response. Those. we have two packages. In case of loss, which one was lost? This may not be important (although it is also doubtful) if our direct packet route corresponds to the opposite, and if this is not so? If this is not so, then it is very important to understand which shoulder of the network is the problem. For example, if a packet has reached the recipient, then the direct path functions normally, if not, then you should start by diagnosing this section, but if the packet has arrived, but did not return, then you definitely should not waste time trying to troubleshoot a healthy direct segment. The identification tag, which is embedded in the test package, could help in the identification. If both ends have the same type of meters, then each of them at any given time knows the number of packets sent and received by it. Which packets did not reach the recipient can be obtained by comparing the list of sent and received packets.
Minimum MTU
Measuring this characteristic is not that difficult, but rather boring and routine. To determine the minimum MTU (Maximum transmission unit) size, you only need to run a test (the same ping) with different frame sizes and the DF (Don't Fragmentate) bit set, which will result in packets with a frame size larger than acceptable, due to the fragmentation prohibition.
For example, this does not work:
$ ping -s 1500 -Mdo 8.8.8.8
PING 8.8.8.8 (8.8.8.8) 1500(1528) bytes of data.
ping: local error: Message too long, mtu=1500
ping: local error: Message too long, mtu=1500
^C
--- 8.8.8.8 ping statistics ---
2 packets transmitted, 0 received, +2 errors, 100% packet loss, time 1006ms
And so it goes:
$ ping -s 1400 -Mdo 8.8.8.8
PING 8.8.8.8 (8.8.8.8) 1400(1428) bytes of data.
1408 bytes from 8.8.8.8: icmp_seq=1 ttl=48 time=77.3 ms
1408 bytes from 8.8.8.8: icmp_seq=2 ttl=48 time=76.8 ms
1408 bytes from 8.8.8.8: icmp_seq=3 ttl=48 time=77.1 ms
^C
--- 8.8.8.8 ping statistics ---
3 packets transmitted, 3 received, 0% packet loss, time 2002ms
rtt min/avg/max/mdev = 76.839/77.133/77.396/0.393 ms
Not often used metric from a commercial point of view, but relevant in some cases. Again, it is worth noting that with an asymmetric packet path, different MTUs are possible in different directions.
Throughput
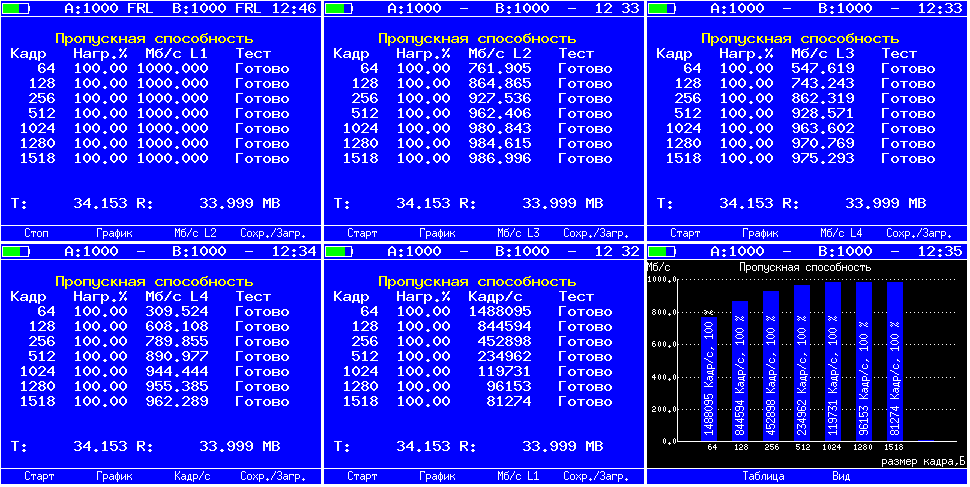
Surely many people know the fact that the amount of useful information transmitted per unit of time depends on the size of the frame. This is due to the fact that the frame contains a lot of auxiliary information - headers, the size of which does not change when the frame is resized, but the field of the “payload” changes. This means that despite the fact that even if we transmit data at the link speed, the amount of useful information transmitted over the same period of time can vary greatly. Therefore, despite the fact that there are utilities for measuring channel bandwidth (for example, iperf), it is often impossible to obtain reliable data on network bandwidth. The thing is that iperf analyzes traffic data based on the calculation of the very “useful” part surrounded by protocol headers (usually UDP, but TCP is also possible), therefore, the load on the network (L1, L2) does not correspond to the calculated (L4). When using hardware meters, the rate of traffic generation is set to L1, because otherwise it would not be obvious to the user why the load changes while measuring the frame size, it is not so noticeable when set as a %% of the bandwidth, but it is very striking when indicated in units of speed (Mbps, Gbps). In the test results, as a rule, the speed for each level is indicated (L1, L2, L3, L4). For example, like this (you can switch L2, L3 in the output): when you set it in %% of the bandwidth, but it is very striking when indicated in units of speed (Mbps, Gbps). In the test results, as a rule, the speed for each level is indicated (L1, L2, L3, L4). For example, like this (you can switch L2, L3 in the output): when you set it in %% of the bandwidth, but it is very striking when indicated in units of speed (Mbps, Gbps). In the test results, as a rule, the speed for each level is indicated (L1, L2, L3, L4). For example, like this (you can switch L2, L3 in the output):
Bandwidth in frames per second
If we talk about a network or communication system as a complex of communication lines and active equipment that ensures normal functioning, then the efficiency of such a system depends on each component of it. Communication lines should provide work at the declared speeds (linear speed), and the active equipment must have time to process all incoming information.
All equipment manufacturers declare the PPS (packets per second) parameter, which directly indicates how many packets are capable of "digesting" the equipment. Previously, this parameter was very important, since the overwhelming number of equipment simply could not handle a huge number of “small” packages, now manufacturers are increasingly reporting wirespeed. For example, if small packets are transmitted, then the processing time is usually spent as much as for large ones. Since the contents of the package are not interesting for the equipment, but the information from the headers is important - from whom it came and to whom to transmit.
Nowadays, ASIC (application-specific integrated circuit) - specially designed for specific purposes integrated circuits with very high performance, while FPGA (field-programmable gate array) were used quite often - are more widely used in switching equipment - more about their application You can read with my colleagues here and listen here .
Burst
It is worth noting that a number of manufacturers save on components and use small packet buffers. For example, work at the link speed (wirespeed) is declared, and in fact packet loss occurs due to the fact that the port buffer cannot accommodate more data. Those. the processor has not yet processed the accumulated packet queue, and new ones continue to go. Often this behavior can be observed on various filters or interface converters. For example, it is assumed that the filter accepts a 1Gbps stream and sends the processing results to the 100Mbps interface if it is known that the filtered traffic is certainly less than 100Mbps. But in real life, it happens that at some point in time there may be a “surge” in traffic of more than 100Mbps and in this situation packets are lined up. If the buffer size is sufficient, then all of them will go to the network without loss, if not, they’ll simply be lost. The larger the buffer, the longer the excess load can withstand.
Measurement errors
But science metrology would not be science if it had just described and how to measure at its discretion. The field of knowledge becomes science when the characteristics of research methods based on confirmed knowledge are determined. One of such metrological characteristics is that the measuring tool itself should not introduce its error into the measurement process, or this error should be reliably known and determined. In cases when we are dealing with software-based tools and general-purpose operating systems, the measurement error, unfortunately, cannot be accurately determined, and accordingly it is impossible to calibrate the measuring instrument accordingly. The thing is that the processes that occur during data processing, receiving packets from the network, the formation of answers are probabilistic in nature, associated with the architecture of the operating system. I’ll try to explain using ping as an example:
- the program measures time, forms a packet with data, and gives it to the OS for “descent” via OSI;
- OC puts the packet in the queue, then processes it, if necessary putting on the missing encapsulations, pulls the context, puts the packet in the network card buffer through the driver, which also has, as a rule, a ring buffer;
- the packet travels the network until it reaches the recipient;
- the network card of the recipient, having received the packet and putting it in the buffer, causes an interrupt;
- The recipient’s OS, stopping other processing, reads the packet and queues it for processing, processes it, sends it back (if we are talking about ping), or pulls the context and gives it to the program for processing (if the processing is not “nuclear”), i.e. items 1-2 are repeated only on the recipient's side;
- the packet again travels the network, only in the opposite direction (and not the fact that it corresponds exactly to the direct one);
- clauses 4-5 are repeated for the sender;
- the sender program calculates the time between start 1 and end 7.
Thus, we got the time from the formation of the package by the program to the time it received the same response package, instead of getting the amount in points 3 and 6, i.e. the “spurious” sections are taken into account in the delay. The solution to this kind of problem is to insert a timestamp into the packet as close as possible to the network output, i.e. at least a network card buffer. This will allow to cut off the “parasitic” influence of points 1-2, but 4-5 remain. At the receiver, the packet should be returned without processing in the operating system, for example, simply by swapping the receiver and sender MAC. The initial sender, who received such a packet, can compare the initial mark set at the output to the network with the current mark at the input from the network and make a much more accurate calculation of the delay. A good example can be seen by measuring the delay in the echo request mode and in the certified test mode on our"Golden Eagle-ET" or "Golden Eagle-ETX" . In some systems, due to the architecture, the ping can show values in the region of 30-60 ms in a direct connection (cross-connect), while the certified test will show 8-16 ns, i.e. the difference is an order of magnitude. Two computers are likely to show the best result, but the error introduced by them in the measurement of the delay cannot be taken into account. And the echo request in our device is not present for measuring the delay as such, but as a standard tool for checking the availability of a node on the network.
Conclusion
The following metrics are basic and supportive for assessing the quality of communication networks and systems:
- bandwidth
- packet throughput
- frame loss
- delay
- one-trip
- round-trip
- jitter
- delay variation
- minimum MTU
- burstness
The general principle of measurements is the generation (or evaluation) of test packets as close as possible to the output (or input) of the measured section, otherwise it is impossible to ensure accuracy due to an increase in the number of factors affecting the measurements. Currently, testing methods such as RFC2544 and Y.1564 are common and applied. A lot can be written about the principles of operation of our devices and the specifics of tests. Just in the following publications I plan to reveal some secrets.
Thank you all for your attention.