FatCow icon era sunset (color selection, top 30 and other arithmetic)
Final release of icons
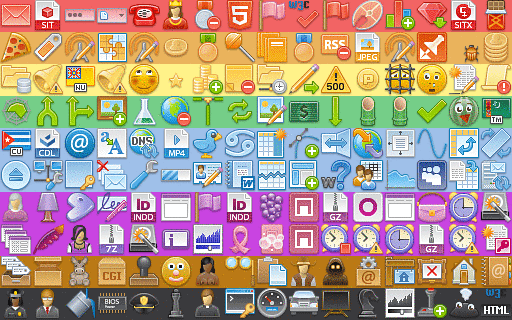
Five years ago, we started drawing a set of pixel icons. The fashion was on Vista. By the end of 2013, the FatCow set had reached 3926 icons. This is 356 icons more than Fugue , which in the spring of that year settled on the number 3570 (size: 16x16). 352 icons from the Fugue bonus (32x32 and 24x24) do not count (like replays). But further development of FatCow icons is frozen . Alas, we will not see a round figure of 4,000 icons (there is work left for a month), we will not see the release for retina of additional sizes of existing icons, development has been stopped due to lack of budget. Managed to do a test for retina and more.
Yes, these are not mega-photo-realistic-3D-yet-one-nobody-needed-icons-this is an old pixel school. Where in honor was the small size and color gamut limitation. Another 10 years will pass ... and we sincerely believe that pixel icons will remain in use. And if you are a connoisseur of ancient art forms, the days of the birth of computer graphics, please be behind the screen!
Let me give you some statistics on the use of icons on the Internet [table 1] and the latest changes made to the last (3.92) icon pack . Indeed, thanks to the wide distribution of icons from year to year, I received a budget for the development of the next addition to the set of free icons.
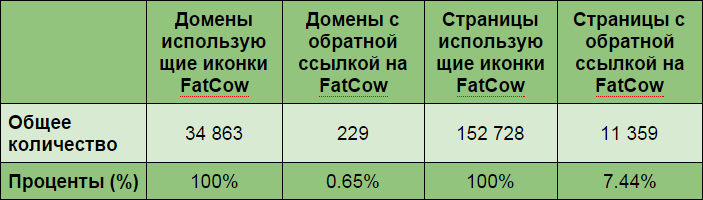
Table 1: Icon usage statistics
Of the 152,728 pages using FatCow icons (on 34,863 domains) on the World Wide Web, only 228 domains (0.65%) comply with the single license condition and refer to the source (in any convenient way). As we found our pictures, a separate amusing topic, but the share of false positives was nullified.
Searches for all references to a specific image (on Google)
Quite a lot of attempts have been made to find any suitable software that is able to compile a list of resources that our pictures use, right away for a group of 4000 pictures. The only alternative is to search through the 1C program, but this program is too expensive for such a task. I had to reinvent the wheel. We tried to search for icons through the Google photo service.
The whole problem was to force Google to pull up the icons from the disk, not from the site, since it presumably does not take into account some factors from the site (it’s difficult to describe in more detail, since it’s not entirely clear what parameters are generally used when searching) presumably this is size and md5, width, height, color gamut, brightness, contrast, etc.
There are 2 ways to upload pictures to “any” online service: either from the disk or from the URL. When uploading icons from the disk to the Google Image Search service with a transparent background, we get the best result, since only the drawn object is taken into account - without taking into account the (very large) background component. If you fill in the icon from the site (with the URL), then the transparency is lost and then a white background color is mixed with the total mass of colors . However, this is only a hypothesis and it may be erroneous. Our opinion has developed from the result. Perhaps Google employees, or those who are in the subject, will correct us.
The attempt to load from the URL and from the disk, oddly enough, had completely different results. The closest to the expected (in terms of coverage) result was when booting from a computer. It remained to put the download of icons from the disk to the browser on the stream. To implement this action, you need a browser emulator, it became the component Selenium webdriver , which allows you to write on anything (php, C #, Java, Python, VBA, Ruby, Perl, JS).
Next, it was necessary to process the entire result in automatic mode, the vba + selenium design was selected , after a day we received the result in the form of an array of sites on which each of the 3926 icons are used. Processing was carried out for sizes 16x16 and 32x32 separately.
After processing this array, we got very interesting statistics.
Seo icon stats
PageRank statistics for domains using FatCow icons , [table 2]
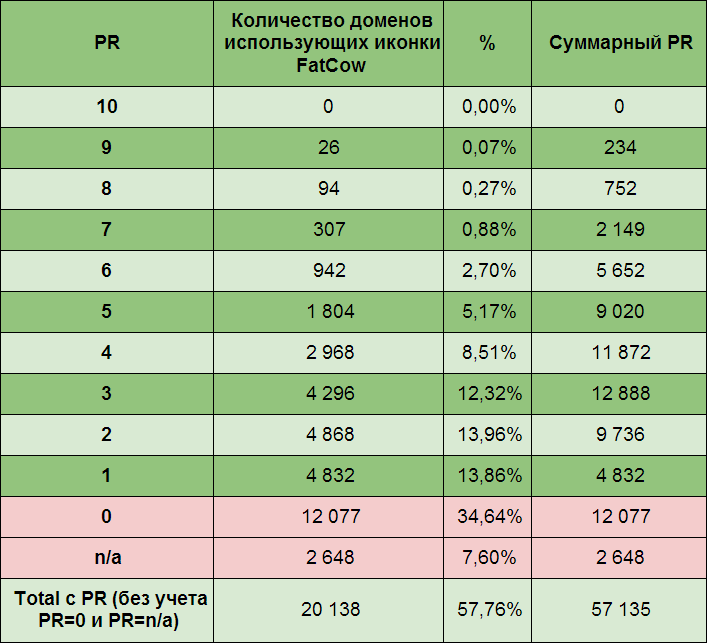
Table 2: PageRank statistics for domains using FatCow icons. The arithmetic mean of the total PR is 6 348 (The total and average values are processed for PR 1-9 NOT TAKING INTO ACCOUNT n / a, 0, 10)
TOP-30 domains used by the largest number of FatCow icons , [table 3]
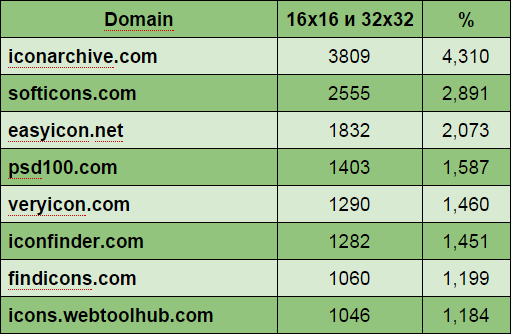
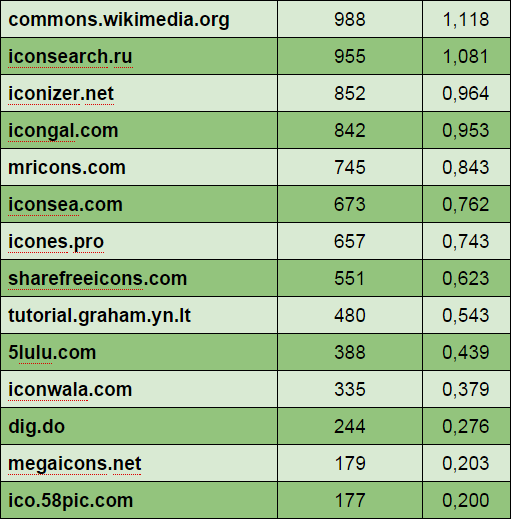
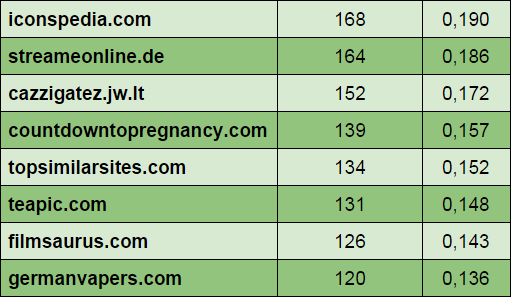
Table 3: TOP 30 Domains Used by the Most FatCow Icons
Charts TOP 30 used icons by the number of domains
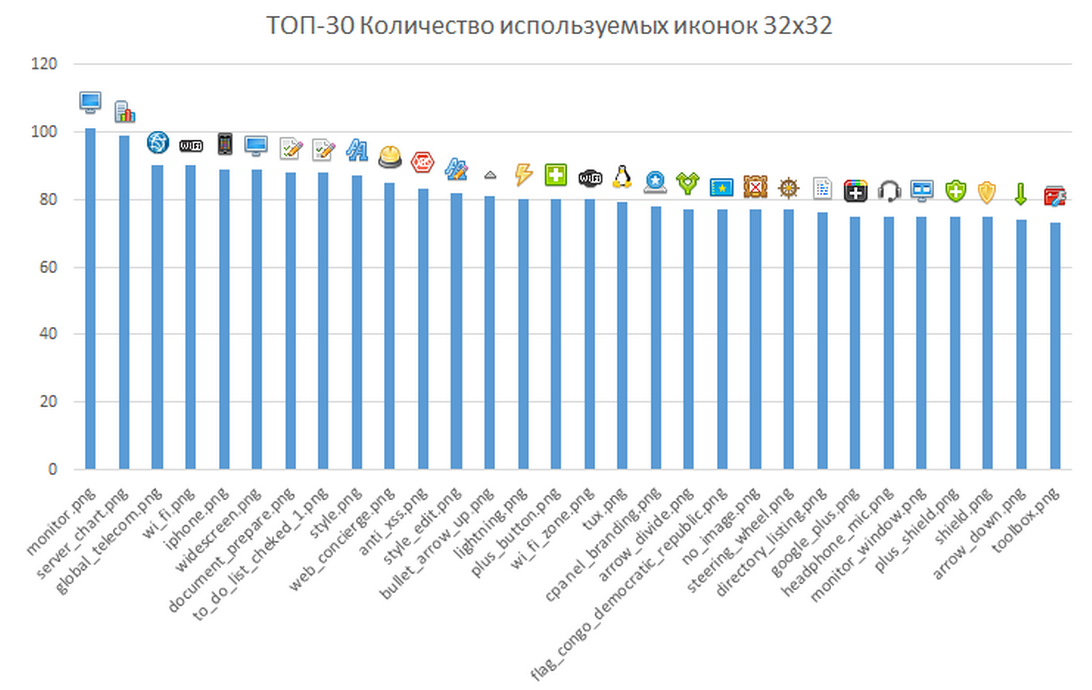
Fig. 1 - TOP 30 icons used by the number of domains (size 32x32)
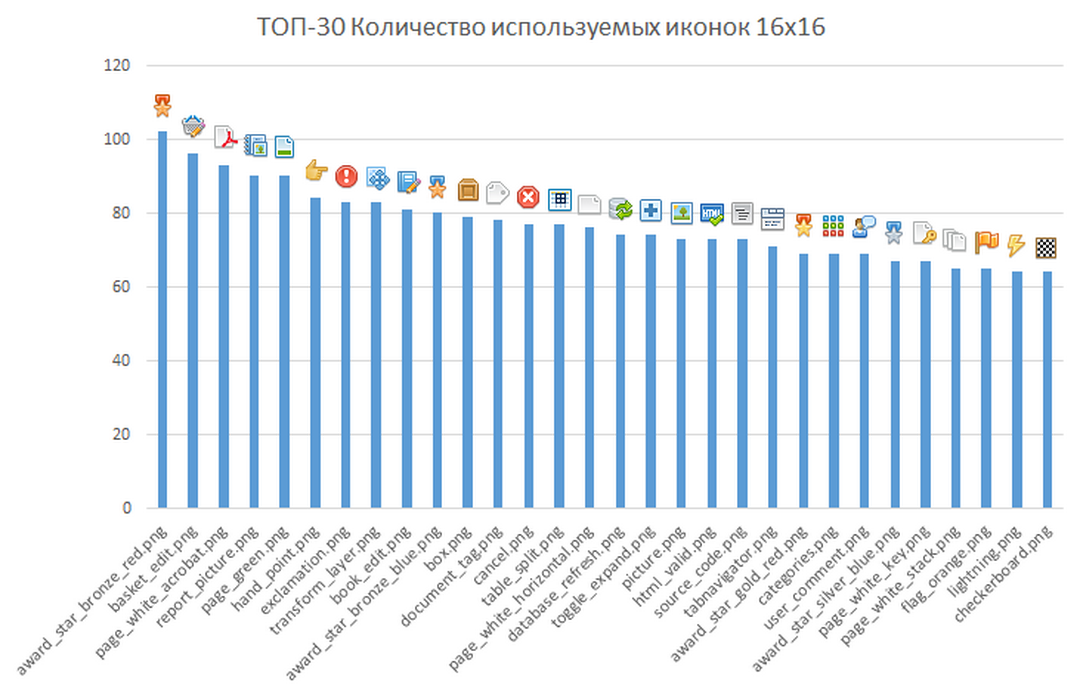
Fig. 2 - TOP 30 icons used by the number of domains (size 16x16)
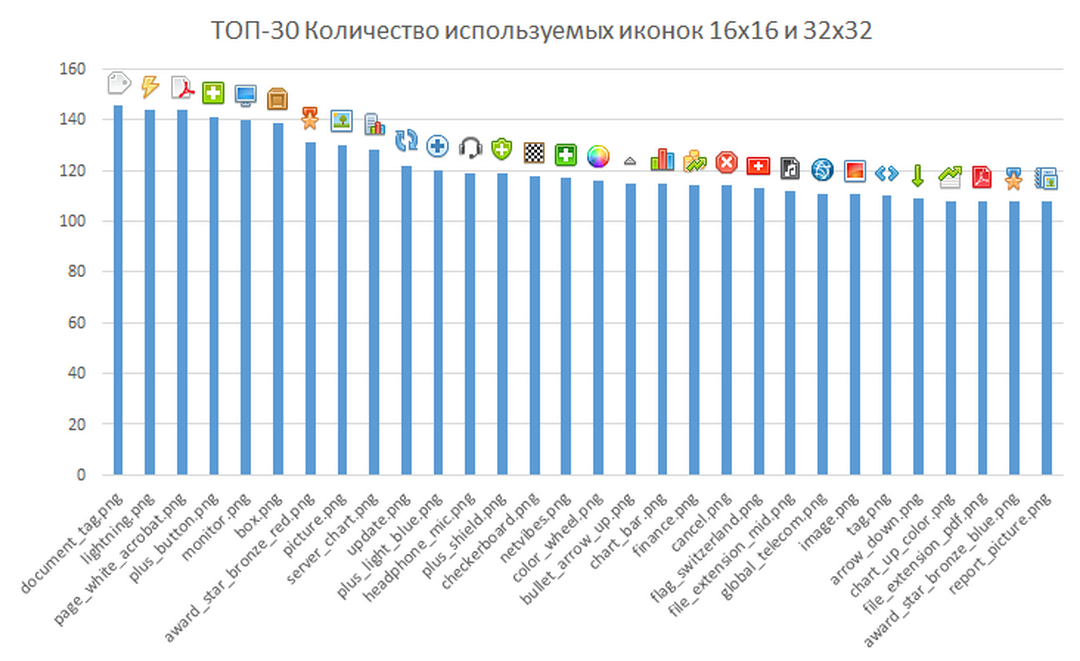
Fig. 3 - TOP 30 icons used by the number of domains (size 16x16 and 32x32)
Color breakdown
When sorting the icons alphabetically, it often turned out that visually and by color similar icons were next only if the name had a color affiliation. Now we have the opportunity to download folders with icons that belong to 10 primary / basic colors and the 1st mixed color - they called it Mix, more details [table 4].
Mix color:
- none of the 10 colors prevails;
- the area of flowers as a percentage is approximately equal;
- examples:

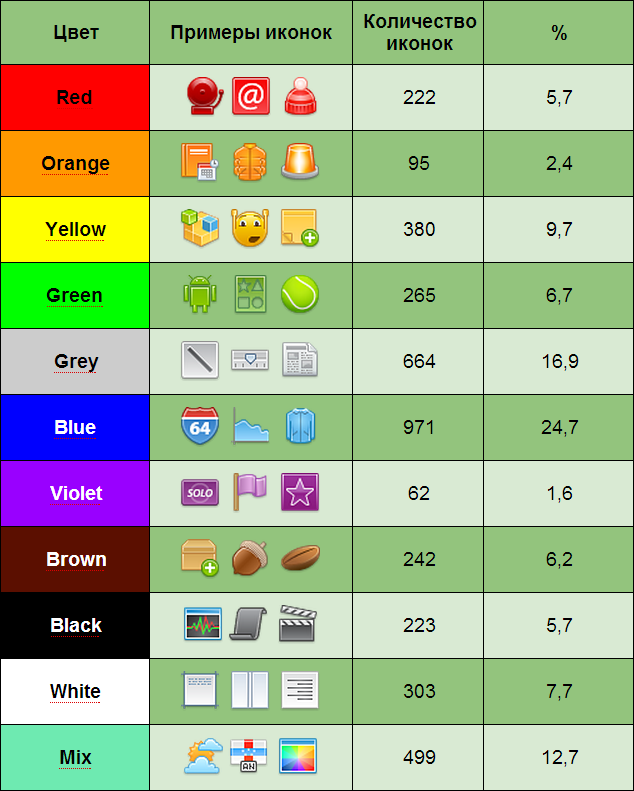
Table 4: Table of description of the breakdown of icons by color ( download archive with colors )
The selection by color was as follows
First, we decided to use the well-known online color determination services and drove individual icons through several services (the sequence does not matter):
- labs.tineye.com
- projekty.brostudio.pl
- colorexplorer.com
- zonums.com
- colorhunter.com
- colorcombos.com
- cssdrive.com
Using services, we got a list of colors that make up this icon. For each color, a percentage value is assigned, which indicates the area of filling with this color in the icon (in% ratio of the total amount of colors).
The basis was taken 10 basic colors of the site labs.tineye.com . Other options simply did not have time to consider.
Labs.tineye.com service
The labs.tineye.com service was originally selected due to the way the information was displayed. But later I had to study other services, due to an overabundance of detailed information that required significant processing algorithms. In simple terms, it was difficult to bring a HUGE (1536 shades) number of shades to the base 10 colors + 1 color - Mix.
The separation of colors looks like this [Figure 4]. For example: the
 bug.png icon after processing by the site looks like this: bug.png .
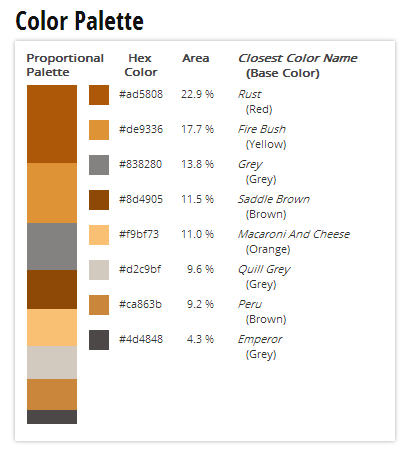
Figure: 4 Color breakdown for bug.png icon according to labs.tineye.com
Here we see color representations in the HEX color scheme. Namely, the color gamut is visually displayed, the colors in hexadecimal notation, the percentage area of each color inside the icon, the name of the WEB color and the base color in brackets.
If we analyze the color table (based on the Colorado potato beetle), then there are 3 options:
- The largest percentage area of the component shade / color is 22.9% for the Rust shade from the Red color family.
- Gray, Quill Gray, Emperor from the Gray family of colors.
- The visually dominant color of this icon is Brown.
It can be seen that the gray color as a percentage of the fill area is greater, but upon visual inspection, the predominant color in this icon is brown.
HEX is the hexadecimal representation of the color scheme. In the hexadecimal system, it is customary to indicate numbers with letters, but the combined use of a letter + numbers is also possible.
Representation in the form of three pairs of hexadecimal digits, where each pair is responsible for its own color (# 123ABC):
- the first two digits are red
- two in the middle - green
- the last two digits are blue
Service projekty.brostudio.pl/color/
The site http://projekty.brostudio.pl/color/ showed more averaged results.
The service was chosen for its minimalism and display of better recognizable data in the form of the main color.
Figure 5: Color breakdown for the bug.png icon according to the site projekty.brostudio.pl/color/
But due to the fact that not all the icons coincided with the visually dominant color, I had to look further.

Figure 6: Color breakdown for the brightkite icon according to the site projekty.brostudio.pl/color/
Colorexplorer.com service
The site http://www.colorexplorer.com also showed averaged colors, but did not show their ratio [Figure 7].
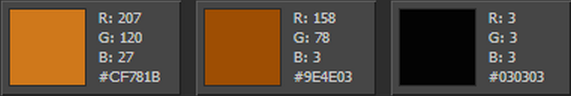
Fig. 7: Color breakdown for the bug.png icon according to the version of the site colorexplorer.com
. Also, the service was much inferior when loading icons with “littered colors”. And to determine the dominant color was difficult.
Services:
- http://www.zonums.com/online/color_extract/
- http://www.colorhunter.com/
- http://www.colorcombos.com/grabcolors.html
- http://www.cssdrive.com/imagepalette/index.php
and many others, were rejected due to various inappropriate or untreated properties.
Consider another example
Consider the example of the other «brightkite» icon:
 .
. A breakdown for this icon can be seen in the figures below, [Figure 8.9].
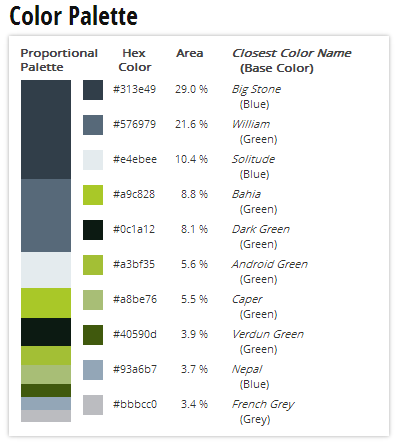
Fig. 8: Color breakdown for the brightkite icon according to the version of the site labs.tineye.com
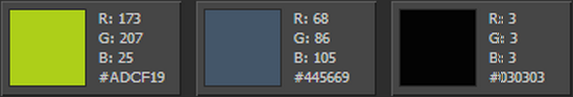
Fig. 9: Color breakdown for the brightkite icon according to the version of the site colorexplorer.com
As you can see from the data in [Figure 8], this icon is a percentage of green, however, according to the visual representation, this icon can be attributed to dark gray, but since we do not have it, we attribute it to black. Although it can also fall into a mixed color.
But we did not give up hope, we collected color statistics from these sites in the form of the data shown in the figures above. After that, we tried to process them, leading to some averaged components. Even leaving only the dominant colors, we received very unreliable information about the actual appearance of the icons.
All this led to unnecessary processing and the search for solutions that then did not pay back the time and effort invested in them.
Entertaining statistics
The only thing that we consider it necessary to show from these treatments is the boundaries of the distribution of the color component, which is based on colors that were dominant in percentage terms.
According to the version of the site http://projekty.brostudio.pl/color/ , it is closest to the truth [Figure 10], by the truth we mean our visual distribution.
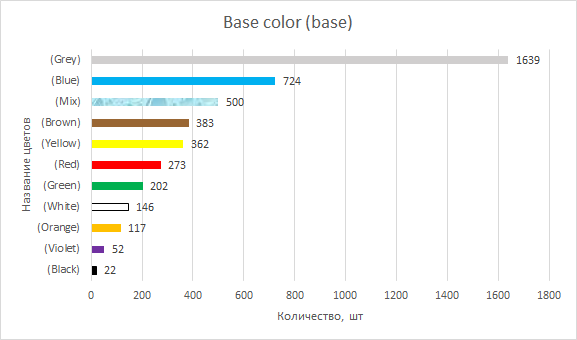
Figure 10: Distribution of dominant colors according to the version of the site projekty.brostudio.pl/color/
According to the version of the site labs.tineye.com, everything looks a little different [Figure 11].
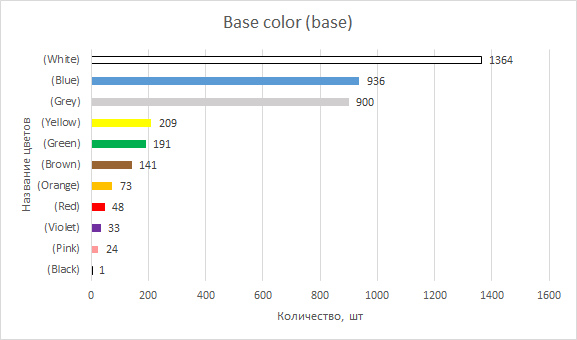
Figure 11: Distribution of dominant colors according to labs.tineye.com
This graph [Figure 12] shows how many icons consist of how many colors. For example, we see that 453 icons consist of one color. Those. in 453 icons, the dominant color fills> 95% of the entire icon area. Thus, the graph shows that there are most three-color icons, there are 1023 of them.
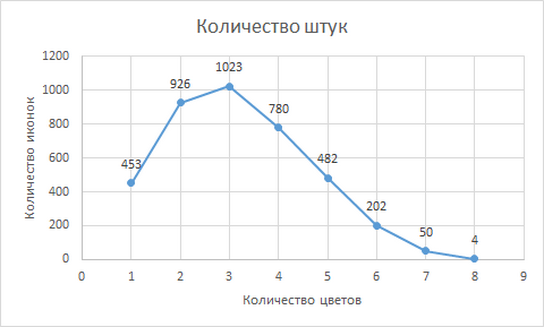
Figure 12: The number of colors used in the icons.
Below is a graph of the "our" version. Sampling was performed manually by eye [Figure 13].
Figure 13: Distribution of dominant colors according to the “by eye” version.
The same graph in another section [Figure 14].
Figure 14: Distribution of dominant colors by eye version
To summarize the results, we created a graph comparing three versions of the dependencies of the number of icons on the colors discussed earlier [Figure 15]:
___
 - projekty.brostudio.pl/color/
___
 - labs.tineye.com
___
 - “our version”
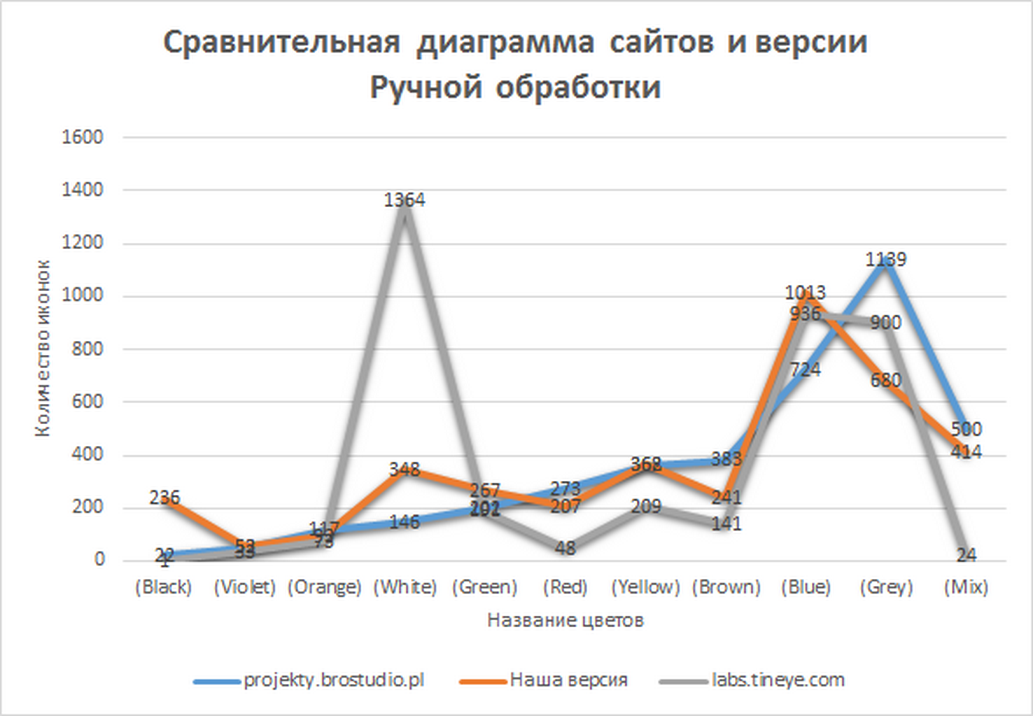
Figure 15: Distribution of dominant colors according to the “by eye” version
Unfortunately, in addition to extensive knowledge about icons and shoveling a heap of statistical data, we still did not get the desired result by the Ivan method in Russia.
What has been done in the latest public release?
- Переименовано иконок (award_star_bronze_1.png => award_star_bronze_red.png; award_star_bronze_2.png => award_star_bronze_green.png; award_star_bronze_3.png => award_star_bronze_blue.png; temperature_3.png => temperature_normal.png) — 130 шт. (оба размера)
- Пересобраны исходники:
- ранее было: 197 файлов, 1 файл = 20 слоев с иконками (пример .ai файла).
- сейчас: 3926 файлов (для варианта 16х16 и 32х32), 1 файл = 1 слой с иконкой (пример).
- были удалены дубли слоев.
- как и предполагалось, когда начинается инвентаризация такого количества файлов неизбежно начинают проявлятся недостачи в виде недостающих либо утраченных файлов, их соответственно либо дорисовывали, либо находили не достающие части и создавали заново
- Переименованы слои внутри .ai исходников, все приведены в соответствие к названиям иконок (заменены тире, нижние подчеркивания, опечатки)
Добавлено:
- Создана разбивка иконок по цветам. Синие иконки в синей папке, зеленые — в зеленой. Всего 10 папок — fatcow-icons-3.9.2-colors.zip
- Для любителей серых оттенков, специально создан пак исключительно в серых тонах (fatcow-icons-3.9.2-grey.zip)
Cтандартный набор ICO fatcow-icons-3.9.2-ICO.zip, оба сета созданы также с помощью программы imagemagick, подробней читайте здесь — ImageMagick_secret
PS For your first time , vector source codes of icons (.ai files) are presented. Download until the file is killed, because it weighs almost three gigabytes and can fall at any time: fatcow-hosting-icons-3.9.2-ai-src.zip