Using WPP Software Tracing in System Programming
Dear reader,
you probably wrote a logging tool in your project and successfully use it to analyze difficultly diagnosed bugs. But you always faced a situation:
In this article I will present a fast, reliable and versatile debugging tool with a minimal overhead diagnostic tool offered by MS for system applications - WPP, which was partially discussed in the publication “EventTrace for Windows. High-speed transmission of driver debugging messages over the network . "
Being based on ETW , logging is done by the operating system, uses event identifiers, does not contain any proprietary information and automatically adds system labels to the event (time, thread, process, CPU). WPP logging is included in the release build, which allows you to collect information from the customer side without having to rebuild the debug version.
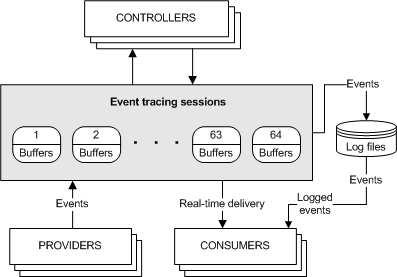
Key terms in ETW are provider- an application that records events, the controller - monitors the debugging session and the consumer - formatting the session information in a readable format. The figure below illustrates the interaction of the components.
Let's move from words to practice. As an example for modification, we take the official example of a service from MS - CppWindowsService and, using the following 6 points, consider usecase WPP Tracing.
0. If you add WPP to the driver, then start reading from point 1, since the new WDK has add-ins for WPP in the project templates, the parameters of which are available at the link. Copy the WppTracingSettings.props properties file from the repository and manually connect it to the project, adding a new Import tag before closing the project:
WppTracingSettings.props contains a WPP preprocessor call (by the way, it starts before cl.exe so wraps func in something else) and determines the project name, the name and parameters of the logging macro, and also the list of files - in our case, everything except stdafx. cpp.
Based on the publication of Trey Nash .
1. Create tracer.h, where we generate the provider GUID, define debug levels (usually from evntrace.h) and debug flags. In my projects, I use flags to designate modules (initialization, dispatcher procedures, logic, etc.):
2. We include the files generated by the WPP preprocessor in the cpp files, call it in DllEntry or main WPP_INIT_TRACING to register the provider in the system and call the trace.
WPP provides several additional format specifiers , and also allows you to create your own .
3. The provider is created, now it needs to be connected to the debugging information session. It should be noted that a call to TraceEvent will have an overhead of only one conditional branch if the provider does not belong to any session in the system.
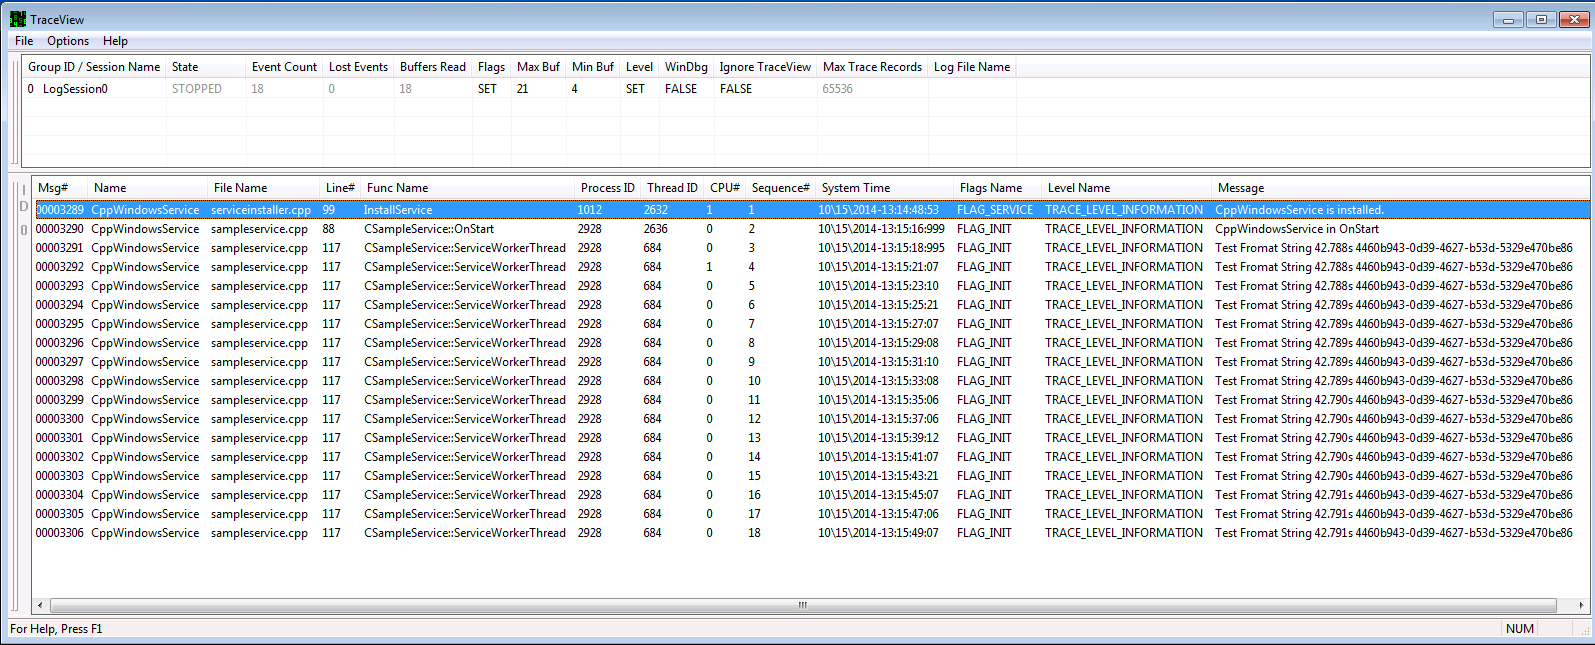
Using the controller most suitable for the situation, we create a session using the provider's GUID or PDB file. TraceView is intuitive - I will not dwell on it. And in the repository, the StartTraceEtl.bat and StopTrace.bat scripts are available to start the logman controller in the etl file. You can add a second provider to the session by calling logman update:
The events of several providers within the same session will be recorded in order, each record corresponds to a Sequence Number. Opening a recorded test.etl session in TraceView in the image below.
4. logman is only a controller and does not allow formatting logging on the fly, like TraceView. If you want to automate the collection of information, you can use the following sequence: start logman from launch_wpp_log.bat then tracefmt.exe -rt testlog -display -p tmfpath, having previously generated tmf files with tracepdb.exe. tracefmt allows you to create a display format through the configuration file. The output with the default configuration file is as follows.
Windbg can also act as a controller using the! Wmitrace extension, but for me this method does not work. Instead, I use the optional flag TraceView -> Windbg Trace.
5. TMF files contain all string trace constants, and if it is necessary to get data from the user's machine, then Tracefmt also works with modified tmf files.
Source code, scripts and necessary WPP utilities are available here .
Happyhunting debugging.
you probably wrote a logging tool in your project and successfully use it to analyze difficultly diagnosed bugs. But you always faced a situation:
- when writing to a file, the console dramatically affected the reproducibility of the bug;
- when a multi (processor / thread) application often calls the driver and you cannot match timestamps and threads;
- when a bug is played on the side of the custom, the teamviewer session is useless, and besides, the version with debugging symbols is private;
- when the system application crashes before the system has time to drop logging to disk;
- or when the macro for logging looks at best like
#define TraceDbg(format, ...) \ printf( "(p %d, t %d) - (%s,%d) %s(): " format, GetCurrentProcessId(), GetCurrentThreadId(), __FILE__, __LINE__,__FUNCTION__, __VA_ARGS__ ); - when you come up with another way to display ipaddr or UUID
In this article I will present a fast, reliable and versatile debugging tool with a minimal overhead diagnostic tool offered by MS for system applications - WPP, which was partially discussed in the publication “EventTrace for Windows. High-speed transmission of driver debugging messages over the network . "
Being based on ETW , logging is done by the operating system, uses event identifiers, does not contain any proprietary information and automatically adds system labels to the event (time, thread, process, CPU). WPP logging is included in the release build, which allows you to collect information from the customer side without having to rebuild the debug version.
Key terms in ETW are provider- an application that records events, the controller - monitors the debugging session and the consumer - formatting the session information in a readable format. The figure below illustrates the interaction of the components.
Let's move from words to practice. As an example for modification, we take the official example of a service from MS - CppWindowsService and, using the following 6 points, consider usecase WPP Tracing.
0. If you add WPP to the driver, then start reading from point 1, since the new WDK has add-ins for WPP in the project templates, the parameters of which are available at the link. Copy the WppTracingSettings.props properties file from the repository and manually connect it to the project, adding a new Import tag before closing the project:
WppTracingSettings.props contains a WPP preprocessor call (by the way, it starts before cl.exe so wraps func in something else) and determines the project name, the name and parameters of the logging macro, and also the list of files - in our case, everything except stdafx. cpp.
Based on the publication of Trey Nash .
1. Create tracer.h, where we generate the provider GUID, define debug levels (usually from evntrace.h) and debug flags. In my projects, I use flags to designate modules (initialization, dispatcher procedures, logic, etc.):
#define WPP_CHECK_FOR_NULL_STRING  //to prevent exceptions due to NULL strings
#define WPP_CONTROL_GUIDS \
    WPP_DEFINE_CONTROL_GUID(SimpleServiceProvider, (c34f5c45, 3569, 896c, ba85, bf8dcc85aa62), \
        WPP_DEFINE_BIT(FLAG_INIT)             /* bit  0 = 0x00000001 */ \
        WPP_DEFINE_BIT(FLAG_TEST)              /* bit  1 = 0x00000002 */ \
        WPP_DEFINE_BIT(FLAG_OTHER)           /* bit  2 = 0x00000004 */ \
        WPP_DEFINE_BIT(FLAG_SERVICE)           /* bit  3 = 0x00000008 */ \
 /* You can have up to 32 defines. If you want more than that,\
   you have to provide another trace control GUID */\
        )
#define WPP_LEVEL_FLAGS_LOGGER(lvl,flags) WPP_LEVEL_LOGGER(flags)
#define WPP_LEVEL_FLAGS_ENABLED(lvl, flags) (WPP_LEVEL_ENABLED(flags) && WPP_CONTROL(WPP_BIT_ ## flags).Level >= lvl)
2. We include the files generated by the WPP preprocessor in the cpp files, call it in DllEntry or main WPP_INIT_TRACING to register the provider in the system and call the trace.
#include "tracer.h"
#if defined(EVENT_TRACING)
#include "tmhs/(I'm a filename).tmh"
#endif
void Sample(void)
{
    // {4460B943-0D39-4627-B53D-5329E470BE86}
    static const GUID testGUID =
    { 0x4460b943, 0xd39, 0x4627, { 0xb5, 0x3d, 0x53, 0x29, 0xe4, 0x70, 0xbe, 0x86 } };
      // Perform main service function here...
     TraceEvents(TRACE_LEVEL_INFORMATION, FLAG_INIT, "Test Fromat String %!GUID!", &testGUID);
}
int wmain(int argc, wchar_t *argv[])
{
    WPP_INIT_TRACING(NULL);
    Sample();
    WPP_CLEANUP();
    return 0;
}
WPP provides several additional format specifiers , and also allows you to create your own .
3. The provider is created, now it needs to be connected to the debugging information session. It should be noted that a call to TraceEvent will have an overhead of only one conditional branch if the provider does not belong to any session in the system.
Using the controller most suitable for the situation, we create a session using the provider's GUID or PDB file. TraceView is intuitive - I will not dwell on it. And in the repository, the StartTraceEtl.bat and StopTrace.bat scripts are available to start the logman controller in the etl file. You can add a second provider to the session by calling logman update:
logman update testlog -p "{a34f5c45-3569-896c-ba85-bf8dcc85aa62}" 0xffff 0xff -rt -ets -o test.etl
The events of several providers within the same session will be recorded in order, each record corresponds to a Sequence Number. Opening a recorded test.etl session in TraceView in the image below.
4. logman is only a controller and does not allow formatting logging on the fly, like TraceView. If you want to automate the collection of information, you can use the following sequence: start logman from launch_wpp_log.bat then tracefmt.exe -rt testlog -display -p tmfpath, having previously generated tmf files with tracepdb.exe. tracefmt allows you to create a display format through the configuration file. The output with the default configuration file is as follows.
Setting RealTime mode for  testlog
Examining C:\Users\user\Desktop\wpp\sample\WppTracing\default.tmf for message formats,  3 found.
Searching for TMF files on path: C:\Users\user\Desktop\wpp\scripts\tmh
[0]08FC.0100::10/15/2014-13:52:43.528 [CppWindowsService]CppWindowsService in OnStart
[0]08FC.0F9C::10/15/2014-13:52:45.513 [CppWindowsService]Test Fromat String 175ms 4460b943-0d39-4627-b53d-5329e470be86
[0]08FC.0F9C::10/15/2014-13:52:47.525 [CppWindowsService]Test Fromat String 175ms 4460b943-0d39-4627-b53d-5329e470be86
[0]08FC.0F9C::10/15/2014
Windbg can also act as a controller using the! Wmitrace extension, but for me this method does not work. Instead, I use the optional flag TraceView -> Windbg Trace.
5. TMF files contain all string trace constants, and if it is necessary to get data from the user's machine, then Tracefmt also works with modified tmf files.
// PDB:  ..\Release\CppWindowsService.pdb
// PDB:  Last Updated :2014-10-10:12:12:25:166 (UTC) [tracepdb]
5ed21a20-2754-8ca0-11c6-9b60845d5180 CppWindowsService // SRC=1.cpp MJ= MN=
#typev 1_cpp401 17 "%0Service failed to resume." //   LEVEL=TRACE_LEVEL_INFORMATION FLAGS=FLAG_INIT FUNC=1::Continue
{
}
вместо
// PDB:  ..\Release\CppWindowsService.pdb
// PDB:  Last Updated :2014-10-10:12:12:25:166 (UTC) [tracepdb]
5ed21a20-2754-8ca0-11c6-9b60845d5180 CppWindowsService // SRC=ServiceBase.cpp MJ= MN=
#typev servicebase_cpp401 17 "%0Service failed to resume." //   LEVEL=TRACE_LEVEL_INFORMATION FLAGS=FLAG_INIT FUNC=CServiceBase::Continue
{
}
Source code, scripts and necessary WPP utilities are available here .
Happy