Money, goods and some statistics. Part two
In the first part of the article, I wrote about the statistical processing of data on prices of goods for more than 30 years.
Here I will try to track the relationship between the individual products.
To be more precise, there is a bit of matlab code and graph images under the cat.
To start, we load the data and calculate the relative prices (more on this in the first part of the article):
Next, we calculate the matrix of correlation coefficients:
Now you can build the graph:
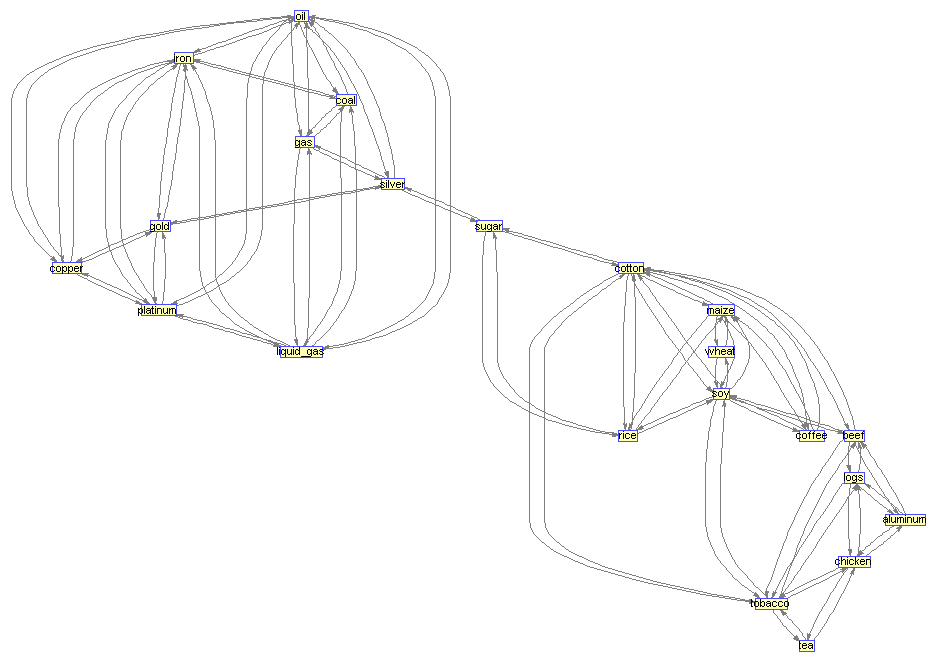
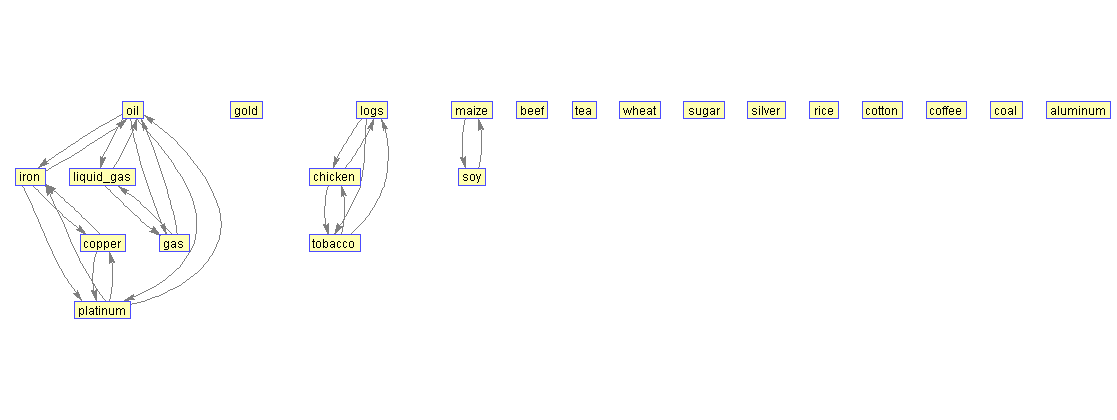
At a correlation threshold of 25%, we see a rather complex system of relationships:
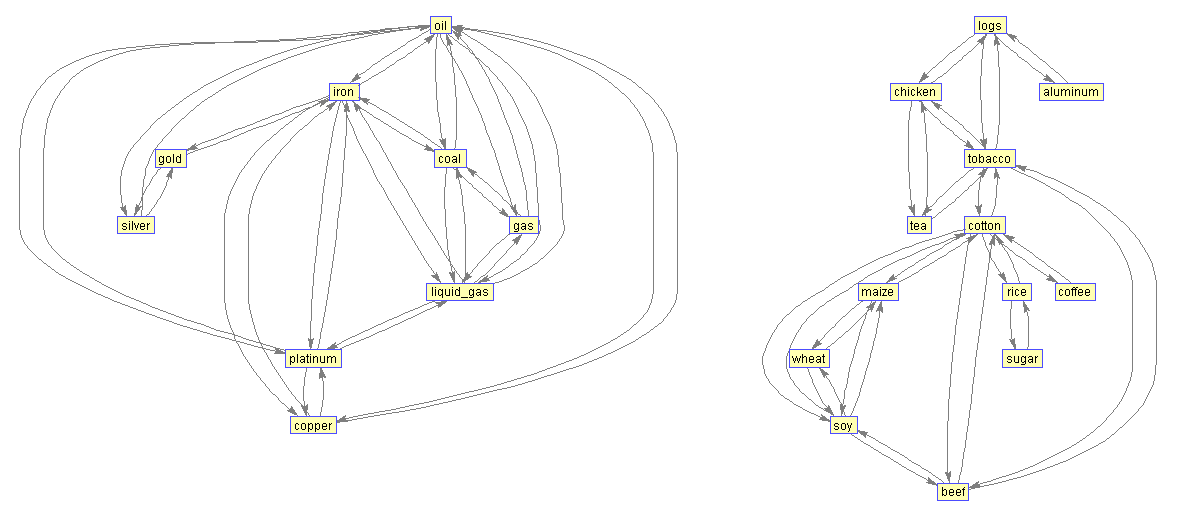
At a threshold of 33%, goods fall into 2 large groups:
1. Oil, coal, gas, liquefied gas, iron ore, platinum, gold, silver and copper.
2. Aluminum, logs, chicken, tea, tobacco, cotton, coffee, rice, sugar, beef, corn, wheat and soy.
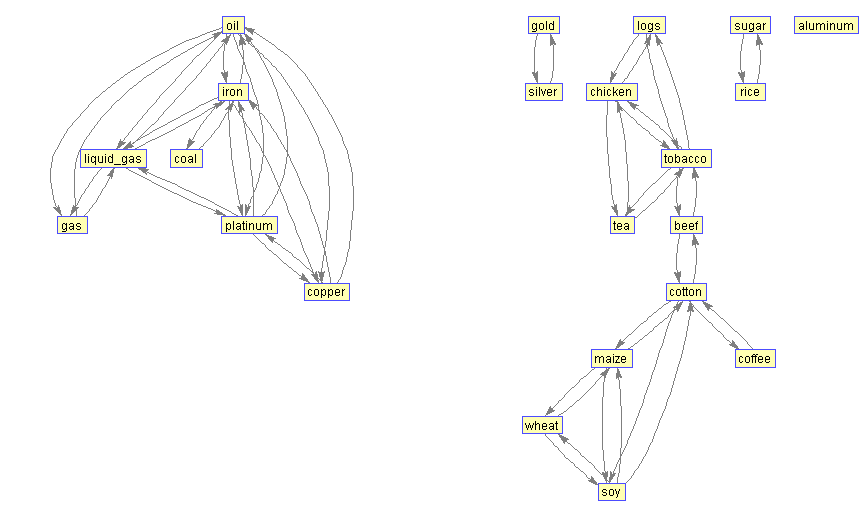
With a correlation of more than 40% of the groups, there are more:
1. Fuel (gas, liquefied gas, coal, oil), as well as iron ore, platinum and copper.
2. Logs, chicken, tea, tobacco, beef, cotton, coffee, corn, wheat and soy.
3. Gold and silver.
4. Sugar and rice.
5. Aluminum - by itself.
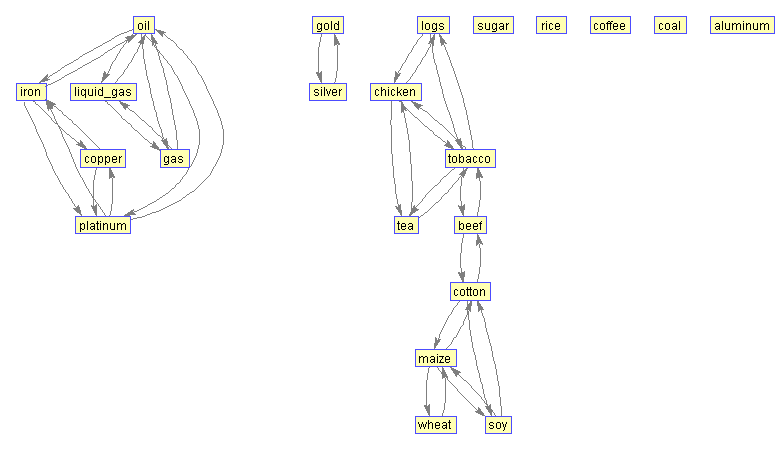
At a threshold of 45%, sugar, rice, coffee and coal fall out of the bond system:
The threshold is 50%. One of the groups falls into two:
1. Logs, chicken, tobacco, beef and tea.
2. Corn, soy and wheat.

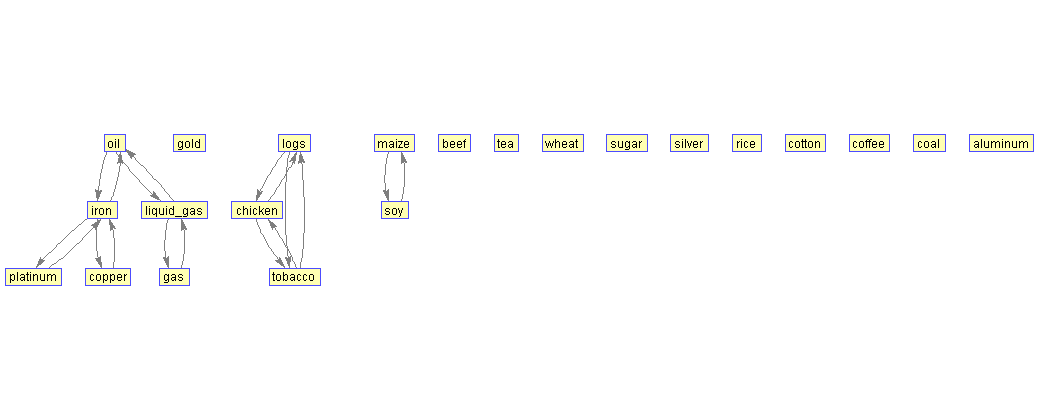
The correlation is more than 55% - the group of gas, liquefied gas, oil, iron, copper and platinum still holds.
The bond between gold and silver is breaking.
Also related: logs with chicken and tobacco, corn with soy.
Threshold at 60%:
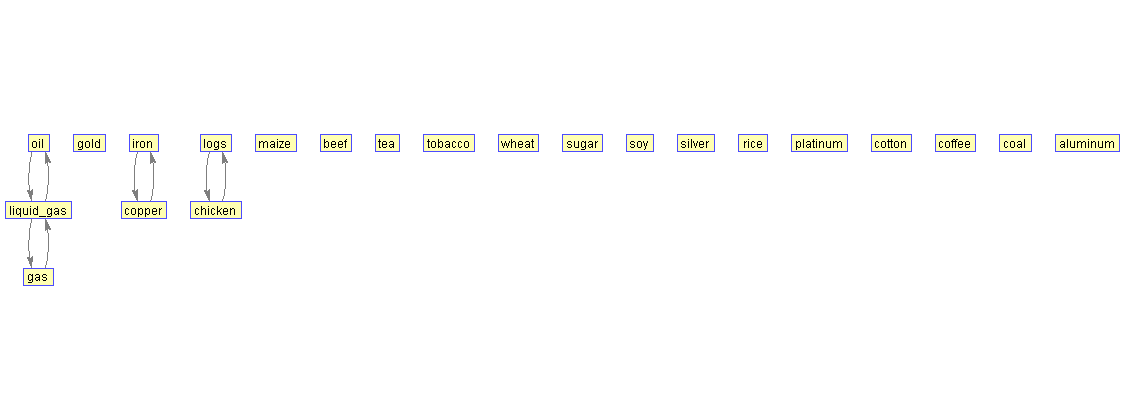
65%. Only 3 groups remain connected:
1. Gas, liquefied gas and oil.
2. Iron ore and copper.
3. Logs and chicken.
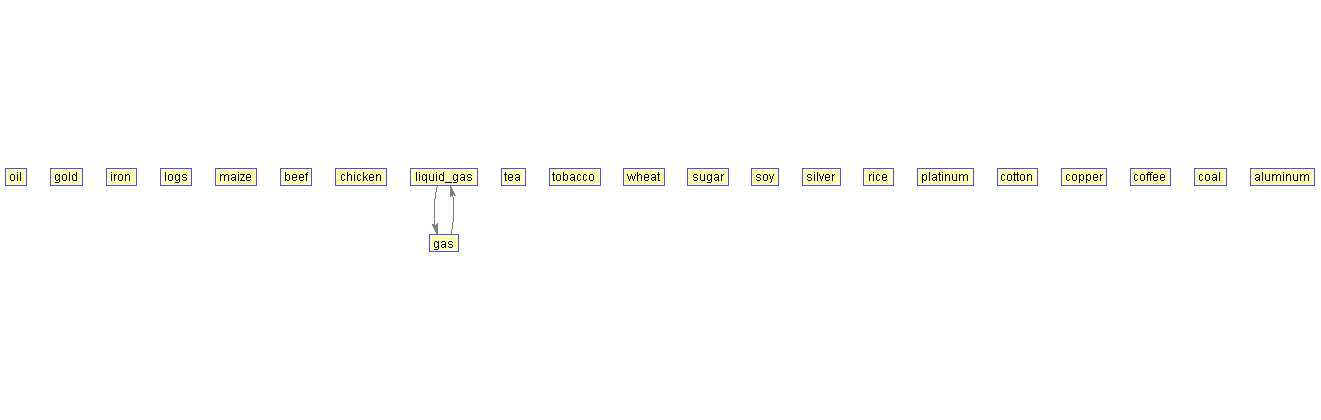
And finally, 70%.
Only gas and liquefied gas prices remain connected:
Here I will try to track the relationship between the individual products.
To be more precise, there is a bit of matlab code and graph images under the cat.
To start, we load the data and calculate the relative prices (more on this in the first part of the article):
xls = xlsread('data.xls');
time = 1:399;
data = xls(time,1:22);
oil = data(:,1);
gold = data(:,2);
iron = data(:,3);
logs = data(:,4);
% и остальные товары
all_goods = [oil gold iron logs maize beef chicken gas liquid_gas tea tobacco wheat sugar soy silver rice platinum cotton copper coffee coal aluminum];
% Наименования товаров, они понадобятся для построения графов:
ids = {'oil','gold','iron','logs','maize','beef','chicken','liquid_gas','gas','tea','tobacco','wheat','sugar','soy','silver','rice','platinum','cotton','copper','coffee','coal','aluminum'};
goods_count = size(all_goods, 2);
geom_average = ones(size(time))'; %'
for i = 1:goods_count
    geom_average = geom_average .* all_goods(:,i);
end
geom_average = geom_average .^ (1/goods_count);
all_goods_rel = zeros(size(all_goods));
for i = 1:goods_count
    all_goods_rel(:,i) = all_goods(:,i) ./ geom_average;
end
Next, we calculate the matrix of correlation coefficients:
R = corrcoef(all_goods_rel);
Now you can build the graph:
% порог корреляции:
threshold = 0.25; % 0.33 0.4 0.45 0.55 0.6 0.65 0.7
% матрица связей графа:
links = R>threshold;
% собственно, построение графа:
bg = biograph(links, ids);
view(bg);
results
At a correlation threshold of 25%, we see a rather complex system of relationships:
At a threshold of 33%, goods fall into 2 large groups:
1. Oil, coal, gas, liquefied gas, iron ore, platinum, gold, silver and copper.
2. Aluminum, logs, chicken, tea, tobacco, cotton, coffee, rice, sugar, beef, corn, wheat and soy.
With a correlation of more than 40% of the groups, there are more:
1. Fuel (gas, liquefied gas, coal, oil), as well as iron ore, platinum and copper.
2. Logs, chicken, tea, tobacco, beef, cotton, coffee, corn, wheat and soy.
3. Gold and silver.
4. Sugar and rice.
5. Aluminum - by itself.
At a threshold of 45%, sugar, rice, coffee and coal fall out of the bond system:
The threshold is 50%. One of the groups falls into two:
1. Logs, chicken, tobacco, beef and tea.
2. Corn, soy and wheat.
The correlation is more than 55% - the group of gas, liquefied gas, oil, iron, copper and platinum still holds.
The bond between gold and silver is breaking.
Also related: logs with chicken and tobacco, corn with soy.
Threshold at 60%:
65%. Only 3 groups remain connected:
1. Gas, liquefied gas and oil.
2. Iron ore and copper.
3. Logs and chicken.
And finally, 70%.
Only gas and liquefied gas prices remain connected: