I am Groot. We do our analytics on events

This spring, I learned about the ability of the HP Vertica database to create queries with event pattern matching. The so-called Events Pattern Matching fell well under the task of analyzing user behavior in ivi.ru products. We decided to try to deal with payment funnels, to search for problem areas on devices, to dive deeper into traffic analysis. Our team really likes how analytics are implemented for Mixpanel and Localytics (it is based on events and their properties), so many ideas were borrowed from them.
What is going on?
Historically, for analytics, we, like most other projects, used Google Analytics. At some point, on our volumes, data sampling reached unimaginable proportions - samples were built on less than 0.5% of the audience. This made it impossible to work with small samples - they were either not visible at all, or the error was catastrophic. Plus, in GA it was impossible to get through a bunch of internal content data, which made deep analysis impossible.This fact served as an occasion to start developing our own system. So was born Groot - internal analytics ivi.ru.
We started with a list of requirements that Groot had to meet:
- No sampling; all data should be stored raw;
- Crossplateness. Since in addition to the site we have very popular applications for mobile platforms and Smart TV, the system should be able to collect data even from the iron, if it is connected to the Internet and our application is installed on it;
- The ability to quickly scale;
- Lack of SPOF;
- Easy setup and deployment.
Architecture
In addition to the HP Vertica column base, we decided to use Apache Kafka and Apache Storm, thereby discovering the great and terrible world of Java.
Apache Kafka - pub / sub system. The main difference from the usual pub / sub implementations is that the subscriber can start reading messages not from the end, but from the beginning or the middle. This solution allows you not to worry about data loss when the subscriber is not working.
Apache Storm is a distributed system for computing large amounts of data. In general, you can talk about Storm for a long time. We liked the integration with kafka out of the box, the ability to scale the system horizontally and a fairly fast speed.
Top view
In general, the system works as follows:
- The client sends a request with JSON information about the event;
- the flask web server asynchronously sends a packet of events to kafka;
- storm constantly picks up new messages from kafka;
- in storm, the topology parses, parses the event, and builds a batch request in vertica and saves the database.
First awkward steps

The first version worked very poorly. More precisely, there were no problems sending data to kafka (everything works out of the box). And we had to tinker with apache storm, since we had to write our topology in java, which no one in our company knows.
The topology in storm consists of the following parts:
- spout - a tap from which data constantly or not arrives . In our case, this is the standard KafkaSpout;
- bolt is the data handler itself. In the "bolts" all the magic of working with data occurs;
- tuple is a standard data structure. In tuple, it can store anything from a prime to an object.
I implemented the simplest bolt that received the event, json parsed and sent a packet to the database. The first tests revealed the following problems:
- Vertica locks the table during recording;
- It is very difficult to track down problem areas in the topology;
- Thread with an insert into the database could send either 1 record, then immediately 100. There was no understanding why this happens;
The first version was very simple: there are columns with id, name, subsite_id, user_id, ivi_id, ts. At the same time, difficulties arose with tables in Vertica, too, proved to be difficult.
As you can see, we did not record any more data. Then, however, they decided to record another browser, operating system, browser window size, version of the flash player. “Ha!”, We thought, and made such a table: We made a second bolt, which extracts additional parameters from JSON, checks the type and writes it all to a new plate.
| id | event_id | name | int_value | string_value | double_value | datetime_value | added |
Everything was perfect, I was glad that it turned out so cool to implement, analysts were glad that you can add any parameters to the events and then build reports on them. At that time, the main source of events for us was the ivi.ru site itself; mobile applications have not yet sent anything. When they started sending, we realized that everything was very bad.
First, let's look at our request for a simple “clicked” -> “bought” funnel for the Chrome browser:
WITH groupped_events AS (
    SELECT MIN(e.ts) as added, MIN(e.user_id) as user_id, e.name,
      MIN(CASE WHEN ep.name = 'browser' THEN string_value ELSE NULL END) as browser
    from events.events as e
      LEFT JOIN events.event_properties as ep ON ep.event_id = e.id
    WHERE e.added >= '2014-07-28' and e.added < '2014-07-29' and e.subsite_id = '10'
    GROUP BY e.id, e.name
)
SELECT COUNT(q.match_id) as count, name
FROM (
       SELECT event_name() as name, user_id, match_id() as match_id
       FROM groupped_events as e
       WHERE e.name IN ('click', 'buy')
       MATCH (
       PARTITION BY user_id ORDER BY e.added ASC
       DEFINE
        click as e.name = 'click' and e.browser = 'Chrome',
        buy as e.name = 'buy'
       PATTERN P as (click buy | click)
       )
     ) as q
GROUP BY q.match_id, q.name;
See the catch? We join the plate (now there are more than a billion records), group it and pull out the desired value through CASE. Of course, when we had a lot of events, all this began to slow down. The requests worked for several minutes, which did not suit us. Analysts complained about requests in half an hour, product experts wanted to make me dark.
Why?
I would also like to clarify the fact that HP Vertica is still a column database. It stores a bunch of data in columns very compactly and allows, for example, adding a new column on the fly, without shoveling all the data. The vertical coped very poorly with our all-in-one plate - she did not understand how to optimize this heap.
Then it was decided to drag the main parameters into the events table in separate columns, and form a list of parameters that are often used in queries. We have done this procedure 2 times. The first time we had a table with 30 columns, the second time, already with 50. After all these manipulations, the average execution time of all queries decreased by 6-8 times.
After all the manipulations, the previous request turned into a simple one:
SELECT COUNT(q.match_id) as count, name
FROM (
       SELECT event_name() as name, user_id, match_id() as match_id
       FROM events.events as e
       WHERE e.name IN ('click', 'buy')
       MATCH (
       PARTITION BY user_id ORDER BY e.added ASC
       DEFINE
        click as e.name = 'click' and e.browser = 'Chrome',
        buy as e.name = 'buy'
       PATTERN P as (click buy | click)
       )
     ) as q
GROUP BY q.match_id, q.name;
On this, the torment with the base we stopped, in this form everyone has been living for about 3 months and we had no claims to it.
Anyway, we left the event_properties table so that we could develop applications faster and not wait for the structure of the main table to be updated.
Apache storm
Having dealt with the HP Vertica, we began to deal with Apache Storm: it was necessary to stabilize the work, remove the separate Thread and be ready for heavy loads.
There are at least two ways to batch process in storm:
- Separate thread with a populated list;
- Using the standard ability to accept tickTuple;
First, we tried the first option and discarded it - the behavior is unstable, the requests went almost to idle. The second option showed us all the charm of Storm:
Using a simple setup when creating a topology, we can specify when we want to get tickTuple (we have 10 seconds). TickTuple is an empty entry that is sent to the main thread every 10 seconds. We can safely track such a record, add everything to the database in the queue or record.
private static boolean isTickTuple(Tuple tuple) {
  return tuple.getSourceComponent().equals(Constants.SYSTEM_COMPONENT_ID)
     && tuple.getSourceStreamId().equals(Constants.SYSTEM_TICK_STREAM_ID);
}
@Override
public void execute(Tuple tuple) {
  if( isTickTuple(tuple) ) {
    executeTickTuple(tuple);
  } else {
    executeTuple(tuple);
  }
}
In
executeTuplewe save the event in the queue LinkedBlockingQueue, and, accordingly, in executeTickTuplewe go in turn and insert a packet into the database. We divided our topology into several
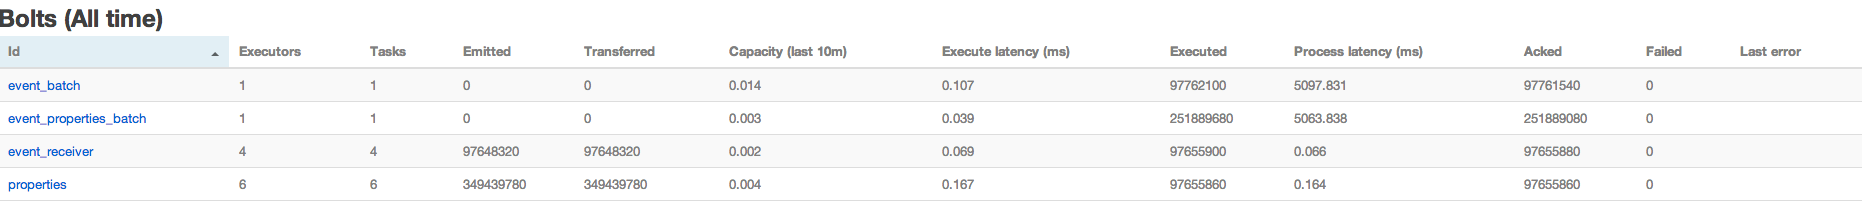
Bolt:- KafkaRecieverBolt - receives data from KafkaSpout, parses JSON and sends it to PropertiesParserBolt;
- PropertiesParserBolt - parses non-standard parameters, sends them to EventPropertiesBatchBolt, sends the entire event further to EventsBatchBolt
- EventsBatchBolt - saves data to the main table;
- EventPropertiesBatchBolt - saves data to the table of additional parameters
Now we can see which of the “bolts” slows down and how much data is chased through it: Topology performance statistics from Storm UI
Afterword
In the next article I will try to tell how to administer and monitor this.