Testing flash storage. Hitachi HUS VM with FMD Modules
The Russian office of Hitachi Data Systems kindly provided us access to its virtual laboratory, in which, specially for our tests, a stand was prepared that included the entry-level storage system Hitachi Unified Storage VM (HUS VM) . The main distinctive feature of the architecture of this solution is the specially developed Hitachi flash drive modules - Flash Module Drive (FMD) . In addition to the flash drive itself, each such module contains its own controller for buffering, data compression, and other additional service operations.

During testing, the following tasks were solved:
The test bench consists of four servers, each connected by four 8Gb connections to two FC switches, each of which has four 8Gb FC connections to the HUS VM storage. By configuring zones on FC switches, 4 independent access paths from each server to the HUS VM storage system are installed.
server ; SHD
As an additional software on the test server installed Symantec Storage Foundation 6.1, which implements:
Testing consisted of 3 groups of tests:
Group 1: Tests that implement a long load of random write type with a change in the size of the block of input / output (I / O).
Record:
Reading:
Mixed Load (70/30 rw)
Minimum latency:
1. The performance (iops) of the array is practically the same for 4K and 8K blocks, which allows us to conclude that the array operates with 8K blocks.
2. The array works better with medium blocks (16K-64K), and shows good bandwidth for any I / O direction on medium blocks.
3. When reading and mixed I / O by middle blocks, the system reaches maximum throughput during operations by middle blocks already at 4-16 jobs. With an increase in the number of jobs, productivity drops significantly (almost 2 times)
4. Monitoring the performance of storage from its interface, as well as the performance of each server separately, showed that the load during the tests was very well balanced between all components of the stand. (Between servers, between fc server adapters and storage, between shelves, between BE SAS interfaces, between moons, raid groups, flash cards).
Record:
Reading:
Mixed Load (70/30 rw)
Minimum latency:
Record:
Reading:
Mixed Load (70/30 rw)
Minimum latency:
For clarity, we compiled a table of maximum HUS VM performance indicators depending on the number of servers
generating the load:
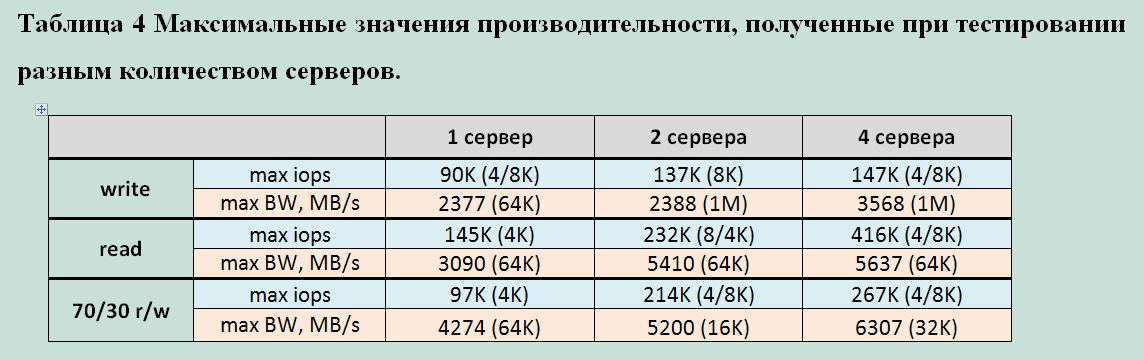
Obviously, the performance of this storage system directly depends on the number of servers connected to it. Most likely, this is caused by internal data flow processing algorithms and their limitations. Based on the indicators taken both from the server and from the storage system, it is safe to say that not a single component in the data path was overloaded. Potentially, 1 used configuration server can generate a larger data stream.
Summing up, we can say that the tests revealed several characteristic features of the HUS VM with FMD modules:
Overall, the HUS VM impressed with a very stable and resilient
Hi-End system with all the reliability, functionality and scalability. Its individual features and advantages of the architecture built on the "smart" modules (FMD).
A separate advantage of the HUS VM is its general task. Using specialized Flash systems does not
exclude the need for conventional disk storage systems, which complicates the overall storage subsystem. An array with Enterprise functionality (replication, snapshot, etc.) supporting a wide selection of drives from mechanical disks to specialized flash modules allows you to choose the optimal combination for any specific task. Fully covering all issues of accessibility, storage and data protection.
PS The author is grateful to Pavel Katasonov, Yuri Rakitin, Dmitry Vlasov and all other company employees who participated in the preparation of this material.
Testing methodology
During testing, the following tasks were solved:
- studies of the degradation of storage performance with a long write load (Write Cliff);
- performance study of HUS VM storage systems with various load profiles;
- study of the effect of the number of servers generating load on storage performance.
Testbed configuration
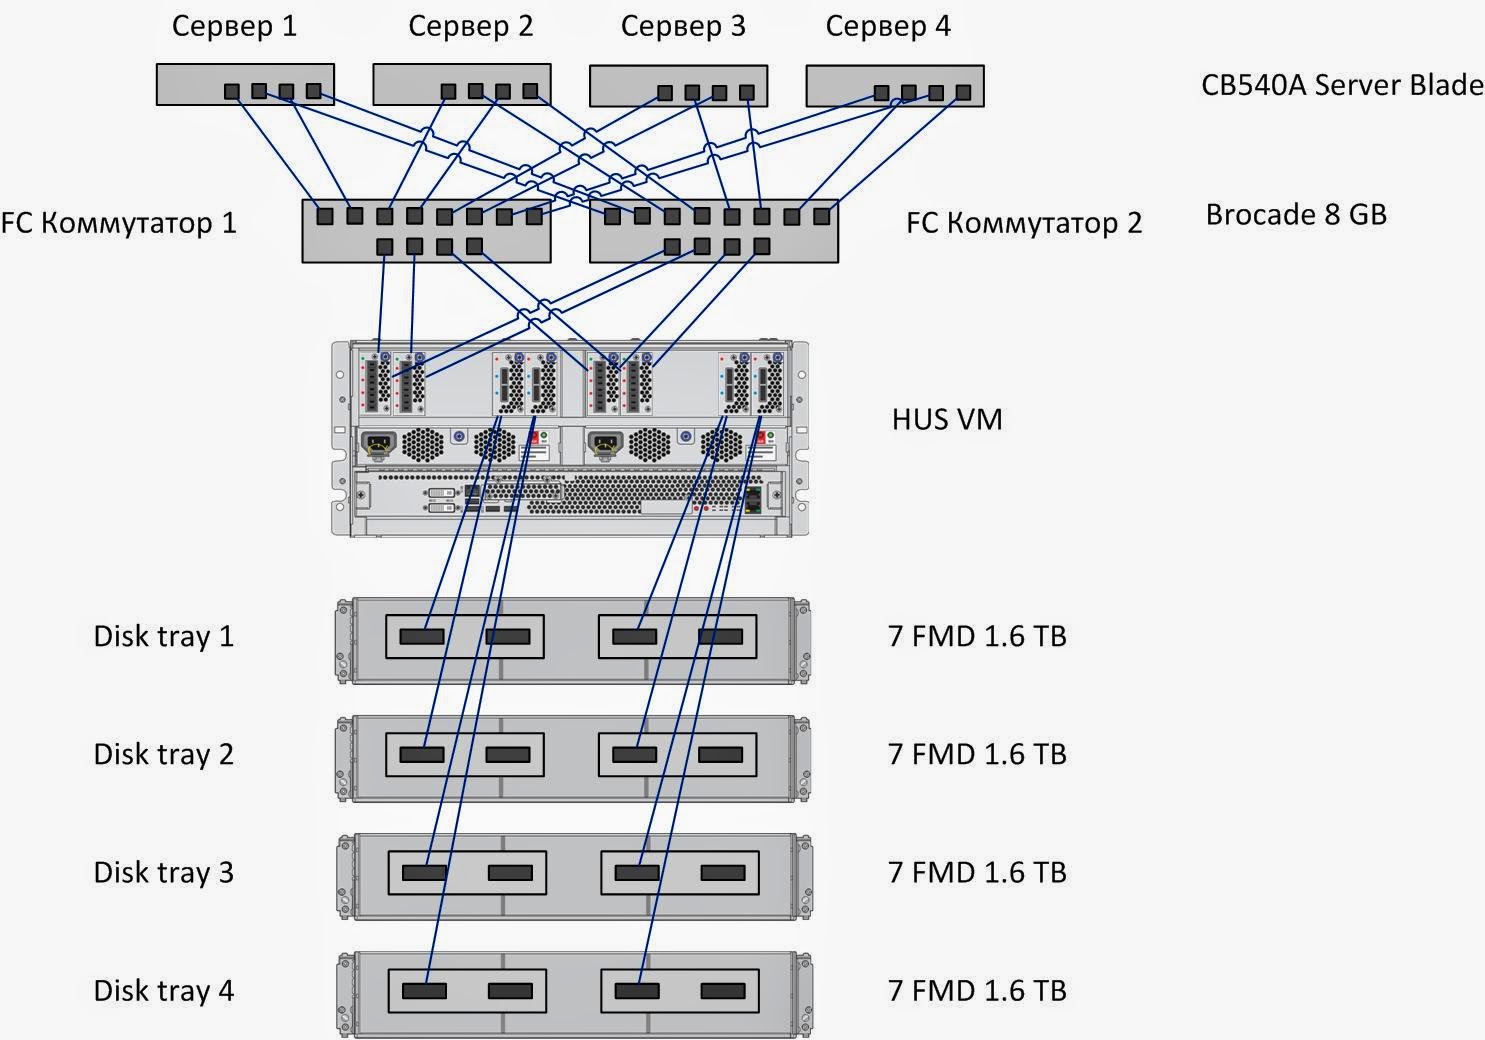 |
| Figure 1. Block diagram of the test bench. |
The test bench consists of four servers, each connected by four 8Gb connections to two FC switches, each of which has four 8Gb FC connections to the HUS VM storage. By configuring zones on FC switches, 4 independent access paths from each server to the HUS VM storage system are installed.
server ; SHD
As an additional software on the test server installed Symantec Storage Foundation 6.1, which implements:
- Functionality of the logical volume manager (Veritas Volume Manager);
- Functionality of fail-safe connection to disk arrays (Dynamic Multi Pathing) for tests of groups 1 and 2. For tests of group 3, native Linux DMP is used)
See the tedious details and all sorts of smart words.
The following settings were made on the test server, aimed at reducing latency of disk I / O:
На СХД выполняются следующие конфигурационные настройки по разбиению дискового пространства:
Для создания синтетической нагрузки (выполнения синтетических тестов) на СХД используется утилита Flexible IO Tester (fio) версии 2.1.4. При всех синтетических тестах используются следующие конфигурационные параметры fio секции [global]:
Для снятия показателей производительности при синтетической нагрузке применяются следующие утилиты:
Снятие показателей производительности во время выполнения теста утилитами iostat, vxstat, vxdmpstat производится с интервалом 5с.
- I / O scheduler changed from “cfq” to “noop” by assigning the noop value to the parameter;
/sys/<путь_к_устройству_Symantec_VxVM>/queue/scheduler - Added the following parameter in the /etc/sysctl.conf minimizing the size of the queue at the level of the logical volume manager Symantec:
«vxvm.vxio.vol_use_rq = 0»; - the limit of simultaneous I / O requests to the device is increased to 1024 by assigning a value of 1024 to the parameter
/sys/<путь_к_устройству_Symantec_VxVM>/queue/nr_requests - disabled checking the possibility of merging I / O operations (iomerge) by assigning a value of 1 to the parameter
/sys/<путь_к_устройству_Symantec_VxVM>/queue/nomerges - отключено упреждающее чтение через присвоение значения 0 параметру
/sys/<путь_к_устройству_Symantec_VxVM>/queue/read_ahead_kb - Увеличен размер очереди на FC адаптерах путем добавления в конфигурационный файл
/etc/modprobe.d/lpfc.conf опции lpfc lpfc_lun_queue_depth=64 (options lpfc lpfc_lun_queue_depth=64);
На СХД выполняются следующие конфигурационные настройки по разбиению дискового пространства:
- На СХД HUS VM из 28 модулей FMD создается 7 RAID-групп RAID1 2D+2D, которые включаются в один DP пул общей емкостью 22,4 TB.
- В этом пуле создаются 32 тома DP-VOL одинакового объема с суммарным объемом, покрывающим всю емкость дискового массива. Каждому из четырех тестовых серверов презентуется по восемь созданных томов, доступных по всем четырем путям каждый.
Программное обеспечение, используемое в процессе тестирования
Для создания синтетической нагрузки (выполнения синтетических тестов) на СХД используется утилита Flexible IO Tester (fio) версии 2.1.4. При всех синтетических тестах используются следующие конфигурационные параметры fio секции [global]:
- thread=0
- direct=1
- group_reporting=1
- norandommap=1
- time_based=1
- randrepeat=0
- ramp_time=10
Для снятия показателей производительности при синтетической нагрузке применяются следующие утилиты:
- iostat, входящая в состав пакета sysstat версии 9.0.4 с ключами txk;
- vxstat, входящая в состав Symantec Storage Foundation 6.1 c ключами svd;
- vxdmpadm, входящая в состав Symantec Storage Foundation 6.1 c ключами -q iostat;
- fio версии 2.1.4, для формирования сводного отчета по каждому профилю нагрузки.
Снятие показателей производительности во время выполнения теста утилитами iostat, vxstat, vxdmpstat производится с интервалом 5с.
Testing program.
Testing consisted of 3 groups of tests:
Ask for details
Тесты выполнялись посредством создания синтетической нагрузки программой fio на блочное устройство (Block Device), представляющее собой логический том типа
При создании тестовой нагрузки используются следующие дополнительные параметры программы fio:
Группа тестов состоит из двух тестов, отличающихся размером блока операций ввода/вывода: тесты на запись блоками 4K и 64K, выполняемые на полностью размеченном СХД. Суммарный объем презентуемых LUN равен полезной емкости СХД. Длительность тестов 5 часов.
По результатам тестов, на основании данных выводимых командой vxstat, формируются графики, совмещающие результаты тестов:
Проводится анализ полученной информации и делаются выводы о:
Тесты выполнялись посредством создания синтетической нагрузки программой fio на блочное устройство (block device), представляющее собой логический том типа
В ходе тестирования исследуются следующие типы нагрузок:
Группа тестов состоит из набора тестов, представляющего собой все возможные комбинации перечисленных выше типов нагрузки. Для нивелирования влияния сервисных процессов СХД (Garbage Collection) на результаты тестов, между тестами реализуется пауза равная объему записанной в ходе теста информации разделенному на производительность сервисных процессов СХД (определяется по результатам выполнения 1-ой группы тестов).
По результатам тестов на основании данных, выводимых ПО fio по завершению каждого из тестов, формируются следующие графики для каждой комбинации следующих типов нагрузки: профиля нагрузки, способа обработки операций ввода-вывода, глубины очереди, совмещающие в себе тесты с разными значениями блока ввода-вывода:
Проводится анализ полученных результатов, делаются выводы о нагрузочных характеристиках дискового массива при jobs=1, при latency<1ms, а так же о максимальных показателях производительности.
Тесты проводится аналогично тестам группы 2, за исключением того, что нагрузка генерируется с одного, а затем с двух серверов и исследуются максимальные показатели производительности. По окончании тестов приводятся максимальные показатели производительности, делается вывод о влиянии количества серверов, с которых генерируется нагрузка на производительность СХД
Группа 1: Тесты, реализующие длительную нагрузку типа random write генерируемой одним сервером.
Тесты выполнялись посредством создания синтетической нагрузки программой fio на блочное устройство (Block Device), представляющее собой логический том типа
stripe, 16 column, stripe unit size=1MiB, созданный с использованием Veritas Volume Manager из 16-ми LUN на тестируемой системе и презентованных одному тестовому серверу. При создании тестовой нагрузки используются следующие дополнительные параметры программы fio:
- rw=randwrite
- blocksize=4K и 64K
- numjobs=64
- iodepth=64
Группа тестов состоит из двух тестов, отличающихся размером блока операций ввода/вывода: тесты на запись блоками 4K и 64K, выполняемые на полностью размеченном СХД. Суммарный объем презентуемых LUN равен полезной емкости СХД. Длительность тестов 5 часов.
По результатам тестов, на основании данных выводимых командой vxstat, формируются графики, совмещающие результаты тестов:
- IOPS как функция времени;
- Bandwidth как функция времени;
- Latency как функция времени.
Проводится анализ полученной информации и делаются выводы о:
- Наличие деградации производительности при длительной нагрузке на запись и на чтение;
- Производительности сервисных процессов СХД (Garbage Collection) ограничивающих производительность дискового массива на запись при длительной пиковой нагрузке;
- Степени влияния размера блока операций в/в на производительность сервисных процессов СХД;
- Объеме пространства, резервируемом на СХД для нивелирования сервисных процессов СХД.
Группа 2: Тесты производительности дискового массива при разных типах нагрузки, генерируемой 4-мя серверами на блочное устройство.
Тесты выполнялись посредством создания синтетической нагрузки программой fio на блочное устройство (block device), представляющее собой логический том типа
stripe, 8 column, stripe unit size=1MiB, созданный с использованием Veritas Volume Manager из 8-ми LUN на тестируемой системе и презентованный тестовым серверам.В ходе тестирования исследуются следующие типы нагрузок:
- профили нагрузки (изменяемые параметры ПО fio: randomrw, rwmixedread):
- случайная запись 100%;
- случайная запись 30%, случайное чтение 70%;
- случайное чтение 100%.
- размеры блока: 1КБ, 8КБ, 16КБ, 32КБ, 64КБ, 1МБ (изменяемый параметр ПО fio: blocksize);
- способы обработки операций ввода-вывода: синхронный, асинхронный (изменяемый параметр ПО fio: ioengine);
- количество процессов, генерирующих нагрузку: 1, 2, 4, 8, 16, 32, 64, 128, 160, 192 (изменяемый параметр ПО fio: numjobs);
- глубина очереди (для асинхронных операций ввода-вывода): 32, 64 (изменяемый параметр ПО fio: iodepth).
Группа тестов состоит из набора тестов, представляющего собой все возможные комбинации перечисленных выше типов нагрузки. Для нивелирования влияния сервисных процессов СХД (Garbage Collection) на результаты тестов, между тестами реализуется пауза равная объему записанной в ходе теста информации разделенному на производительность сервисных процессов СХД (определяется по результатам выполнения 1-ой группы тестов).
По результатам тестов на основании данных, выводимых ПО fio по завершению каждого из тестов, формируются следующие графики для каждой комбинации следующих типов нагрузки: профиля нагрузки, способа обработки операций ввода-вывода, глубины очереди, совмещающие в себе тесты с разными значениями блока ввода-вывода:
- IOPS как функция от кол-ва процессов, генерирующих нагрузку;
- Bandwidth как функция от кол-ва процессов, генерирующих нагрузку;
- Latеncy (clat) как функция от кол-ва процессов, генерирующих нагрузку;
Проводится анализ полученных результатов, делаются выводы о нагрузочных характеристиках дискового массива при jobs=1, при latency<1ms, а так же о максимальных показателях производительности.
Группа 3: Тесты производительности дискового массива при разных типах нагрузки, генерируемой одним и двумя серверами на блочное устройство.
Тесты проводится аналогично тестам группы 2, за исключением того, что нагрузка генерируется с одного, а затем с двух серверов и исследуются максимальные показатели производительности. По окончании тестов приводятся максимальные показатели производительности, делается вывод о влиянии количества серверов, с которых генерируется нагрузка на производительность СХД
Test results
Group 1: Tests that implement a long load of random write type with a change in the size of the block of input / output (I / O).
With a long load, regardless of the size of the block, a drop in performance over time is not fixed. A phenomenon such as “Write Cliff” is missing. Therefore, any maximum performance indicators can be considered average.
Graphs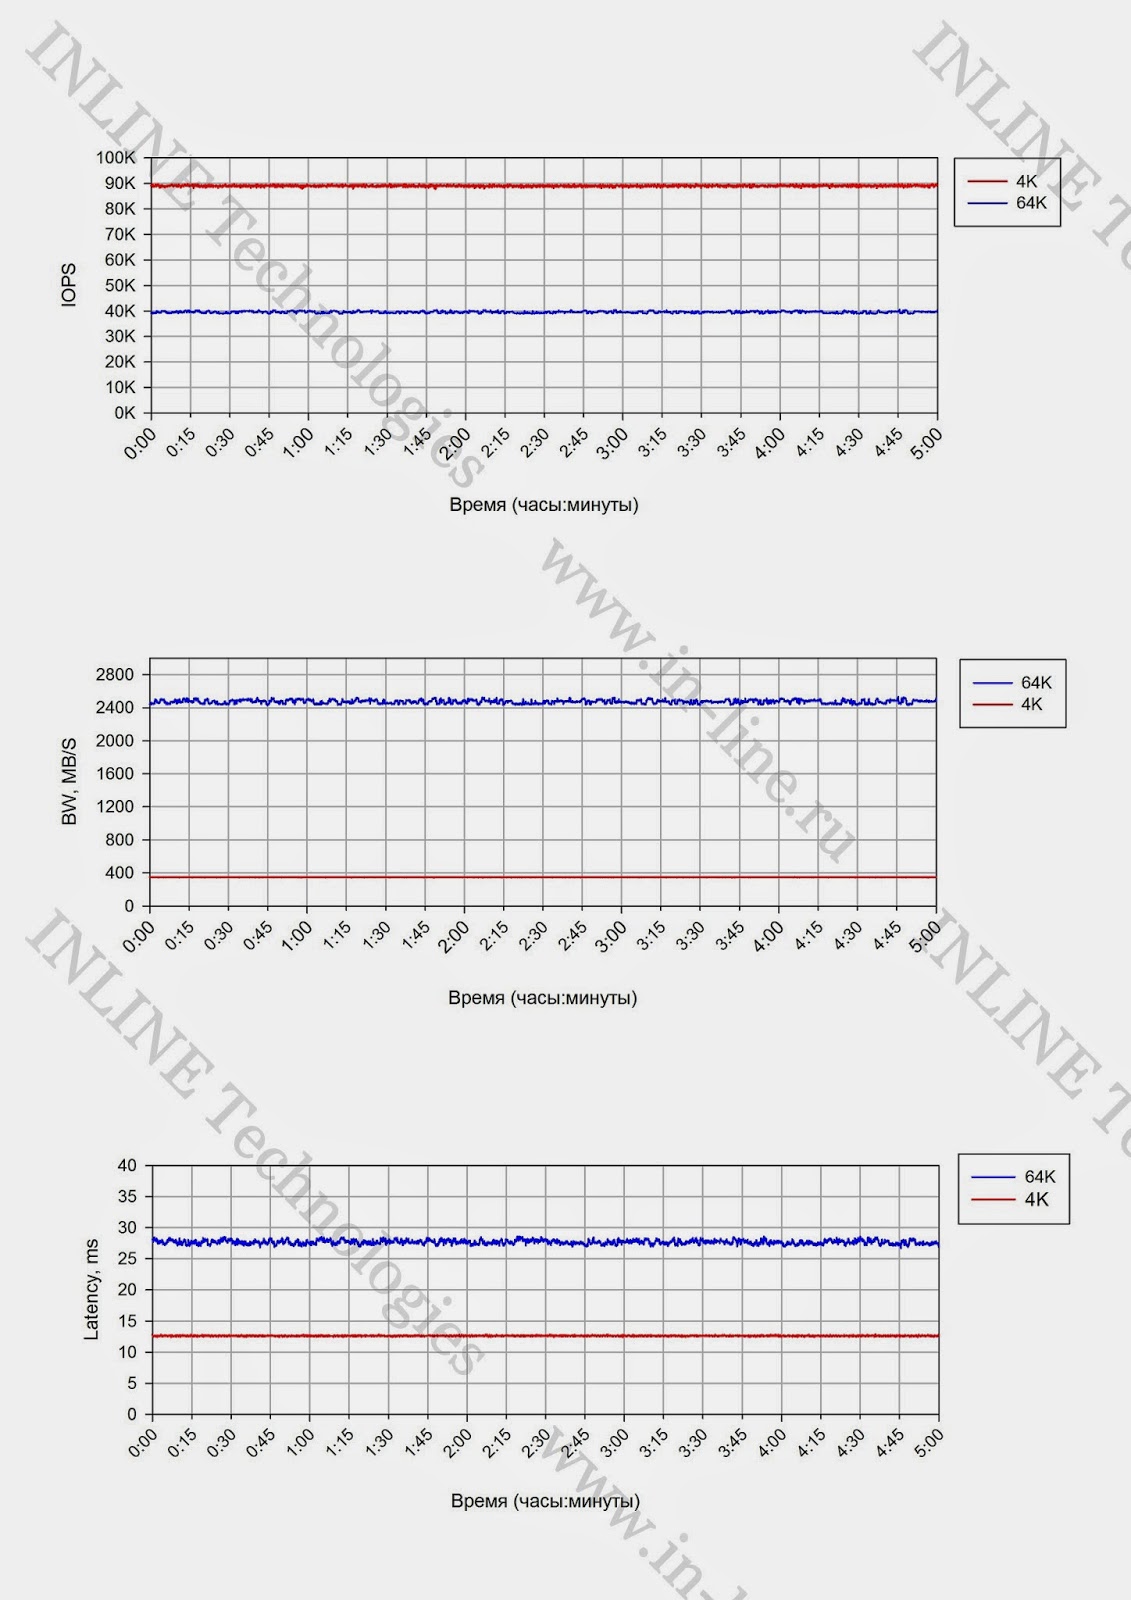
Изменение скорости операций в/в (iops), полосы пропускания (bandwidth) и задержек (Latency) при длительной записи блоками 4K и 64K
|
| Изменение скорости операций в/в (iops), полосы пропускания (bandwidth) и задержек (Latency) при длительной записи блоками 4K и 64K |
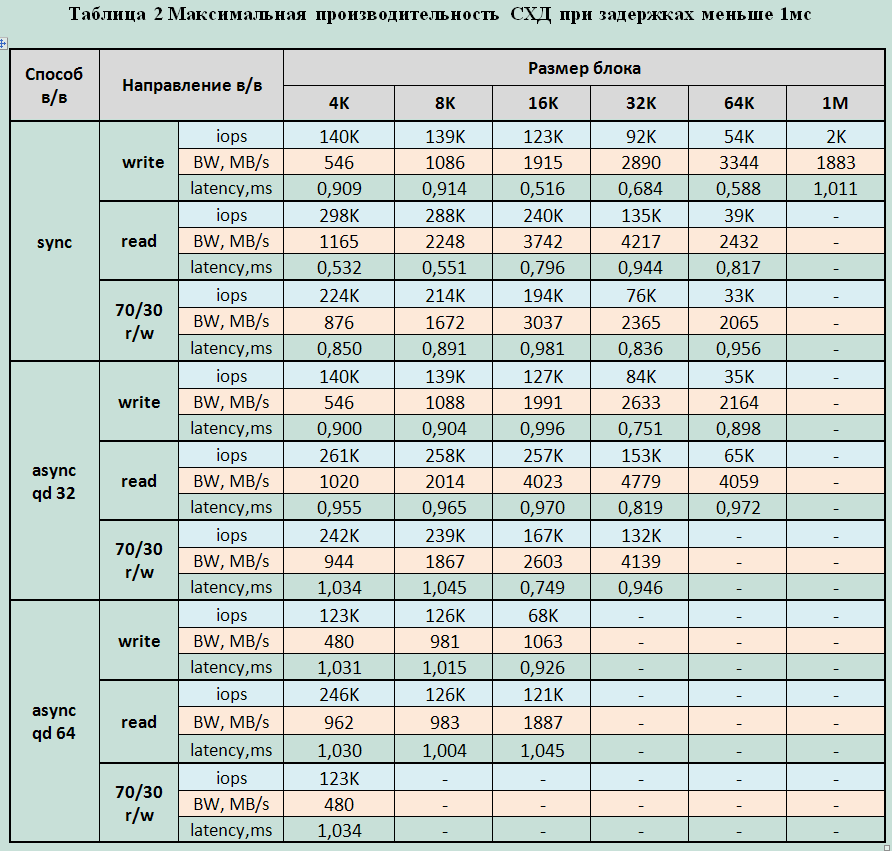
Group 2: Disk array performance tests for different types of load generated by 4 servers on a block device.
Block device performance tables.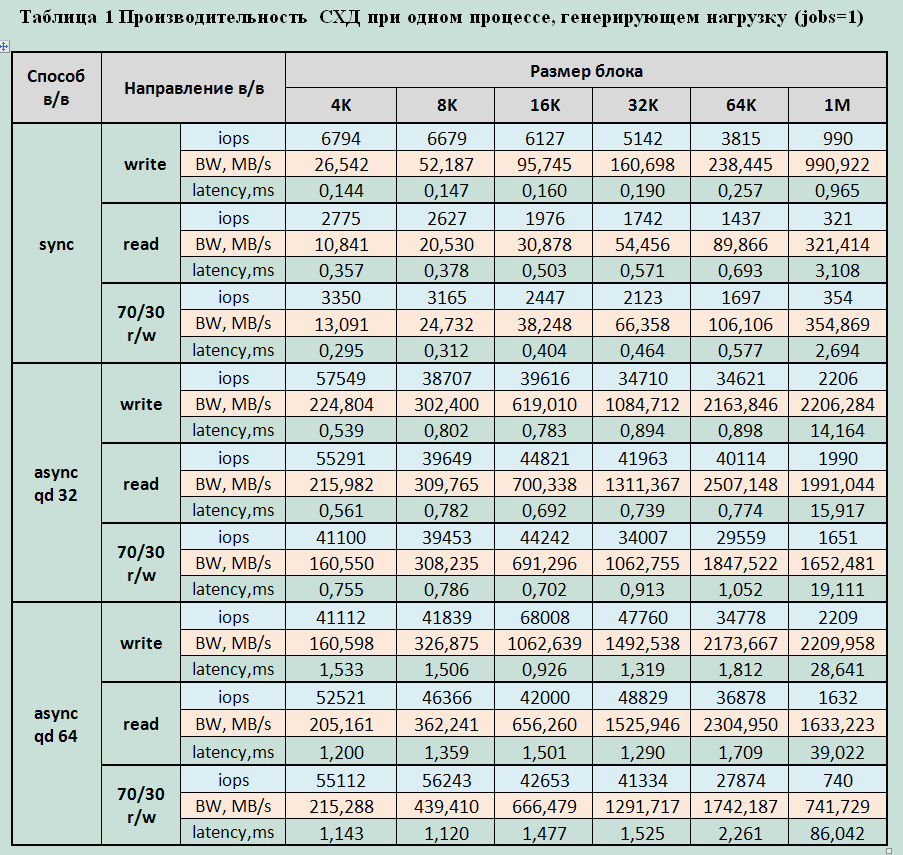

Block device performance graphs.
(Все картинки кликабельны)
| Синхронным способом в/в | Асинхронным способом в/в с глубиной очереди 32 | Асинхронным способом в/в с глубиной очереди 64 | |
| При случайном чтении | 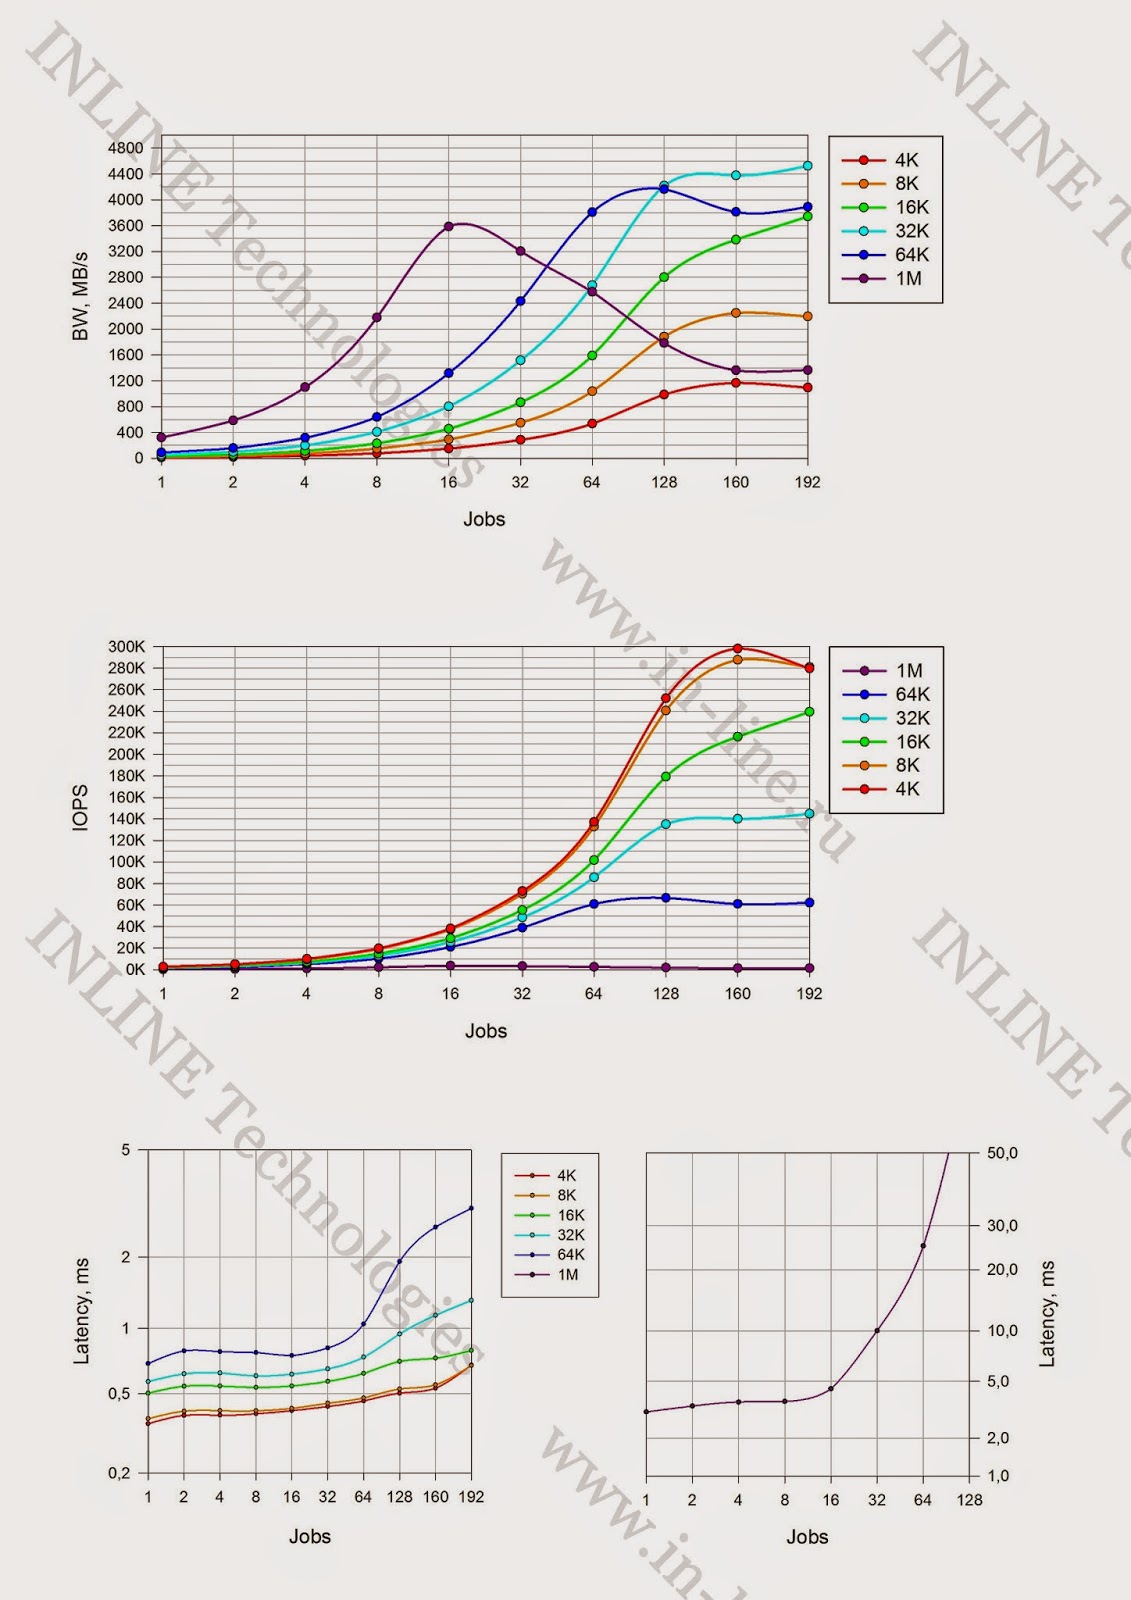 |  |  |
| При случайной записи | 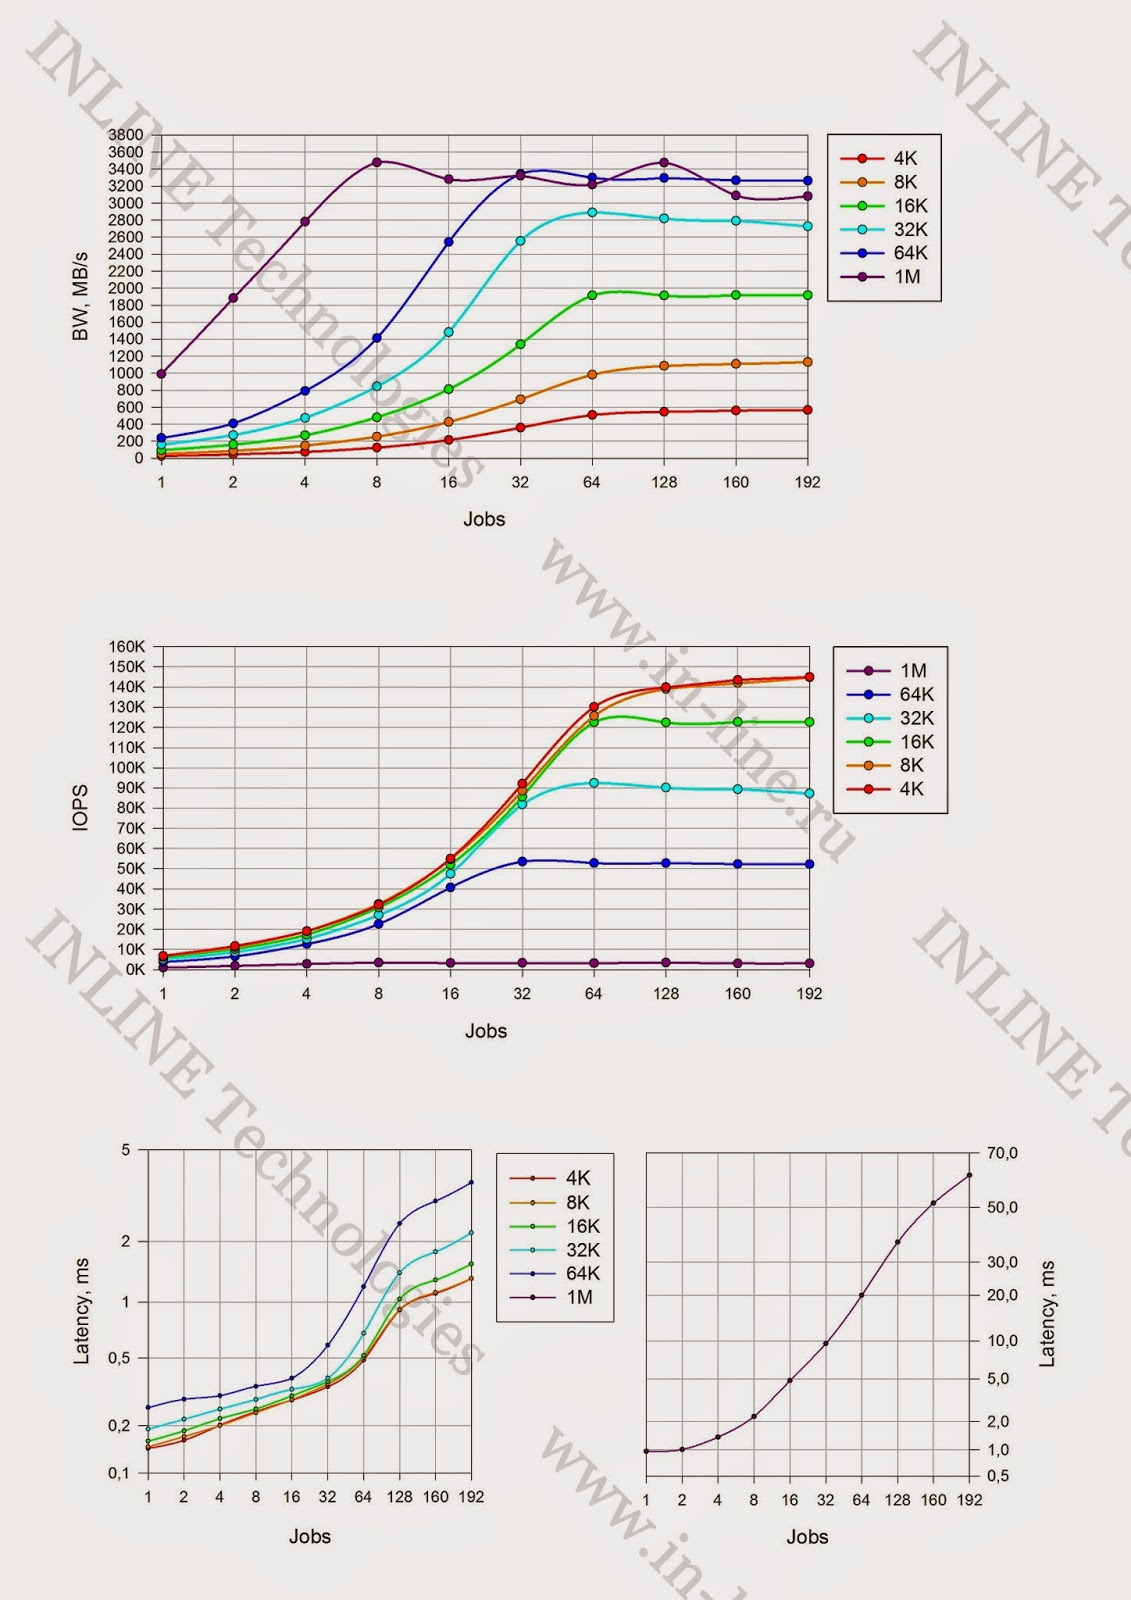 | 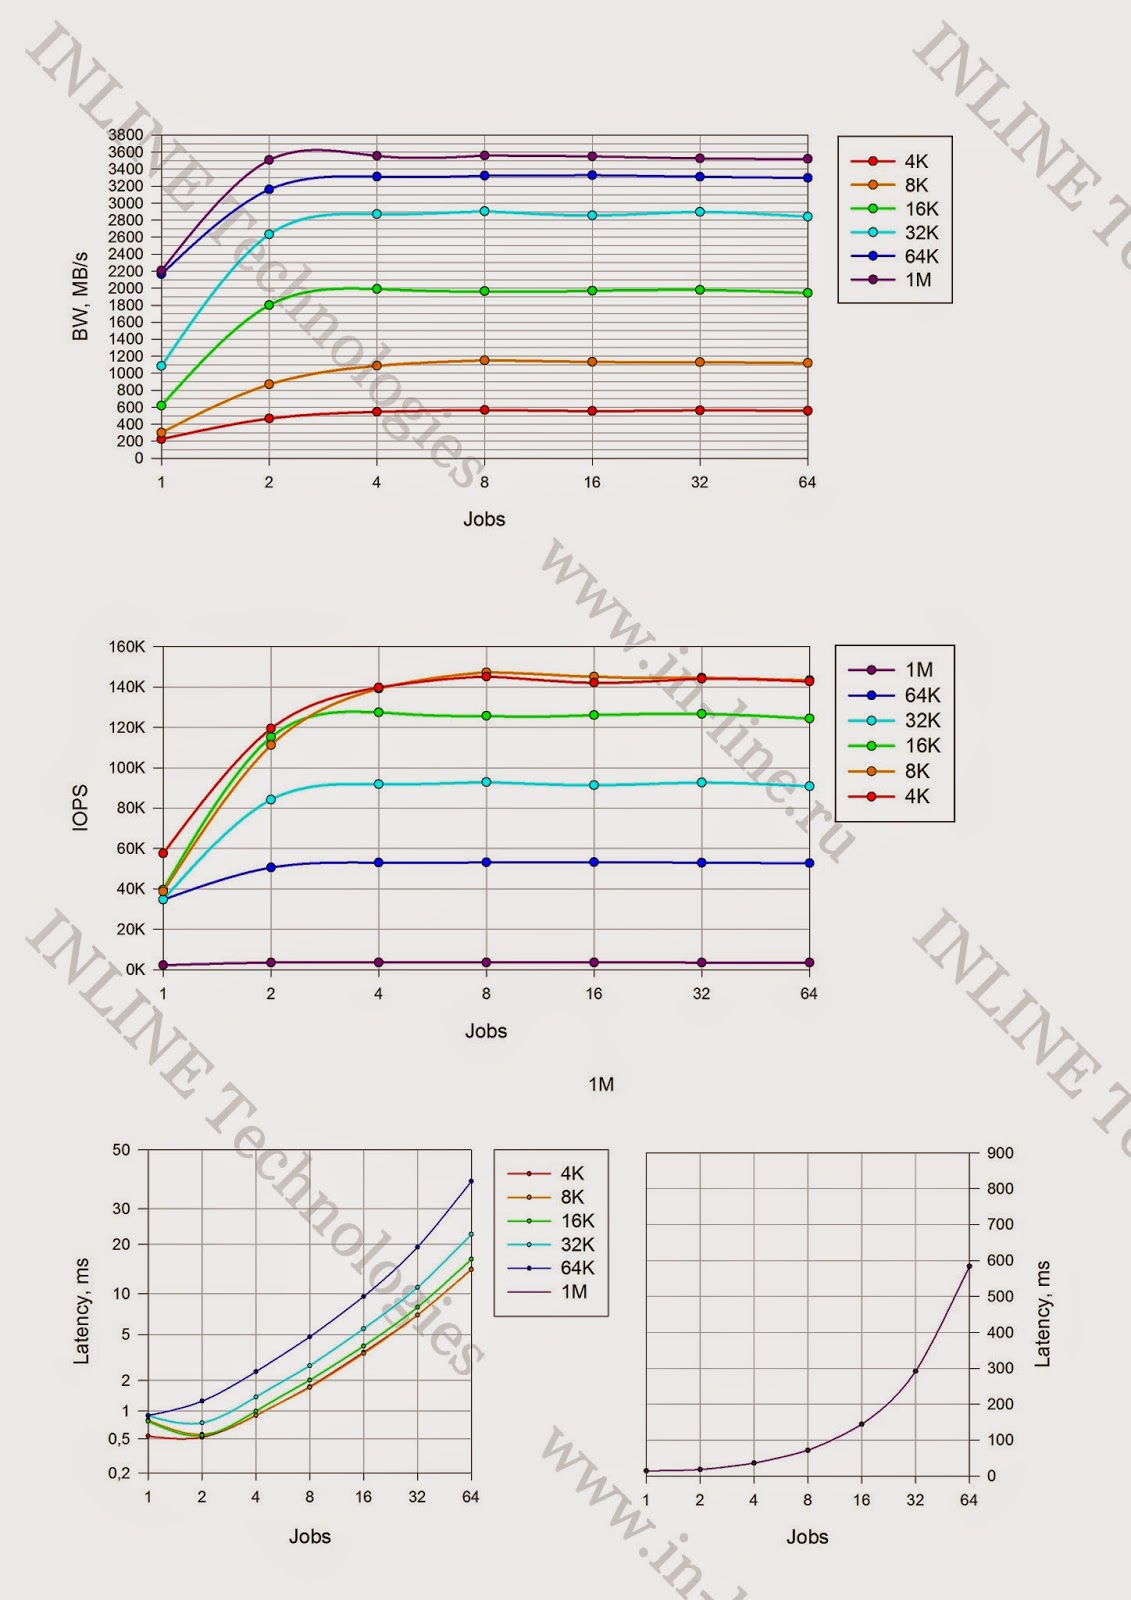 | 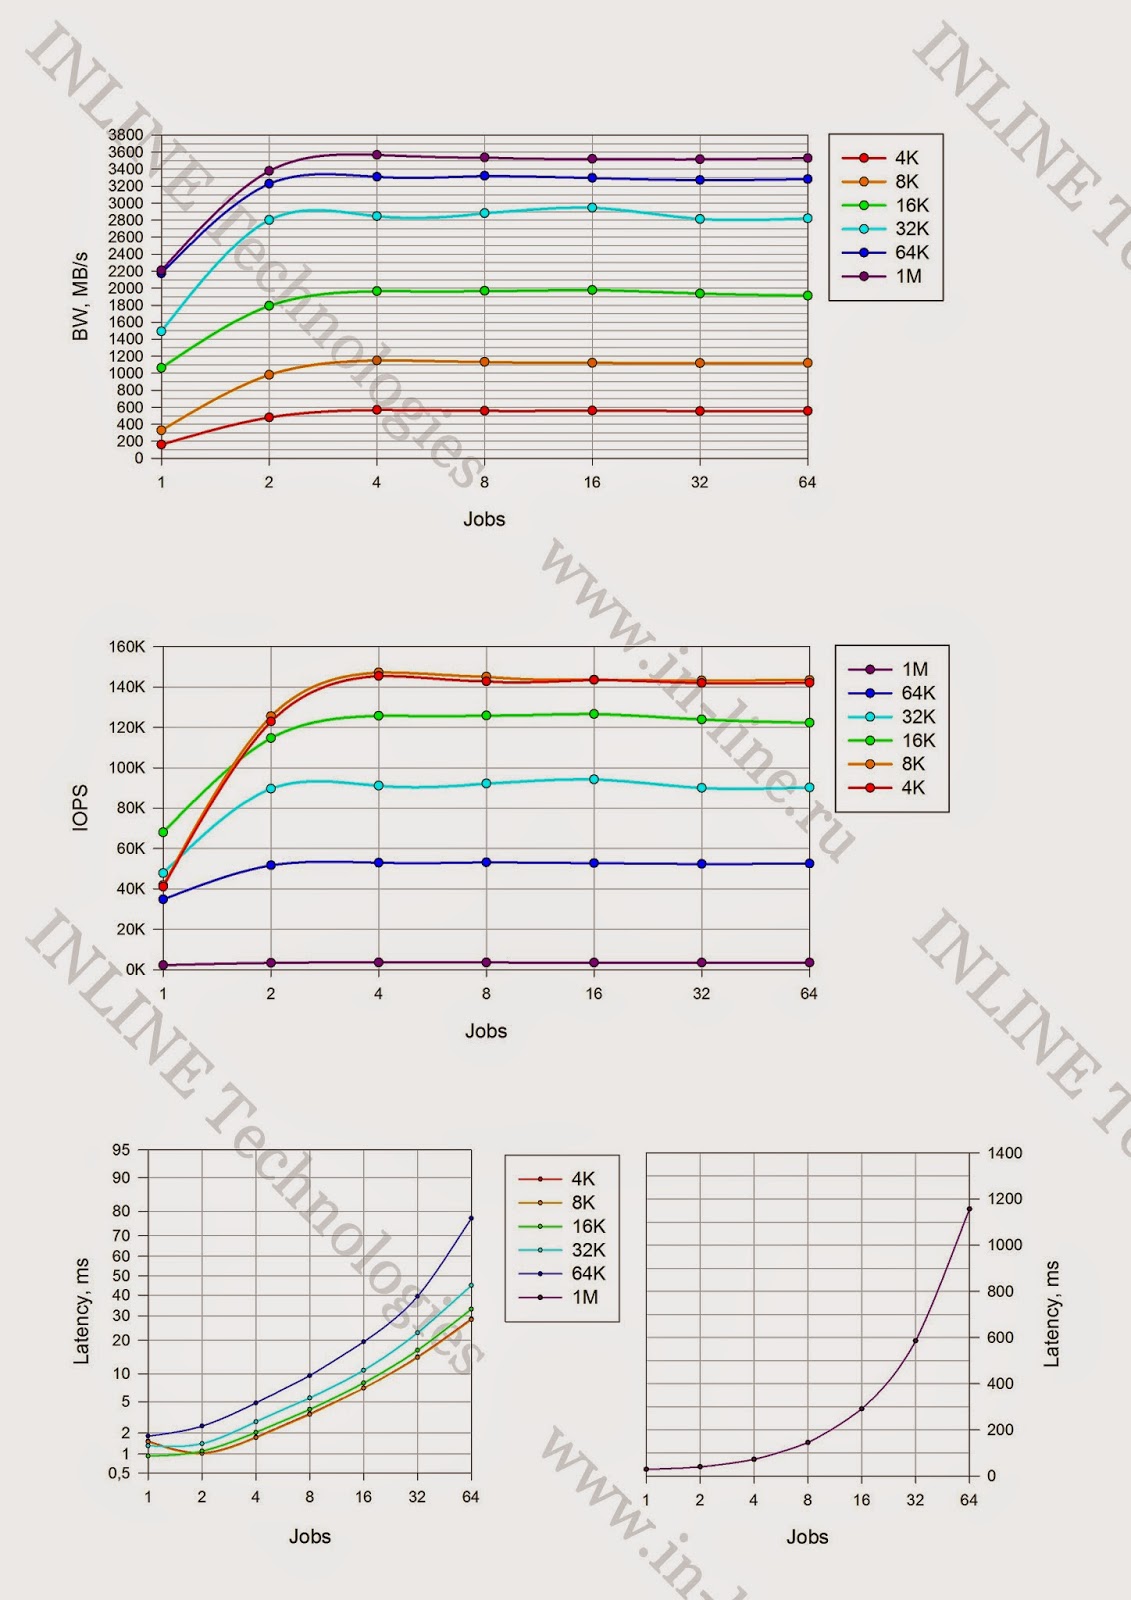 |
| При смешанной нагрузке (70% чтение, 30% запись) |  |  | 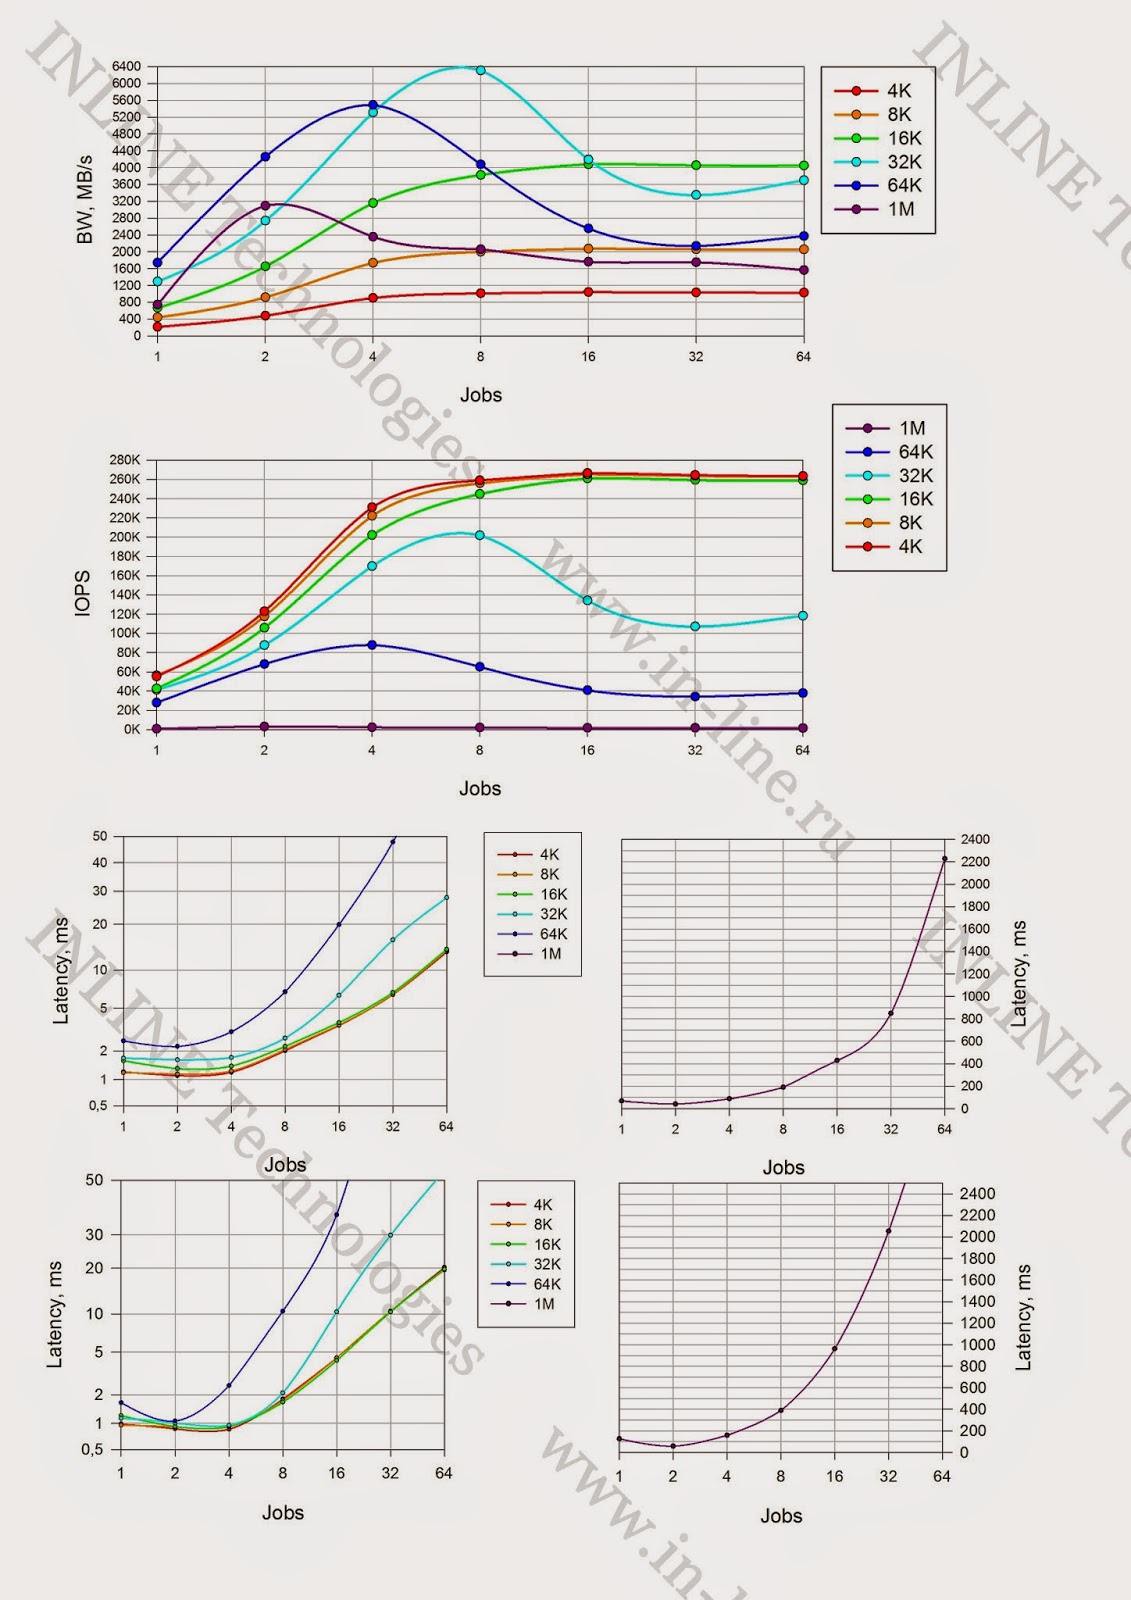 |
Maximum recorded performance parameters:
Record:
- 147000 IOPS at latency 1.7ms (4 / 8KB sync block and async qd32)
- Bandwidth: 3568MB / s for large blocks
Reading:
- 298000 IOPS at latency 0.5ms (8KB sync block);
- 390000 IOPS at latency 1.3ms (8KB async qd 32 block);
- 419,000 IOPS at latency 2ms (4 / 8k async qd64);
- Bandwidth: 5637MB / s for medium blocks (32K).
Mixed Load (70/30 rw)
- 224000 IOPS at latency 0.9ms (4 / 8KB sync block);
- 267000 IOPS with a latency of 3.8ms (4 / 8KB async qd 64 block);
- Bandwidth 6307MB / s for medium units (32K)
Minimum latency:
- When recording - 0.144ms for a block of 4K jobs = 1
- When reading 0.36ms for a block of 4K jobs = 1
1. The performance (iops) of the array is practically the same for 4K and 8K blocks, which allows us to conclude that the array operates with 8K blocks.
2. The array works better with medium blocks (16K-64K), and shows good bandwidth for any I / O direction on medium blocks.
3. When reading and mixed I / O by middle blocks, the system reaches maximum throughput during operations by middle blocks already at 4-16 jobs. With an increase in the number of jobs, productivity drops significantly (almost 2 times)
4. Monitoring the performance of storage from its interface, as well as the performance of each server separately, showed that the load during the tests was very well balanced between all components of the stand. (Between servers, between fc server adapters and storage, between shelves, between BE SAS interfaces, between moons, raid groups, flash cards).
Group 3: Disk array performance tests for different types of load generated by one or two servers on a block device.
Maximum recorded performance parameters during tests from one server:
Record:
- 90,000 IOPS (4 / 8K async jobs = 128 qd = 32/64)
- Bandwidth: 2377MB / s large blocks (64K sync jobs = 64)
Reading:
- 145,300 IOPS (4K async jobs = 32 qd64);
- Bandwidth: 3090MB / s for medium blocks (64K async jobs = 32 qd = 32).
Mixed Load (70/30 rw)
- 97,000 IOPS (4 / 8KB sync4K async jobs = 32 qd = 64);
- Bandwidth MB4274MB / s medium blocks (16K) (64K async jobs = 128 qd = 32)
Minimum latency:
- When recording, 0.25ms for a block of 4K jobs = 1
- When reading 0.4ms for block 4 / 8K jobs = 1
The maximum recorded storage performance parameters during tests from two servers:
Record:
- 137000 IOPS (8KB async and sync (with 1ms delay))
- Bandwidth: 2388MB / s (1M large async and sync blocks)
Reading:
- 232,000 IOPS (4 / 8KB async);
- Bandwidth: 5410MB / s (64K async block, jobs = 2)
Mixed Load (70/30 rw)
- 214000 IOPS (4 / 8KB async block);
- Bandwidth 5200 MB / s for medium blocks (16K)
Minimum latency:
- When recording - 0.138 ms for the block 4K jobs = 1
- When reading 0.357ms for a block of 4K jobs = 1
For clarity, we compiled a table of maximum HUS VM performance indicators depending on the number of servers
generating the load:
Obviously, the performance of this storage system directly depends on the number of servers connected to it. Most likely, this is caused by internal data flow processing algorithms and their limitations. Based on the indicators taken both from the server and from the storage system, it is safe to say that not a single component in the data path was overloaded. Potentially, 1 used configuration server can generate a larger data stream.
findings
Summing up, we can say that the tests revealed several characteristic features of the HUS VM with FMD modules:
- There is no degradation in performance on write operations (write cliff);
- Storage cache size does not affect FMD performance. It is used by internal data processing algorithms. It does not turn off or go into Write-Through mode;
- Maximum system performance directly depends on the number of servers generating the load. 4 servers give 2-4 times more performance than one, although not fully loaded. The reason probably lies in the internal logic of the system.
- The 6.3GB / s bandwidth obtained on 32K blocks looks very decent. Specialized flash solutions give a large number of IOPS on small blocks, but on large ones, apparently, they rest on the throughput of internal buses. Whereas the HUS VM has no such problem.
Overall, the HUS VM impressed with a very stable and resilient
Hi-End system with all the reliability, functionality and scalability. Its individual features and advantages of the architecture built on the "smart" modules (FMD).
A separate advantage of the HUS VM is its general task. Using specialized Flash systems does not
exclude the need for conventional disk storage systems, which complicates the overall storage subsystem. An array with Enterprise functionality (replication, snapshot, etc.) supporting a wide selection of drives from mechanical disks to specialized flash modules allows you to choose the optimal combination for any specific task. Fully covering all issues of accessibility, storage and data protection.
PS The author is grateful to Pavel Katasonov, Yuri Rakitin, Dmitry Vlasov and all other company employees who participated in the preparation of this material.