Seven rules of thumb for experimenting with websites
- Transfer
Translation of the article: Experimenters Rules of Thumb
Web portal owners, from the smallest to large ones like Amazon, Facebook, Google, LinkedIn, Microsoft and Yahoo, are trying to improve their sites by optimizing various metrics, from the number of re-uses to time and revenue. We were attracted to conducting thousands of experiments on Amazon, Booking.com, LinkedIn and Microsoft, and we want to share the family of rules of thumb that we derived from these experiments and their results. We believe that these rules are widely applicable both in the optimization of the web and in the analysis outside the control experiments. Although there are exceptions.
To make these rules more powerful, we will provide real examples from our work, and most of them will be published for the first time. Some rules were voiced earlier (for example, “Speed matters”), but we supplemented them with assumptions that can be used in the design of experiments, and share additional examples that improved our understanding of where speed is particularly important and in which areas of the web pages it is not critical.
This article has two goals.
First : to teach experimenters the rules of good form, which will help optimize sites.
The second is to provide the KDD community with new topics for research on the applicability of these rules, their improvement and the presence of exceptions.
Introduction
Owners of web portals from the smallest to the largest giants are trying to improve their sites. Advanced companies use benchmarking tests (for example, A / B tests) to assess changes. Amazon [E], Etsy [2], Facebook [3], Google [4], Groupon, Intuit [5], LinkedIn [6], Microsoft [7], Netflix [8], ShopDirect [9] , Yahoo and Zynga [10].
We gained experience optimizing websites working with many companies, including Amazon, Booking.com, LinkedIn and Microsoft. For example, Bing and LinkedIn conduct hundreds of parallel experiments at any given time [6; eleven]. Due to the diversity and multiplicity of experiments in which we took part, rules of thumb were formed, which we will describe here. They are confirmed by real projects, but there are exceptions from any rule (we will also tell about them). For example, the “72 rule” is a good example of a useful rule of thumb in the financial field. It argues that you need to multiply the annual growth rate by 72 to roughly determine how many years you will double your investment. In normal situations, the rule is very useful (when the interest rate varies between 4 and 12%), but in other areas it does not work.
Since these rules were formulated according to the results of control experiments, they are well applicable for site optimization and simple analysis, even if sites do not conduct control experiments (although in this case it will not be possible to accurately assess the impact of the changes made).
What you will find in this article:
- Useful rules for experimenting with websites. They are still developing, and it is necessary to further evaluate the breadth of their application and find out the presence of new exceptions to these rules. The importance of using control experiments was discussed in the article "Online Controlled Experiments at Large Scale" [11]
- Improving previous rules. Observations like “speed matters” have already been voiced by other authors [12; 13] and by us [14]. But we made some assumptions when designing an experiment, and we’ll tell you about studies that demonstrate that speed is particularly critical in some areas of the page, and not so in others. We also improved the old rule of “thousands of users”, answering the question of how many people are needed to conduct a control experiment.
- Real examples of control experiments are published for the first time. In Amazon, Bing and LinkedIn, control experiments are used as part of the development process [7; 11]. Many companies that still do not use control experiments can greatly benefit from additional examples of working with changes when new development paradigms are introduced [7, 15]. Companies that already use control experiments will benefit from the described insights.
Control experiments, data and the process of extracting knowledge from data
We will discuss here the control online-experiments, in which users are divided into groups at random (for example, to show different versions of the site). In this case, the division is performed on an ongoing basis, that is, each user will have the same experience throughout the experiment (they will always show the same version of the site). User interaction with the site (clicks, page views, etc.) is fixed, and on its basis key metrics are calculated (CTR, number of sessions per user, revenue from the user). Statistical tests are performed to analyze the calculated metrics. And if the difference between the metrics of the control group (which saw the old version of the site) and the experimental group (which saw the new version) is statistically significant, then we, with a high probability, can say that That the changes made will affect the metrics in the way observed in the experiment. Read more in the “Controlled experiments on the web: survey and practical guide” [16].
We participated in many experiments, whose results were incorrect, and spent a lot of time and effort to understand the causes and find ways to correct it. Many pitfalls are described in articles [17] and [18]. We want to highlight some questions about the data used in conducting online control experiments, and the process of obtaining knowledge from these data:
- The data source is the real sites that we talked about above. There will be no artificially generated information. All examples are based on real user interaction, and metrics are calculated after removing the bots [16].
- The user groups in the examples are taken randomly from a uniform distribution of the target audience (ie, users who, for example, have to click on the link to see the changes being studied) [16]. The method of user identification depends on the site: if the user is not logged in, cookies are used, and if he is logged in, his login is used.
- The size of user groups, after clearing bots, ranges from hundreds of thousands to millions (the exact values are shown in the examples). In most experiments, this is necessary so that minor differences in metrics have a high statistical significance.
- Reported results were statistically significant at p-value <0.05, and usually even less. The surprising results (in rule 1) were reproduced at least one more time, so that the cumulative p-value, based on the Fisher cumulative probability test, mattered much less than what was needed.
- Each experiment is our personal experience, tested by at least one of the authors for the presence of standard pitfalls. Each experiment was conducted at least a week. The audience shares that demonstrated the site variants were stable throughout the experiment (to avoid the Simpson paradox effect) and the relationships between the audience that we observed during the experiment coincided with the relationships that we asked when the experiment started [17].
Rules of thumb for experimentation
The first three rules relate to the impact of changes on key metrics:
- small changes can have a big impact;
- changes rarely have a large positive impact;
- your attempts to replicate the stellar successes claimed by others will most likely not be so successful.
The following 4 rules are independent of each other, but each of them is very useful.
Rule # 1: Small changes can have a GREAT effect on key metrics.
Anyone who has experienced the life of sites knows that any small change can have a big negative impact on key metrics. A small error in JavaScript can make payment impossible, and small bugs that destroy the stack can cause the server to crash. But we will focus on positive changes in key metrics. The good news is that there are many examples where a small change led to an improvement in a key metric. Bryan Eisenberg wrote that removing the coupon entry field in the purchase form increased the conversion by 1000% on the Doctor Footcare website [20]. Jared Spool wrote that the removal of the requirement to register when buying brought a large retailer $ 300,000,000 per year [21].
However, we did not see such significant changes in the process of personally conducted experiments. But we have seen significant improvements from small changes with a surprisingly high return on investment (high ratio of profits to the cost of invested effort).
We also want to note that we are discussing a stabilized effect, not a “flash on the Sun” or a feature with a special news / viral effect. An example of something that we are not looking for was described in the book “Yes!: 50 Scientifically proven ways to be Persuasive” [22]. Collen Szot, the author of a television program that broke a 20-year record for sales on the “store on the couch” channel, replaced three words in a standard informational running line, which led to a huge jump in the number of purchases. Collin instead of the familiar and familiar to all the phrase "Operators are waiting, please call now" output "if the operators are busy, please call again." The authors explain this with the following sociological evidence: viewers think that if the line is busy, then the same people as they are, watching the news channel also ring.
If tricks like the one mentioned above are used regularly, their effect is leveled, because users get used to it. In control experiments in such cases, the effect quickly disappears. Therefore, we recommend to conduct an experiment for at least two weeks and follow the dynamics. Although in practice such things are rare [11; 18]. Situations in which we observed a positive effect of such changes were associated with recommender systems, when a change in itself gives a short-term effect or when finite resources are used for processing.
For example, when LinkedIn changed the “people you may know” feature algorithm, it caused only a one-time splash of click-rate metrics. Moreover, even if the algorithm worked much better, then each user knows a finite number of people, and after he contacted his main acquaintances, the effect of any new algorithm will fall.
Example: Opening links in a new tab. A series of three experiments
In August 2008, MSN UK conducted an experiment on more than 900,000 users, in which a link to HotMail opened in a new tab (or a new window with older browsers). We previously reported [7] that this minimal change (one line of code) led to an increase in the involvement of MSN users. Engagement, measured by the number of clicks per user on the home page, increased by 8.9% among those users who clicked on HotMail.
In June 2010, we replicated the experiment to an audience of 2.7 million MSN users in the United States, and the results were similar. In fact, this is also an example of features with the effect of novelty. On the first day of her roll out to all users, 20% of reviews had a negative character. In the second week, the proportion of those who were dissatisfied fell to 4%, and during the third and fourth week to 2%. Improvement in the key metric has been stable throughout this time.
In April 2011, MSN in the United States conducted a very large experiment on more than 12 million users, who were opened to a page with search results in a new tab. Involvement, measured in user clicks, increased by a whopping 5%. It was one of the best features related to user engagement that MSN ever implemented, and it was a trivial change in code.
All major search engines are experimenting with opening links in new tabs / windows, but the results for the “search results page” are not so impressive.
Example: Font Color
In 2013, Bing conducted a series of experiments with color fonts. The winning version is shown in Figure 1 on the right. Here's how the three colors were changed:

The cost of such changes? Penny: just replace multiple colors in a CSS file. And the result of the experiment showed that users achieve their goals (a strict definition of success is a commercial secret) faster, and the monetization from this refinement has increased by more than $ 10 million per year. We were skeptical of such surprising results, so we reproduced this experiment on a much larger sample of 32 million users, and the results were confirmed.

Example: Correct sentence at the right time.
Back in 2004, the Amazon start page contained two slots, the contents of which were tested automatically, so that the content that better improves the target metric is displayed more often. The offer to get an Amazon credit card fell into the top slot, which was surprising, because This offer had a very small number of clicks on the show. But the fact is that this application was very profitable, therefore, despite the small CTR, the expected value was very high. But was the place for such an ad successfully chosen? Not! As a result, the offer along with a simple example of the benefit was moved to the shopping cart, which the user sees after adding the product. Thus, the profitability of this proposal was emphasized on the example of each product. If the user has added a product to the basket,

A control experiment showed that such a simple change brought tens of millions of dollars a year.
Example: Antivirus
Advertising is a profitable business, and “free” software installed by users often contains a malicious part that litters pages with ads. For example, Figure 2 shows what a Bing results page looks like for a user with a malicious program that has added a lot of ads to the page (highlighted in red).
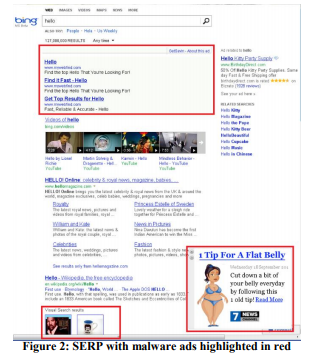
Users usually do not even notice that so much advertising shows not the site that they visit, but the malicious code that they accidentally installed. The experiment was difficult to implement, but relatively simple ideologically: changing the basic procedures that modify the DOM, and limiting the applications that can modify the page. The experiment was conducted on 3.8 million users, on whose computers there was a third-party code that edited the DOM. The test group has blocked these changes. The results showed an improvement in all key metrics, including such a guiding one as the number of sessions per user, i.e. people came to the site more often. In addition to this, users performed their tasks more successfully and faster, and annual revenues increased by several million dollars. Page loading speed
Two other small changes to Bing, which are strictly confidential, took days of development, and each led to an increase in advertising revenue of nearly $ 100 million a year. A quarterly Microsoft report in October 2013 noted: "Advertising revenue from the search increased by 47% due to an increase in the profits from each search and each page." Those two changes made a significant contribution to the profit growth mentioned.
After these examples, you might think that organizations should focus on a lot of small changes. But below you will see that this is not the case at all. Yes, breakthroughs occur on the basis of small changes, but they are very rare and unexpected: in Bing, probably one of 500 experiments achieves such a high ROI and a reproducible positive result. We do not claim that these results will be reproducible on other domains, we just want to get the message across: conducting simple experiments is worth the effort and may eventually lead to a breakthrough.
The danger arising from focusing on small changes is incrementalism: a self-respecting organization must have a set of changes with a potentially high ROI, but at the same time there should be several major changes in the plans in order to make a big break [23].
Rule # 2: Changes rarely have a big positive effect on key metrics.
As Al Pacino said in the movie "Every Sunday," victory is given centimeter by centimeter. On sites like Bing hundreds and thousands of experiments annually spin. Most fail, and those that succeed affect the key metric by 0.1% -1.0%, adding their own drop to the overall impact. Small changes with great effect, described in the previous rule, happen, but they are rare.
It is important to note two things:
- Key metrics are not something specific to a particular feature that can be easily improved, but a metric that is relevant to the entire organization: for example, the number of sessions per user [18] or the time to reach the user goal [24].
When developing a feature, it is very easy to significantly improve the number of clicks on this feature (or another feature metric) simply by highlighting it or making it larger. But to increase the CTR of the entire page or the entire user experience - that's where the challenge. Most features only drive clicks on the page, redistributing them between different areas. - Metrics should be divided into small segments, so they are much easier to optimize. For example, can a team easily improve metrics for Bing weather queries or buying TV programs on Amazon? adding a good comparison tool. However, a 10 percent improvement in key metric will dissolve in the metrics of the entire product due to the size of the segment. For example, a 10 percent improvement on a 1 percent segment will affect the entire project by about 0.1% (approximately, because if the segment metrics differ from the average, then the influence may also differ).
The importance of this rule is great because false positive errors occur during experiments. They have two kinds of reasons:
- The first are caused by statistics. If we conduct a thousand experiments a year, then the probability of a false positive error of 0.05 leads to the fact that for a fixed metric we get a false positive result hundreds of times. And if we use several metrics that do not correlate with each other, then this result only increases. Even large sites like Bing do not have enough traffic to increase sensitivity and draw conclusions with lower p-value for such metrics as the number of sessions per user.
- The latter are caused by poor architecture, data anomalies, bugs, or tool errors.
The results at the border of statistical significance are considered preliminary and should be reproduced to confirm the result [11]. This can be formalized using the Bayesian inference [25; 26]. If the probability of a true positive result is small, then most experiments will fail to improve the key metric, and the probability of a positive impact on the key metric with a p-value close to 0.05 will still be small. Let be Then:
Substituting if we have a preliminary success probability equal to ⅓ (as we said in [7], this is the average value among the experiments at Microsoft), then the a posteriori likely true-positive statistically significant experiment is 89%. And if an experiment is one of those about which we spoke in the first rule, when only 1 out of 500 contains a breakthrough solution, then the probability drops to 3.1%.
The funny consequence of this rule is the fact that it is much easier to hold on to someone than to develop alone. Decisions made in a company that focuses on statistical significance are more likely and you will have a positive effect. For example, if we have a success rate of experiments equal to 10-20%, then if we take tests of those features that were successful and rolled out to fight in other search engines, then our success rate will be higher. The reverse is also true: other search engines must also test and enter into battle the things that Bing has implemented.
With experience, we learned not to trust results that look too good to be true. People react differently to different situations. They suspect something is wrong and study the negative results from experiments with their great new features, ask questions and dive deeper into the search for the reasons for this result. But if the result is simply positive, then suspicion recedes and people begin to celebrate, not to study more deeply and not to look for anomalies.
When the results are exceptional, we are accustomed to follow the law of Twyman [27]: Everything looks interesting or different - usually false.
Twyman's law can be explained using Bayesian inference. In our experience, we knew that a breakthrough was rare. For example, several experiments significantly improved our guiding metric, the number of sessions per user. Imagine that the distribution that we encounter in experiments is normal with a center at point 0 and with a standard deviation of 0.25%. If the experiment showed +2% to the value of the key metric, then we invoke the law of Twyman and say that this is a very interesting result, which is at a distance of 8 standard deviations from the average and has a probability of 10 -15, excluding other factors. Even with statistical significance, the preliminary wait is so strong that we will postpone the celebration of success and delve into the search for the causes of the false positive error of the second type. Twyman's law is often applied to the proof that
Р=NP. Today, no site editor would be happy if such proof comes to him. Most likely, he will immediately reply with a standard answer: “in your proof that P = NP, an error was made on page X”.Example: Office Online Surrogate Metric
Cook and his team [17] talked about an interesting experiment they conducted with Microsoft Office Online. The team tested the new page design in which the button was strongly highlighted, calling for paying for the product. The key metric that the team wanted to measure: the number of purchases per user. But tracking real purchases required modifying the billing system, and at the time it was difficult to do. Then the team decided to use the “clicks leading to the purchase” metric and apply the formula
(количество кликов) * конверсию = количество покупокwhere the conversion from clicks to purchase is taken.To their surprise, in the experiment, the number of clicks decreased by 64%. Such shocking results forced us to analyze the data more deeply, and it turned out that the assumption of a stable conversion from a click to a purchase is false. The experimental page that showed the cost of the product attracted less clicks, but those users who clicked on it were better qualified and had a much higher conversion from click to purchase.
Example: More clicks from a slow page
JavaScript was added to the Bing search results page. This script usually slowed down the page, so everyone expected to see a slight negative effect on the main engagement metrics, such as the number of clicks per user. But the results showed the opposite, there are more clicks! [18] Despite the positive dynamics, we followed the law of Twyman and solved the riddle. Click trackers are based on web beacons, and some browsers did not make a call if the user left the page. [28] Thus, JavaScript affected the accuracy of click counts.
Example: Bing Edge
For several months in 2013, Bing changed its Content Delivery Network from Akamai to its own Bing Edge. Switching traffic to Bing Edge was combined with many other improvements. Several teams reported that they improved the key metrics: the BTR's CTR increased the CTR, features were used more often, and the outflow began to decline. And it turned out that all these improvements were related to the purity of the counting of clicks: Bing Edge improved not only the speed of the page, but also the deliverability of clicks. To evaluate the effect, we launched an experiment in which the beacon approach to tracking clicks was replaced with a page-reload approach. This technique is used in advertising and leads to a slight loss of clicks, slowing down the effect of each click. The results showed that the percentage of lost clicks fell by more than 60%!
Example: MSN Search in Bing
Auto-completion is a drop-down list that offers options for completing a request while a person is typing it. MSN planned to improve this feature with the help of a new and improved algorithm (feature development teams are always ready to explain why their new algorithm is a priori better than the old one, but they often get frustrated when they see the results of experiments). The experiment was a great success, the number of search queries that came to Bing with MSN increased significantly. Following our rules, we began to understand and found out that when a user clicked on a hint, the new code made two search queries (one of which was immediately closed by the browser as soon as the search results appeared).
So the explanation of many positive results may not be so exciting. And our task is to find a real impact on the user, and Twyman's rule has greatly helped in this and in the understanding of many experimental results.
Rule number 3. Your benefits will vary.
There are many documented examples of successful control experiments. For example, “ Which Test Won? ” Contains hundreds of examples of A / B tests, and the list is updated every week.
Although this is an excellent generator of ideas, there are several problems with these examples:
- Quality varies. In these studies, someone from some company talks about the result of the A / B test. Was there an expert assessment? Was it carried out correctly? Were there outliers? Was the p-value small enough (we saw published A / B tests with a p-value greater than 0.05, which is usually considered statistically insignificant)? Were there the pitfalls that we talked about earlier, and which the authors of the test did not check properly?
- What works in one domain may not work in another. For example, Neil Patel [29] recommends using the word “free” in advertisements that offer a 30-day trial version, instead of the “30-day money-back guarantee”. This may work with one product and one audience, but we suspect that the result will depend heavily on both the product and the audience. Joshua Porter [30] states that “Red is better than green” for buttons calling for “Get Started Now”. But since we have not seen many sites with a red button for a call to action, then, apparently, this result is not so well reproduced.
- The effect of novelty and the first time. We achieve stability in our experiments, and many experiments in many examples have not been carried out long enough to verify the presence of such effects.
- Incorrect interpretation of results. Some hidden reason or a specific factor may not be recognized or misunderstood. We give two examples. One of them is the first documented control experiment.
Example 1. Tsinga is a disease caused by vitamin C deficiency. It killed more than 100,000 people in the 16-18 centuries, most of them were sailors who went to long voyages and stayed in the sea longer than fruits and vegetables could survive. In 1747, Dr. James Lind noticed that scurvy was less affected by ships in the Mediterranean. He began to give lemons and oranges to some sailors, leaving others with regular meals. The experiment was very successful, but the doctor did not understand the reason. At the Royal Maritime Hospital in the UK, he treated patients with scurvy with concentrated lemon juice, which he called “rob”. The doctor concentrated it with the help of heat, which destroyed vitamin C. Lind lost faith and began to frequently resort to bloodletting. In 1793, real tests were conducted. and lemon juice became part of the seamen’s daily ration.
Example 2 . Marissa Mayer talked about an experiment in which Google increased the number of results on a search page from 10 to 30. Traffic and profits from users who were looking for at Google fell by 20%. And how did she explain it? Like, the page required more than half a second more to generate. Of course, productivity is an important factor, but we suspect that this only affected a small fraction of the losses. Here is our vision of the reasons:
- In Bing, isolated retardation experiments were carried out [11], during which only performance varied. A server response delay of 250 milliseconds affected revenue by about 1.5% and a CTR of 0.25%. This is a big influence, and it can be assumed that 500 milliseconds will affect the revenue and CTR by 3% and 0.5%, respectively, but not by 20% (assume that linear approximation is applicable here). Older tests in Bing [32] showed a similar effect on clicks and a smaller effect on revenue with a delay of 2 seconds.
- Jake Brutlag from Google wrote in his blog about the experiment [12], which shows that slowing the search results from 100 milliseconds to 400 has a significant effect on the specific number of searches and ranges between 0.2% and 0.6%, which fits very well with our experiments, but very far from the results of Marissa Mayer.
- In BIng, an experiment was conducted showing 20 search results instead of 10. The loss of profit completely offset the addition of additional advertising (which made the page even a little slower). We believe that the ratio of advertising and search algorithms is much more important than performance.
We are skeptical of many of the wonderful results of A / B tests published in various sources. When checking the results of experiments, ask yourself, what level of trust do you have for them? And remember, even if the idea worked on one site, it is not necessary that it will work on another. The best thing we can do is to tell about the reproduction of experiments and their success or failure. It will bring the most benefit to science.
Rule number 4: Speed means a lot
Web developers, who test their features with the help of control experiments, quickly realized that the performance or speed of the site are critical parameters [13, 14, 33]. Even a slight delay in the operation of the site can affect the key metrics of the test group.
The best way to evaluate the effects of performance is to perform an isolated experiment with a slowdown, i.e. just with add delay. Figure 3 shows the standard graph of the relationship between performance and the metric to be tested (CTR, specific success and revenue). Usually the faster the site, the better (higher on this chart). By slowing down the work of the test group relative to the control group, you can measure the impact of performance on the metric of interest to you. It is important to note:
- The effect of slowdowns on the test group is measured here and now (dotted line on the chart) and depends on the site and audience. If the site or audience changes, a decrease in performance may have a different effect on the key metric.
- The experiment shows the effect of deceleration on the key metric. This can be very useful when you are trying to measure the effect of a new feature, the first implementation of which is not effective. Suppose that it improves the metric M by X%, and at the same time slows down the site by T%. Using the experiment with slowing down, we can estimate the effect of slowing down on the metric M, correct the influence of the feature and get the predicted effect X '% (it is logical to assume that these effects have the property of additivity). And in this way we can answer the question: “How will it affect the key metric if it is implemented effectively?”.
- We can assume how the key metric will affect the fact that the site will start working faster and will help to calculate the ROI of the optimization efforts. Using the linear approximation (the first member of the Taylor series), we can assume that the effect on the metric is the same in both directions. We assume that the vertical delta is the same in both directions and is simply different in sign. Therefore, experimenting with deceleration on different values, we can roughly imagine how the acceleration will affect these same values. We conducted such tests in Bing and our theory was fully confirmed.
How important is performance? Critically important. At Amazon, slowing down work by 100 milliseconds leads to a 1% drop in sales, as Greg Linded said [34 p.10]. And speakers from Bing and Google [32] show a significant impact of performance on key metrics.
Example: Server slowdown experiment
In Bing, we conducted a two-week experiment to slow down the service by 100 milliseconds for 10% of users, for 250 milliseconds for the other 10% of users. It turned out that every 100 milliseconds, the acceleration of the service increased revenues by 0.6%. From here, even a phrase appeared that well reflects the essence of our organization: An engineer who will improve server performance by 10 milliseconds (1/30 of the blinking speed of our eyes) will earn the company more than annual earnings. Every millisecond matters.
In the described experiment, we slowed down the server response time, then slowed down the operation time of all elements on the page. But the page has more important parts, and less important parts. For example, users cannot know that the elements beyond the scope of screen visibility have not yet been loaded. But are there any items displayed at once that can be slowed down without affecting the user? As you will see below, there are such elements.
Example: the performance of the right panel is not so critical
In Bing, some items called snapshots are in the right pane and are loaded late (after the window.onload event). Recently we conducted an experiment: the elements of the right panel were slowed down for 250 milliseconds. If this influenced key metrics, it was so insignificant that we did not notice anything. And the experiment involved almost 20 million users.
Page load time (PLT) is often calculated using the window.onload event as a sign of the completion of a useful browser activity. But today, this metric has a serious flaw when working with modern browsers. As shown by Steve Souders [32], the top of the Amazon page is rendered in 2 seconds, while windows.onload works after 5.2 seconds. Schurman [32] stated that they are able to render a page dynamically, so it is important for them to show the header very quickly. The opposite is also true: in Gmail, windows.onload works after 3.3 seconds, whereas on the screen at that moment only the download bar appeared, and all content will be shown after 4.8 seconds.
There are metrics related to time, for example: the time to the first result (say, the time to the first tweet on Twitter, the first search result on the results page). But the term "Perceived performance" is always used to describe the speed of the page, so that the user perceives it to be quite full. The concept of "Perceived performance" is easier to describe intuitively than to formulate it strictly, therefore, none of the browsers have plans to implement the event
perception.ready(). To solve this problem, many assumptions and assumptions are used, for example:- Time to display the top of the page (AFT) [37]. It is measured as the moment when all the top pixels of the page will be displayed. The implementation is based on heuristics, which are particularly complex when dealing with videos, gifs, scrolling galleries and other dynamic content that changes the top of the page. You can set the thresholds on the "percentage of drawn pixels" to avoid the influence of small and minor elements that can increase the measured metric.
- The speed index [38] is a generalization of the AFT, which averages the time during which the visible elements of the page appear on the screen. Speed does not suffer from small elements that appear late, but it is still affected by dynamic content, which changes the top of the page.
- Page phase time and user readiness time [39]. Page Phase Time - The time required for each individual page rendering phase. It is also a measure of how quickly pixels change on a page. User availability is the time it takes to display the main user elements.
The new W3C interface for working with time, proposed in the new HTML standard, provides access to a more detailed separation of events on the page and, most likely, will allow a better understanding of performance problems. All experiments, which we discussed above, were conducted for the desktop version of the sites, but much can be learned from them for mobile interfaces.
At Bing, we use a variety of performance metrics to diagnose the state of a service, but our key metric, “Time to complete our task” (TTS) [24], is beyond the scope of discussing metric measurement issues. The goal of the search engine is for the user to solve his task as quickly as possible. For clickable elements, it is considered a success if the user has not returned for at least 30 seconds after clicking on the element. The time metric needed for user success is correlated with “Perceived performance”. If the page is displayed slowly, users click more slowly and more slowly achieve the desired; if the page starts to work faster, then all the scripts will work faster, the user will be able to interpret the page earlier and achieve the desired faster. Besides, This relatively simple metric does not need heuristics, which usually appear when it comes to measuring time. This metric is very resistant to change, but it is fairly sensitive. Its disadvantage is that it is suitable for those cases when a click is needed, when there are requests in which the user does not need to click anywhere to achieve the goal - in such situations this metric is not applicable.
Rule number 5: reduce the outflow from the page - it is difficult, but to transfer clicks from one area to another - just
The key metric that is measured in Bing during control experiments is the outflow rate, that is, what percentage of users left the page without clicking a single link. Increasing user involvement in the product, reducing churn are very positive results, but these are the metrics that are very hard to change. Most experiments show that you can significantly move the clicks from one area to another, but the outflow changes rarely or to negligible values. Below we describe several experiments in which large changes were made, but the outflow did not change statistically significantly.
Example: Related searches in the right column
In Bing, related search queries are displayed in the right column. for example, if you were looking for "data mining", Bing will show on the right "Examples of data mining", "Advantages of Data Mining", "definition of data mining", "Data mining companies", "data mining software", etc. This can help users change their query and more successfully find the information they need. In the experiment, related search queries were removed from the right column for 10 million users. As a result, user clicks moved to another area, but there was no statistically significant change in outflow (p-value 0.64).
Example: Related searches under top ads
Bing shows related searches in strings that can float in search results if the search engine finds them to be more relevant than the top results of the algorithm. In the experiment, we recorded related searches right below the top advertisement. As a result of this experiment, clicks on related search queries fell by 17%, but there was no statistically significant change in outflow rate (p-value 0.71).
Example: Crop Search Engine Page
Bing sets the page size with search results dynamically, and does not always show the classic 10 blue links. This change was made possible by the stability of the outflow level, which was shown by two experiments:
- When a block with nested links appears, for example, for an “ebay” request, then the CTR for this top block is 75%. Showing 10 results for such a query is meaningless. Therefore, they conducted an experiment: for 8 million users, on whose requests there was an issue with a nested block, only 4 results of the search algorithm were shown under it. There was no statistically significant change in the outflow level (p-value 0.92), but the pages began to load much faster and this feature was implemented in production.
- When the user leaves the search results and then returns using the back button in the browser or repeats the query, Bing in this case returns more lines with search results (14 results). The experiment, which affected 3 million “target” users, showed a statistically significant change in metrics: user revenue fell by 1.8%, page loading slowed down by 30 milliseconds, pagination fell (scrolling through search results), but a statistically significant level change outflow did not occur (p-value 0.93). This change was not made to fight.
Example: advertising link background color
All major search engines are experimenting with advertising background. In a recent experiment with 10 million users, the test color led to a decline in revenue of 12% (annual losses on the order of $ 150 million, if this change had been rolled out to the battle). User clicks moved from advertising to other places on the site, but there was no statistically significant change in the outflow rate (p-value 0.83).
We saw experiments when the outflow improved and the relevance of search results increased significantly. But these are unusual experiments, and the change turned out to be significantly less than one would expect.
This rule is very important because we have seen many experiments (in Microsoft, Amazon, and the stories of others.), In which a module or widget with a good CTR was added to the page. Further, people stated that this is a very useful module for users, because they click on it. But it may be that the module simply pulls over the clicks from other areas of the page. And if such cannibalization takes place, then this module is good only if clicks on it are better. At the same time, the concept of “better” for each site and situation is determined separately. In conclusion, the following can be said: local improvement is a simple task, and global improvement is much more difficult.
Rule number 6: avoid complex experiments, act iteratively
A solid and detailed experiment plan is vital for a good result. Sir R.A. Fisher once said [40]: “Consultation with the analyst after the experiment has ended is like conducting a post-mortem examination. The only thing he can say is that the experiment is dead. ” Experience tells us that simple experiments are the best in the online-world, and despite the fact that they have their own pitfalls [17; 41], they are easier to understand and check for correctness, therefore, they are more reliable. In complex experiments there is no need, besides they can hide bugs. Here are some examples from LinkedIn experience.
Example: LinkedIn Combined Search
In LinkedIn, product launches include many features and components. In 2013, a large-scale search update was carried out, thanks to which auto-completion appeared, a suggestion of options, and, most importantly, a universal search across LinkedIn, which allowed searching simultaneously among different categories of service. In the past, a person had to choose exactly what he was looking for: people, positions or employers. With the universal search, I became smart enough to figure out for myself what exactly you are looking for and to produce a relevant result. But that was not all. Almost every element of the search page was changed: from the left navigation slider to snippets and buttons. The first experiment was conducted with all the changes collected in one heap, and many metrics, and received a biliberd in the target metrics. Then they removed the features one after another for a long time, and found that the fall in clicks and revenues was due to a bundle of features not included in the final version, and not from the universal search itself. After correcting these features, the universal search had a positive effect on user behavior and was swung to the entire audience of the service.
Example: LinkedIn Contacts
LinkedIn recently showed the public a new contact page. It was assumed that it would be easier for people to communicate with each other. Everyone believed that this is a very good feature for users. But when the results of the experiment came, everyone was horrified. The experiment was very complicated, so it was hard enough to figure out where and what went wrong. First of all, the participation of people from the white list was not supposed. Therefore, before attributing the user to the control or test group, it was checked whether the user is eligible to participate in the experiment. Further, depending on the selected group, two more experiments were launched that decided which contact page to show to the user. The experiment plan was rather complicated and it took a while to realize that there was a bug in the user selection procedure. If a user once saw a new contact page, he was whitewashed and permanently deleted from the experiment. No wonder that we saw a growing outflow and fall in user involvement in the test group.
In offline experiments, a complex project may matter, because the test object is finite or expensive, but online, when we have an endless stream of users, we can conduct hundreds of parallel experiments, testing various changes [4; 11]. There are a lot of literature on multi-variable (Mullty-Variable) tests, and commercial products advertise their ability to conduct MV-tests. But we prefer single-variable (such as A / B / C / D) or two-variable tests.
One of the arguments in favor of single-variable tests is their compatibility with the ideology of Agile, which welcomes the creation of MVP [15]: instead of writing code for a complex MVT, run the test as soon as the main feature is ready. You will learn important things after you show the feature to the user. You will see the dynamics in unexpected metrics, get voice feedback, meet bugs, etc. Large MV tests on a new code often turn out to be incorrect due to an error in at least one variable.
We encourage our teams to quickly roll out the code and conduct experiments, and offer them a form of performance monitoring: starting with 1% of the control group with a further increase, if no scandalous deterioration in the metrics was observed. By sticking to Agile-methodologies and not controlling effectiveness through control tests, you risk repeating one of the Knight Capital rollouts, which in August 2012 resulted in a loss of $ 440 million and lowered the cost of Knights by 75%.
Rule # 7: Have enough users.
Methodologies for conducting experiments are often based on mat. expectations, about which it is assumed that they are distributed normally. The central limit theorem states that the average of a random variable is distributed normally if the sample is large enough. Books on applied statistics often suggest that a small number will suffice. For example, article [42] states that in most practical cases, if n> 30, the distribution of averages can be considered normal despite the shape of the initial distribution. As we achieve statistical significance by focusing on the tails of the distributions, we will need much larger samples. We have given advice in previous articles - to use thousands of users, Neil Patel advises tens of thousands of monthly users, but the actual amount depends on the metric you are interested in.
There is a formula for calculating the minimum sample size, it depends on the standard deviation of the metric and on the sensitivity (the expected effect on this metric) [16], but it is assumed that the distribution of averages is normal. Our experience suggests that many of the metrics you are interested in will be biased and the lower bound will have to be too high to be considered a normal distribution.
We came to the conclusion that for each variant the formula
355 * s^2determines the minimum number of independent and equally distributed observations necessary for the average to be considered normally distributed. Here sis the degree of bias in the distribution of the variable, defined as:$$s = \frac{E (X-E (X))^3}{\Var (X)^{3/2}}$$We recommend using this rule when the offset is greater than 1. Below is a table with offset values, sample sizes, and sensitivity obtained in experiments with some metrics in Bing:
| Metrics | Bias | Sample size | Sensitivity |
| Revenue / User | 17.9 | 114 thousand | 4.4% |
| Revenue / User (capped) | 5.2 | 9.7 thousand | 10.5% |
| Sessions / User | 3.6 | 4.7 thousand | 5.4% |
| Time to success | 2.1 | 1,55 thousand | 12.3% |
In our practice, there was a case where on one site the bias of the “number of purchases per person” metric was greater than 10, and the bias of the “revenue from user” metric was greater than 30. Our rule gives a 95% chance that both ends of the distribution, which are usually equal 0.025, will actually be no more than 0.3 and no less than 0.2. This rule was taken from the work of Boos and Hughes-Oliver [43]. Biased distributions with a heavy tail are very frequent in working with web data, so our formula is very useful. The table shows that the revenue per user has a bias factor of 18.2, therefore, 114 thousand users are needed to conduct a valid experiment. Below on chart 4 it can be seen that if we only sample 100 or 1000 users, then the points are bad to fall on the QQ diagonal. This indicates a distribution bias, and therefore the 95% confidence two-sided interval, implying normality, does not coincide with the real one by more than 5%. When we took 100,000 users, the distribution became very close to normal in the range of -2 to 2.

If the metric is heavily biased, then sometimes it is possible to somehow transform its values to reduce the bias, so that the average converges to normal faster. After we limited the “revenue per user” metric to ten dollars a week, we saw that the bias dropped from 18 to 5, the sensitivity increased significantly. With equal sample sizes, limiting specific revenue helps to detect changes that are 30% less than when using the original metric.
Our rule allows us to estimate the number of users necessary to consider the distribution of averages as normal. If it is assumed that the control and test groups have the same distribution, then we will not be able to give any valuable advice just that they are the same size, then the distribution of their differences will be perfectly symmetrical and the bias will be close to 0. In this case, our rule will not be make sense, since it operates when the bias coefficient is greater in modulus 1.
There are more complex calculations that can help reduce the lower limit of the number of users [16]. And for biased distributions with a small number of samples, you can use bootstrap [44].
Conclusion
In this article, we talked about 7 rules for conducting control experiments with examples that we learned from our experience, having conducted thousands of experiments. The first two rules tell us that even small changes on the site can give a big change in the metric, but a positive change happens rarely, and most often the movement is due to small movements obtained in different experiments. If the results of the experiment seem too good, then use the Twyman rule and do not trust this experiment, sort it out deeper, in most cases you will find an error. The third rule concerns any published experiments, we have learned to treat them carefully, and when trying to implement similar solutions, we always check the result with a control test, being ready for the fact that our result may differ. The fourth rule — our favorite — concerns speed. We conducted many experiments to understand the relationship between speed, performance and key metrics, showed that the speed of the server response is a critical indicator for our service. We also showed that the speed of key parts of pages is more important than other elements (for example, the sidebar). Despite our attitude, we doubt some of the examples that resulted in the third rule. The fifth rule is empirical observation, which we think will be clarified later. But it is striking how widely this rule is applicable: it is possible to drive users' clicks to different parts of a page easily and as often as you like, but the level of leaving is very difficult to change. So when doing local optimizations make sure That you did not lower the key metric of another block. The sixth rule suggests not to plan complex experiments, but to roll out small iterations. This idea fits well with the modern Agile paradigm. The seventh rule - provide the lower limit of the number of users required for the control experiment with a shifted distribution. Most of the examples in this article are shown for the first time. They are based on empirical rules and reinforce our belief that experimentation is a necessary thing in product development. We hope that these rules will help the community and stimulate new research, which may add new rules. The seventh rule - provide the lower limit of the number of users required for the control experiment with a shifted distribution. Most of the examples in this article are shown for the first time. They are based on empirical rules and reinforce our belief that experimentation is a necessary thing in product development. We hope that these rules will help the community and stimulate new research, which may add new rules. The seventh rule - provide the lower limit of the number of users required for the control experiment with a shifted distribution. Most of the examples in this article are shown for the first time. They are based on empirical rules and reinforce our belief that experimentation is a necessary thing in product development. We hope that these rules will help the community and stimulate new research, which may add new rules.
Acknowledgments
We want to thank our colleagues who conducted many experiments with us, which helped us to compile this list of seven rules. Mujtaba Khambatti, John Psaroudakis, and Sreenivas Addagatke, were involved in the process of assessing performance and analyzing it. We want to thank for the comments and comments on the drafts of the article Juan Lavista Ferres, Urszula Chajewska, Greben Langendijk, Lukas Vermeer, and Jonas Alves. Comments to the latest drafts gave Eytan Bakshy, Brooks Bell and Colin McFarland.
Literature
- Kohavi, Ron and Round, Matt. Front Line Internet Analytics at Amazon.com. [ed.] Jim Sterne. Santa Barbara, CA: s.n., 2004. ai.stanford.edu/~ronnyk/emetricsAmazon.pdf.
- McKinley, Dan. Design for Continuous Experimentation: Talk and Slides. [Online] Dec 22, 2012. mcfunley.com/designfor-continuous-experimentation.
- Bakshy, Eytan and Eckles, Dean. Uncertainty in Online Experiments with Dependent Data: An Evaluation of Bootstrap Methods. KDD 2013: Proceedings of the 19th ACM SIGKDD Conference on Knowledge Discovery and Data Mining. 2013.
- Tang, Diane, et al. Overlapping Experiment Infrastructure: More, Better, Faster Experimentation. Proceedings 16th Conference on Knowledge Discovery and Data Mining. 2010.
- Moran, Mike. Multivariate Testing in Action: Quicken Loan’s Regis Hadiaris on multivariate testing. Biznology Blog by Mike Moran. [Online] December 2008. www.biznology.com/2008/12/multivariate_testing_in_action.
- Posse, Christian. Key Lessons Learned Building LinkedIn Online Experimentation Platform. Slideshare. [Online] March 20, 2013. www.slideshare.net/HiveData/googlecontrolledexperimentationpanelthe-hive.
- Kohavi, Ron, Crook, Thomas and Longbotham, Roger. Online Experimentation at Microsoft. Third Workshop on Data Mining Case Studies and Practice Prize. 2009. http://expplatform.com/expMicrosoft.aspx.
- Amatriain, Xavier and Basilico, Justin. Netflix Recommendations: Beyond the 5 stars. [Online] April 2012. techblog.netflix.com/2012/04/netflix-recommendationsbeyond-5-stars.html.
- McFarland, Colin. Experiment!: Website conversion rate optimization with A/B and multivariate testing. s.l.: New Riders, 2012. 978-0321834607.
- Smietana, Brandon. Zynga: What is Zynga's core competency? Quora. [Online] Sept 2010. www.quora.com/Zynga/What-is-Zyngas-corecompetency/answer/Brandon-Smietana.
- Kohavi, Ron, et al. Online Controlled Experiments at Large Scale. KDD 2013: Proceedings of the 19th ACM SIGKDD international conference on Knowledge discovery and data mining. 2013. bit.ly/ExPScale.
- Brutlag, Jake. Speed Matters. Google Research blog. [Online] June 23, 2009. googleresearch.blogspot.com/2009/06/speed-matters.html.
- Sullivan, Nicole. Design Fast Websites. Slideshare. [Online] Oct 14, 2008. www.slideshare.net/stubbornella/designingfast-websites-presentation.
- Kohavi, Ron, Henne, Randal M and Sommerfield, Dan. Practical Guide to Controlled Experiments on the Web: Listen to Your Customers not to the HiPPO. The Thirteenth ACM SIGKDD International Conference on Knowledge Discovery and Data Mining (KDD 2007). August 2007, pp. 959-967. www.expplatform.com/Documents/GuideControlledExperiments.pdf.
- Ries, Eric. The Lean Startup: How Today's Entrepreneurs Use Continuous Innovation to Create Radically Successful Businesses. s.l.: Crown Business, 2011. 978-0307887894.
- Kohavi, Ron, et al. Controlled experiments on the web: survey and practical guide. Data Mining and Knowledge Discovery. February 2009, Vol. 18, 1, pp. 140-181. www.exp-platform.com/Pages/hippo_long.aspx.
- Crook, Thomas, et al. Seven Pitfalls to Avoid when Running Controlled Experiments on the Web. [ed.] Peter Flach and Mohammed Zaki. KDD '09: Proceedings of the 15th ACM SIGKDD international conference on Knowledge discovery and data mining. 2009, pp. 1105-1114. www.expplatform.com/Pages/ExPpitfalls.aspx.
- Kohavi, Ron, et al. Trustworthy online controlled experiments: Five puzzling outcomes explained. Proceedings of the 18th Conference on Knowledge Discovery and Data Mining. 2012, www.expplatform.com/Pages/PuzzingOutcomesExplained.aspx.
- Wikipedia contributors. Fisher's method. Wikipedia. [Online] Jan 2014. http://en.wikipedia.org/wiki/Fisher %27s_method.
- Eisenberg, Bryan. How to Increase Conversion Rate 1,000 Percent. ClickZ. [Online] Feb 28, 2003. www.clickz.com/showPage.html?page=1756031.
- Spool, Jared. The $300 Million Button. USer Interface Engineering. [Online] 2009. www.uie.com/articles/three_hund_million_button.
- Goldstein, Noah J, Martin, Steve J and Cialdini, Robert B. Yes!: 50 Scientifically Proven Ways to Be Persuasive. s.l.: Free Press, 2008. 1416570969.
- Collins, Jim and Porras, Jerry I. Built to Last: Successful Habits of Visionary Companies. s.l.: HarperBusiness, 2004. 978- 0060566104.
- Badam, Kiran. Looking Beyond Page Load Times – How a relentless focus on Task Completion Times can benefit your users. Velocity: Web Performance and Operations. 2013. velocityconf.com/velocityny2013/public/schedule/detail/32 820.
- Why Most Published Research Findings Are False. Ioannidis, John P. 8, 2005, PLoS Medicine, Vol. 2, p. e124. www.plosmedicine.org/article/info:doi/10.1371/journal.pme d.0020124.
- Wacholder, Sholom, et al. Assessing the Probability That a Positive Report is False: An Approach for Molecular Epidemiology Studies. Journal of the National Cancer Institute. 2004, Vol. 96, 6. jnci.oxfordjournals.org/content/96/6/434.long.
- Ehrenberg, A. S. C. The Teaching of Statistics: Corrections and Comments. Journal of the Royal Statistical Society. Series A, 1974, Vol. 138, 4.
- Ron Kohavi, David Messner,Seth Eliot, Juan Lavista Ferres, Randy Henne, Vignesh Kannappan,Justin Wang. Tracking Users' Clicks and Submits: Tradeoffs between User Experience and Data Loss. Redmond: s.n., 2010.
- Patel, Neil. 11 Obvious A/B Tests You Should Try. QuickSprout. [Online] Jan 14, 2013. http://www.quicksprout.com/2013/01/14/11-obvious-ab-tests-youshould-try/.
- Porter, Joshua. The Button Color A/B Test: Red Beats Green. Hutspot. [Online] Aug 2, 2011. blog.hubspot.com/blog/tabid/6307/bid/20566/The-ButtonColor-A-B-Test-Red-Beats-Green.aspx.
- Linden, Greg. Marissa Mayer at Web 2.0. Geeking with Greg. [Online] Nov 9, 2006. glinden.blogspot.com/2006/11/marissa-mayer-at-web20.html.
- Performance Related Changes and their User Impact. Schurman, Eric and Brutlag, Jake. s.l.: Velocity 09: Velocity Web Performance and Operations Conference, 2009.
- Souders, Steve. High Performance Web Sites: Essential Knowledge for Front-End Engineers. s.l.: O'Reilly Media, 2007. 978-0596529307.
- Linden, Greg. Make Data Useful. [Online] Dec 2006. sites.google.com/site/glinden/Home/StanfordDataMining.20 06-11-28.ppt.
- Wikipedia contributors. Above the fold. Wikipedia, The Free Encyclopedia. [Online] Jan 2014. en.wikipedia.org/wiki/Above_the_fold.
- Souders, Steve. Moving beyond window.onload (). High Performance Web Sites Blog. [Online] May 13, 2013. www.stevesouders.com/blog/2013/05/13/moving-beyondwindow-onload.
- Brutlag, Jake, Abrams, Zoe and Meenan, Pat. Above the Fold Time: Measuring Web Page Performance Visually. Velocity: Web Performance and Operations Conference. 2011. en.oreilly.com/velocitymar2011/public/schedule/detail/18692.
- Meenan, Patrick. Speed Index. WebPagetest. [Online] April 2012. sites.google.com/a/webpagetest.org/docs/usingwebpagetest/metrics/speed-index.
- Meenan, Patrick, Feng, Chao (Ray) and Petrovich, Mike. Going Beyond onload — How Fast Does It Feel? Velocity: Web Performance and Operations. 2013. velocityconf.com/velocityny2013/public/schedule/detail/31 344.
- Fisher, Ronald A. Presidential Address. Sankhyā: The Indian Journal of Statistics. 1938, Vol. 4, 1. www.jstor.org/stable/40383882.
- Kohavi, Ron and Longbotham, Roger. Unexpected Results in Online Controlled Experiments. SIGKDD Explorations. 2010, Vol. 12, 2. www.exp-platform.com/Documents/2010- 12 %20ExPUnexpectedSIGKDD.pdf.
- Montgomery, Douglas C. Applied Statistics and Probability for Engineers. 5th. s.l.: John Wiley & Sons, Inc, 2010. 978- 0470053041.
- Boos, Dennis D and Hughes-Oliver, Jacqueline M. How Large Does n Have to be for Z and t Intervals? The American Statistician. 2000, Vol. 54, 2, pp. 121-128.
- Efron, Bradley and Robert J. Tibshirani. An Introduction to the Bootstrap. New York: Chapman & Hall, 1993. 0-412-04231- 2.