A / B Test Errors in AirBnB

Today, airbnb has a very interesting post about how they do A / B tests. It seemed to me that the translation of this article would be of interest to the Khabrozhiteli, since many create their own projects, and airbnb analysis methods can be useful as much as possible, at least they will make you think that it would be nice to test the metrics of your product.
Airbnb is an online platform where people meet rental offers and requests of people who are looking for where to stay on a trip. We conduct controlled experiments that allow us to make decisions when developing a product, from design to the creation of algorithms. This is very important when creating user convenience.
The principles for conducting experiments are simple, but often lead to the discovery of unexpected pitfalls. Sometimes experiments stop too fast. Others who do not work on a regular trading platform, for some reason, begin to work on a specialized type of airbnb. We hope that our results will help someone avoid pitfalls and this will allow you to do better design, manage better, and conduct more effective experiments in your projects.
Why experiments?
Experimentation is an easy way to make a user-friendly interface. It is often unexpectedly difficult to tell what you are doing in plain language and see what happens in the first illustration:
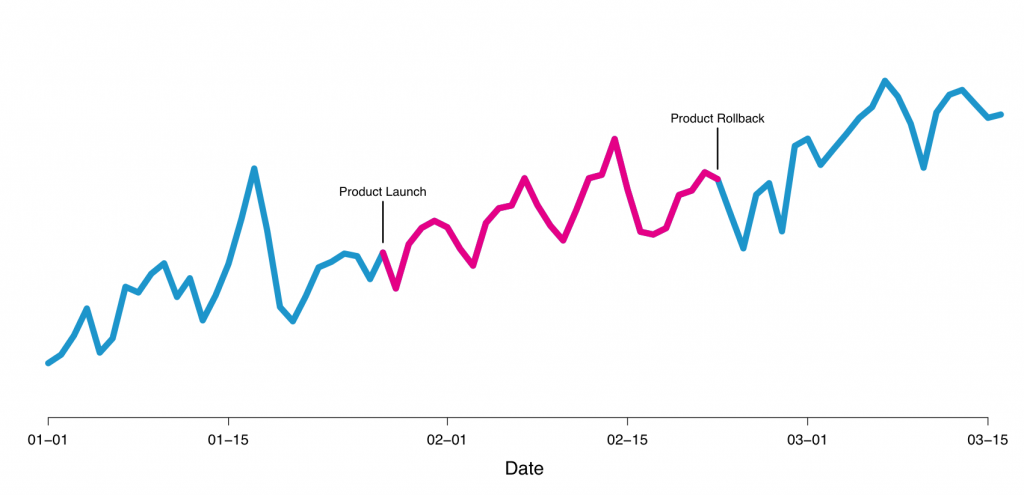
Figure 1
The outside world changes the product a lot. Users can behave differently depending on the day of the week, season, weather (regarding our service, or another tourism project), or they learn about the service through advertising, or organically. Controlled experiments isolate the effect on product change while controlling the aforementioned external factors. In Figure 2, you can see an example of a new feature that we tested, but which was abandoned. We thought that we would introduce a new way of choosing a price that would be pleasant for the user, but received a decrease in conversion, so we abandoned it.
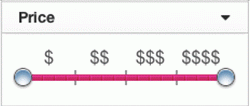
Figure 2 is an example of a new feature that we tested, but refused.
When you test single changes like this, the methodology is usually called A / B testing or split tests. This post does not contain basic information about using A / B tests. There are several large companies where you can find similar services. For example, Gertrude , Etsy's Feature , and Facebook's PlanOut ,
Testing in AirBnb
At AirBnB, we created our own A / B testing framework in which it is possible to run experiments. There are several special features in our business that are tested more thoroughly than regular button color changes and that is why we made our own framework.
Firstly, users can browse the site when they are authorized or not authorized, which makes testing quite difficult. People often switch between devices (between web and mobile) between bookings. Also, the reservation may take several days, and therefore we must wait for the results. As a result, applications and quick responses from homeowners are factors that we also want to control.
There are several variations when booking. First, the visitor uses the search. Then contact the landlord. Then the landlord confirms the application and then the guest makes a reservation. In addition, we have variations that can also lead to reservations in other ways - the guest will immediately book without contacting the host or can make a reservation request right away. These four are visually shown in Figure 3. We combined the process of going through these steps and the overall conversion between search and booking, which are our main indicators.

Figure 3 - Example Experiments
How long does it take to experiment
The biggest source of confusion in online experiments is that you don’t know how long you have to conduct an experiment to get a result. The problem is that when you naively use p-value as a criterion for stopping an experiment and rely on these results. If you continue to monitor the test and P-value results, then you will most likely see the effect. Another common mistake is to stop the experiment too soon before the effect becomes visible.
Here is an example of our experiments that we launched. We tested the maximum price value that participates in the filter on the search page, changing it from $ 300 to $ 1000:
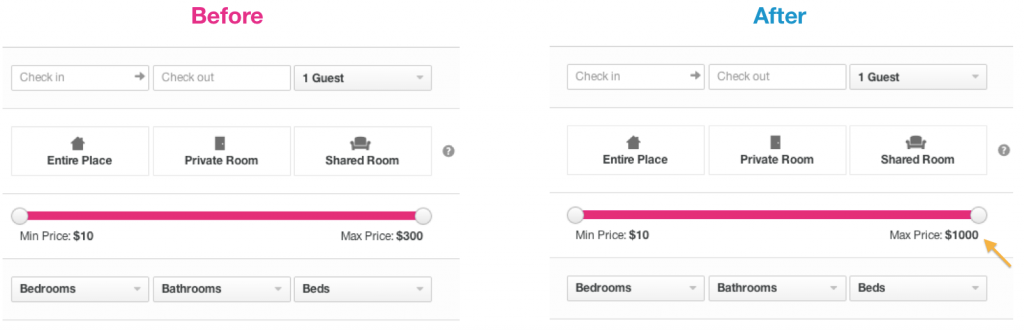
Figure 4 - Example of testing the price in the filter
In Figure 5, we show a time test. The upper graph shows the treatment effect , and the lower graph shows the dependence of p-value on time. As you can see, the P-value exceeds 0.05 after 7 days, in which the effect value is 4%. If we would stop the experiment there, then we did not get the significant results that we got when booking. We continued the experiment and reached the point where the experiment became neutral. The final effect was almost equal to zero p-value, signaling that only noise remained.
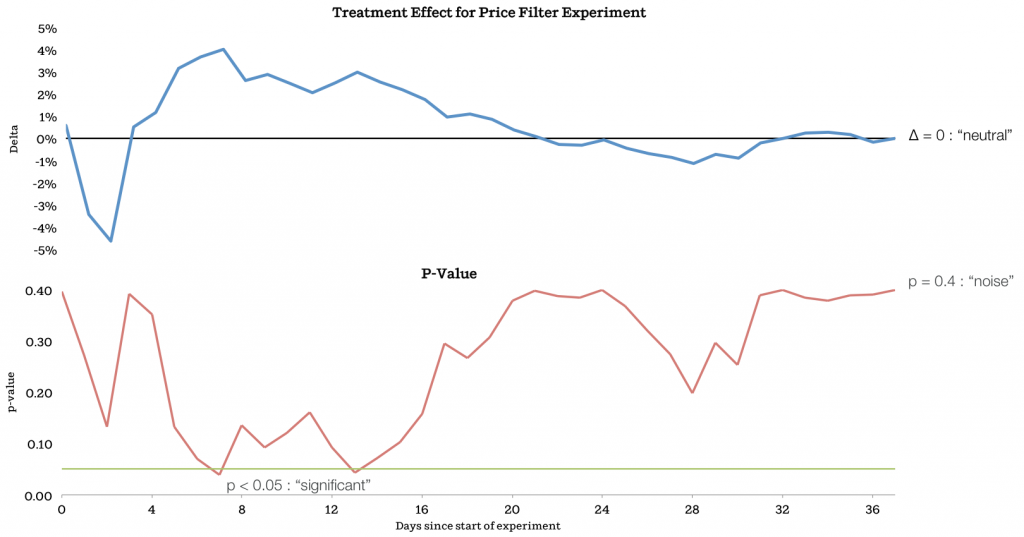
Figure 5 - the result of the dependence of the experiment filter on time
Why didn’t we stop the experiment when the p-value was 0.05? It turns out that this does not happen in conventional systems. There are several reasons for this. Users often take a long time to decide on an order and early orders too much influence the start of an experiment.
To get the right result, you must perform a statistical test every time you calculate the p-value, and the more you do it, the more likely it is to get an effect.
Please note that people who worked closely with the site might notice that during the test launch for the maximum price value, the effect was neutral. We found that certain users who book rather expensive homes do not greatly affect this metric, as they book quickly.
How long should the experiment be run to prevent negative changes? Best practice is to run experiments with minimal effects that allow you to calculate the size of the effect.
There is a moment when an experiment leads to success or failure, even when the time has not yet come. In the case of price filtering, the example that we showed an increase was the first achievement, but the graph did not show it explicitly because the curves did not converge. We found this point very useful when the results may not be completely stable. This is important for research and development of important metrics, so rather consider a single result with a p-value.
We can use this example to further understand exactly when to stop the experiment. This can be useful if you are doing many experiments at the same time. Intuition tells you that you should be distrustful of any first results. Therefore, when the results are too low at the beginning - it does not mean anything.
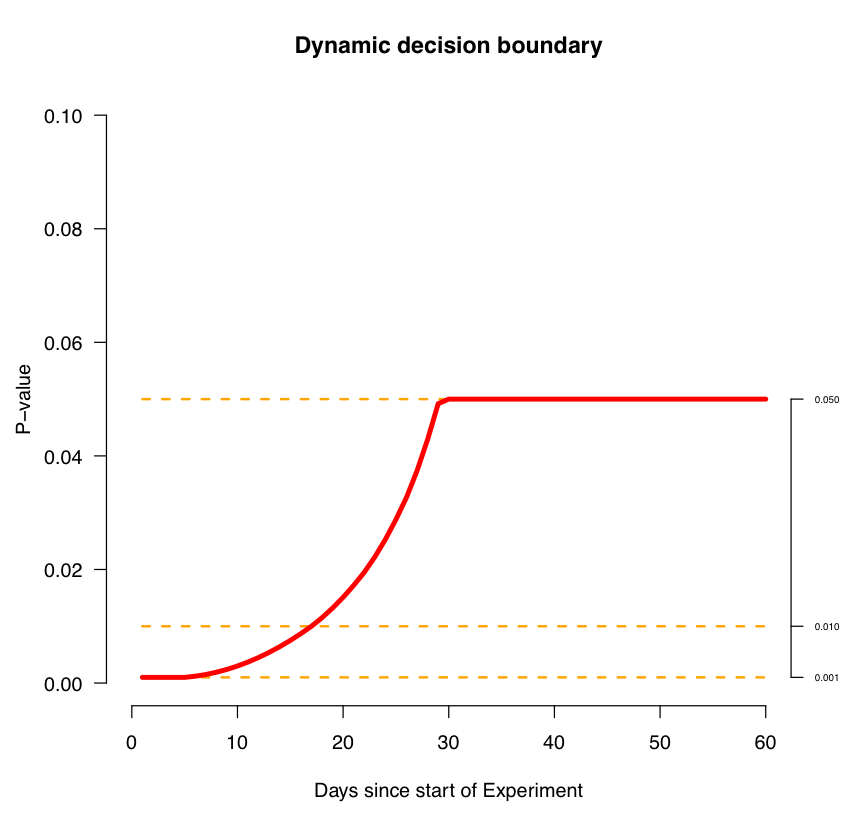
Figure 6
It should be noted that this curve is partly a parameter of our system, which we use in experiments. There will be values for your project.
The second trap is the analysis of results in a general context. Basically, the practice of assessing the success of an experiment is based on a single metric. However, because of this, you can miss a ton of valuable information.
We give an example. Last year we spent redesigning our search page. Search is a fundamental component of Airbnb. This is the main interface of our product and the most direct way to engage users with our site. Therefore, it is so important to make it right. In Figure 7, you can see the page before and after the changes. The new design contains a larger image size, a large map that shows where the objects are located. You can read about design changes in another post.
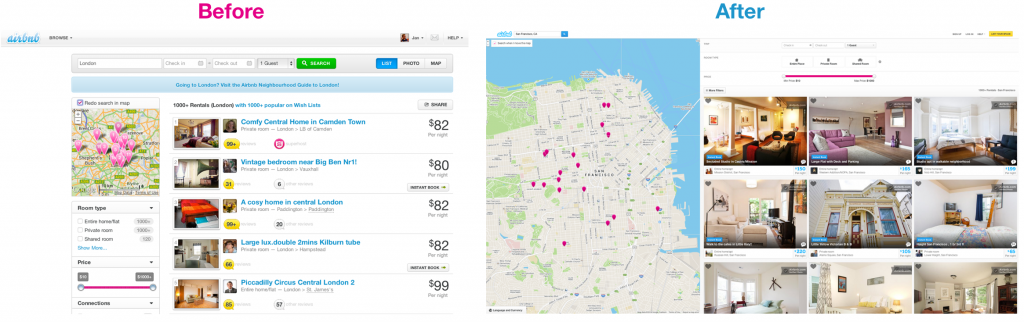
Illustration 7
We spent a lot of work on this project and we thought and tried to make the design as good as possible, after which we wanted to evaluate our design using an experiment. It was a great temptation to launch the design and show it immediately to everyone so as not to miss the marketing opportunity. However, bracing ourselves, we first tested the new design.
After waiting for a sufficient amount of time according to the methodology described above, we got the results. Global metric changes were tiny and a p-value signaled zero effect. However, we decided to look deeper at the results in order to understand all the causes and effects. We found that the new design was better in most cases, with the exception of Internet Explorer. Then we decided that the new design breaks the ability to click in older versions of this browser, which significantly affected the results. When we fixed this, IE started showing close results to other browsers, showing a 2% increase.
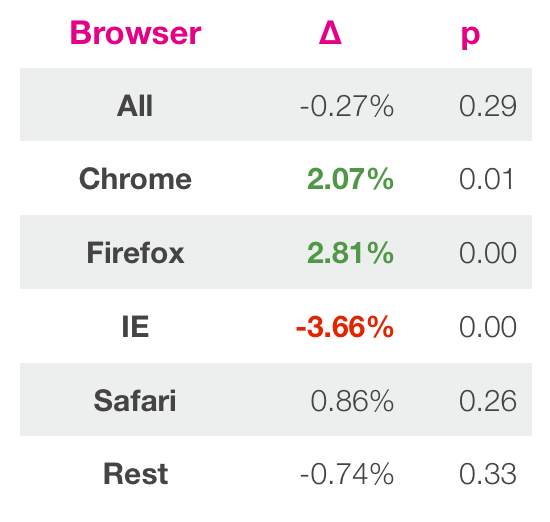
Figure 8
This taught us to be more careful about testing in IE. This example illustrates well that you need to understand the context of testing. You can get low results for many reasons similar to browser version, country, and user type. Regular frameworks may simply not reflect some specifics that you can discover by manually exploring. You can run the same tests many times, but in the end, find a small thing that will lead to a significant effect. The reason for this may be that you run many tests at once, assuming that they all work independently, but that is not the case. One way to achieve this is to lower the p-value to a level where you decide that the effect is real. Read more about this here.
System should work
The third and final pitfall today is the assumption that the system is working. You may think that your system is working and experiments are passing. However, the system may not reflect reality. This can happen if the framework is damaged or you are using it incorrectly. One way to evaluate the system and your understanding of it is to formulate hypotheses and test them.
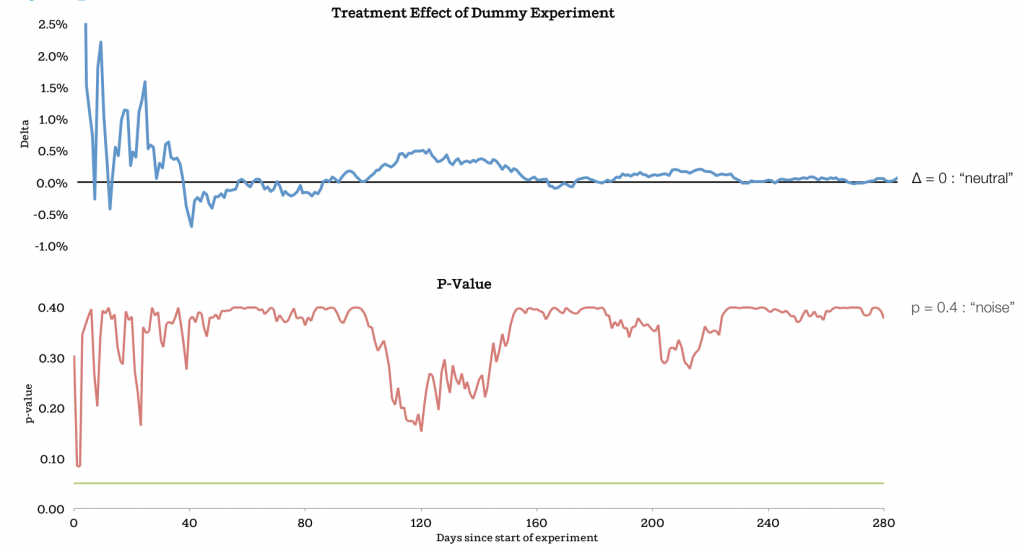
Figure 9
Another way to look at results that might seem too good to be true. When you study results similar to these, it is good practice to study them carefully before you consider them true.
The simplest example is when treatment is equal to the control value. This is called A / A or dummy experiments. In an ideal world, a system will return neutral results. But what does your system return? We have run many experiments similar to these (Figure 9) and compare the assumptions with the results. In one case, we launched dummy experiments.
You can see that in experiments where controlled and treatments groups with similar sizes, the results look like this.
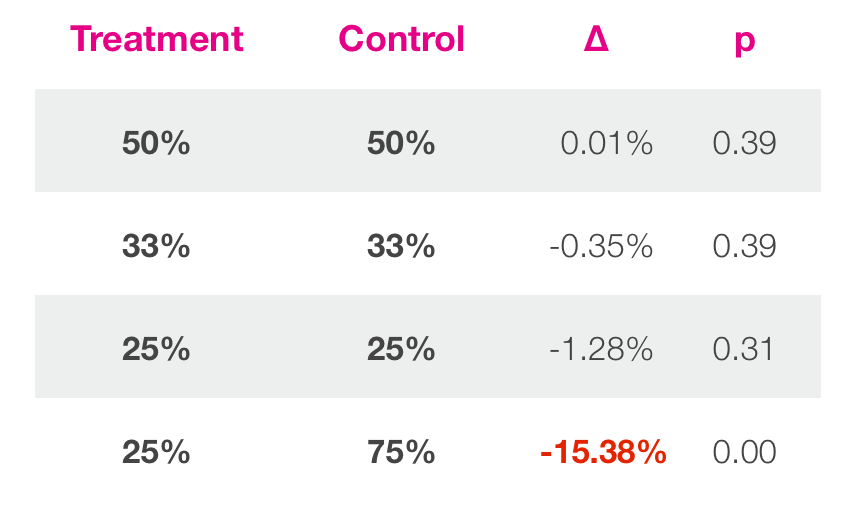
Figure 10
Conclusion
Controlled experimentation is a good way to make decisions when developing a product. Hopefully, the tutorials shown in this post will help prevent some of the mistakes made during A / B testing.
Firstly, the best way to determine how long an experiment should take to draw conclusions. If the system gives you early results, you can start making a lax assessment or the trends should converge. You need to be conservative in this scenario.
It is important to look at the results in their context. Assign them to meaningful groups and try to understand them more deeply. Basically, experimentation can be a good discussion on how to improve a product, rather than start aggressively optimizing a product. Optimization is not impossible, but often not guided by an adventurous impulse. By focusing on the product, you can discuss and make the right decision.
In the end you need to be with you with your reporting system. If something doesn't look right or seems too good to be true, then study it. The easiest way to do this is to run dummy tests, because any knowledge of how the system behaves will be useful for understanding the results. In AirBnb, we found enough bugs due to this.
[ Source]
PS In just a week , the SVOD conference will be held in Silicon Valley , which still has the opportunity to get there;)